Thawing Permafrost Lessons Labs By Bruce Taterka West

Thawing Permafrost Lessons & Labs By Bruce Taterka, West Morris Mendham High School and Rose Cory, University of Michigan Version 1. June 13, 2014. This presentation is meant to be used in conjunction with the companion Thawing Permafrost Lessons & Lab Manual. Feedback and questions are welcome: Bruce Taterka: btaterka@gmail. com Rose Cory : rmcory@umich. edu

Thawing Permafrost Lessons & Labs By Bruce Taterka, West Morris Mendham High School and Rose Cory, University of Michigan Lesson 1 – What is Permafrost?

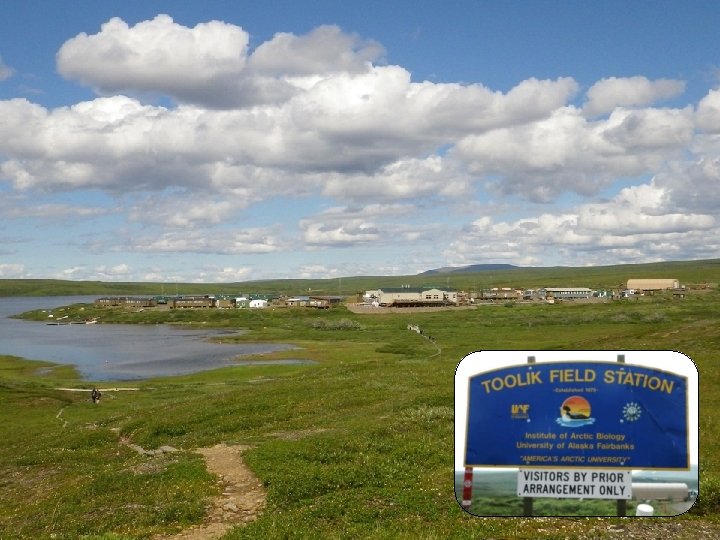
Photo by Zeb Polly

Photo by Zeb Polly

International Permafrost Association, 1998

CO 2 respiration & decomposition photosynthesis organic matter

? CO 2 ~1, 600 billion tons C

Most intense warming effects are seen in the Arctic Courtesy of NASA

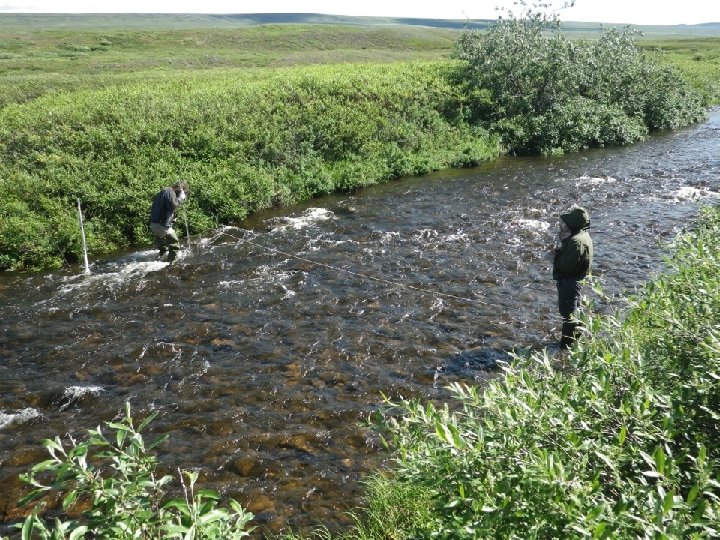
Measuring thaw depth

Control Container with leaf litter Figure 1. Soil respiration experimental setup & results.

Thawing Permafrost Lessons & Labs By Bruce Taterka, West Morris Mendham High School and Rose Cory, University of Michigan Lesson 2 – Climate Feedback Loops

Heat reflected into space keeps earth cool September 2012 1979 Open ocean absorbs heat And so on. . . More ice melts Climate warms

Thawing permafrost releases CO 2 More CO 2 causes warmer temperatures And so on. . . Warmer temperatures increase thawing permafrost

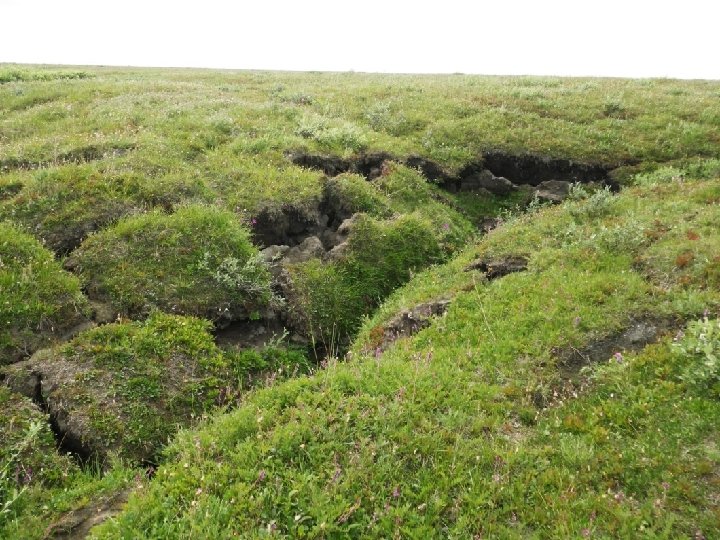
“Thermokarst”

Thawing Permafrost Lessons & Labs By Bruce Taterka, West Morris Mendham High School and Rose Cory, University of Michigan Lesson 3 Dissolved Organic Matter in Natural Waters

Arctic Carbon Balance On Land: 10 – 30 g C/m 2/yr storage Freshwater: 20 – 30 g C/m 2/yr loss

Water Tracks

Ponds & Wetlands

Lake I-8 outlet Lake I-8 inlet

Global Carbon Cycle Permafrost soils 1, 600 Numbers are in billions of tons of C Use d n a L + l e Fossil Fu inus m s i s e h t n Photosy ion 3/yr respirat Land (plants & soil) 2, 400 Land to water 2. 7 Lakes 150 Hansell 2002, Canadell et al. 2007, Battin et al. 2009, Aufdenkampe et al. 2011, Tarnocai et al. 2009, Batjes 9/yr n o i 2. 1 Atmosphere 860 2. 2/yr s a v E Rivers Lake and river burial 0. 6 – 1. 6 / yr 0. 7 Oceans 39, 000

An example of natural waters containing a range of DOM from Chester, NJ

Thawing Permafrost Lessons & Labs By Bruce Taterka, West Morris Mendham High School and Rose Cory, University of Michigan Lesson 4 Effect of Sunlight on Organic Molecules

Light and dark samples of black cherry soda after being left outside from May 15 -23. Experimental setup. Light and dark samples of natural beet juice on left; light and dark samples of black cherry soda on right. Samples were exposed to sunlight from May 15 -23. Light and dark samples of beet juice after being left outside from May 15 -23.
, and dark")
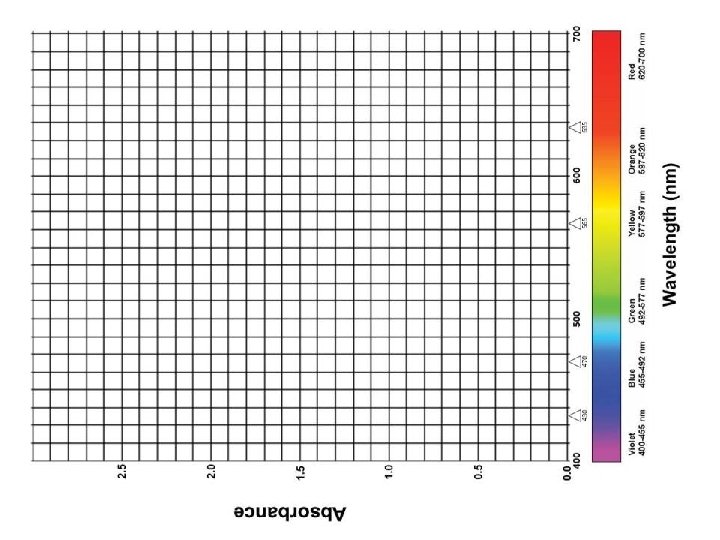
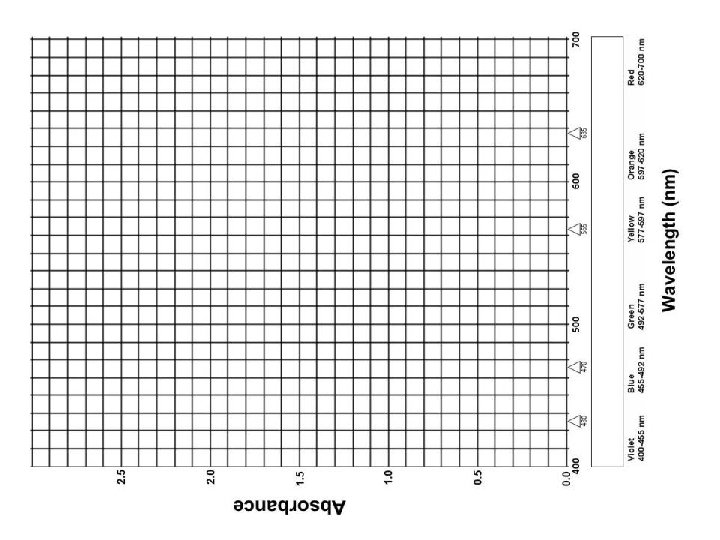
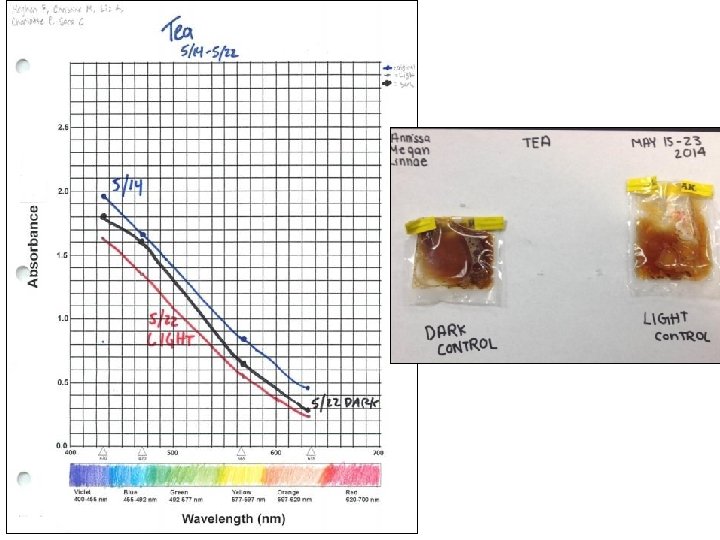
Student graph showing absorption curves for orange soda on May 15 (blue), and dark and lightexposed samples on May 22 (black and red). Light and dark samples of orange soda after being left outside from May 15 -23. Cuvettes holding samples of light-exposed and dark orange soda to be analyzed for light absorption at 430, 470, 565, and 635 nm.

Photos of light-exposed and dark control samples of black cherry soda and beet juice, along with absorption graphs.

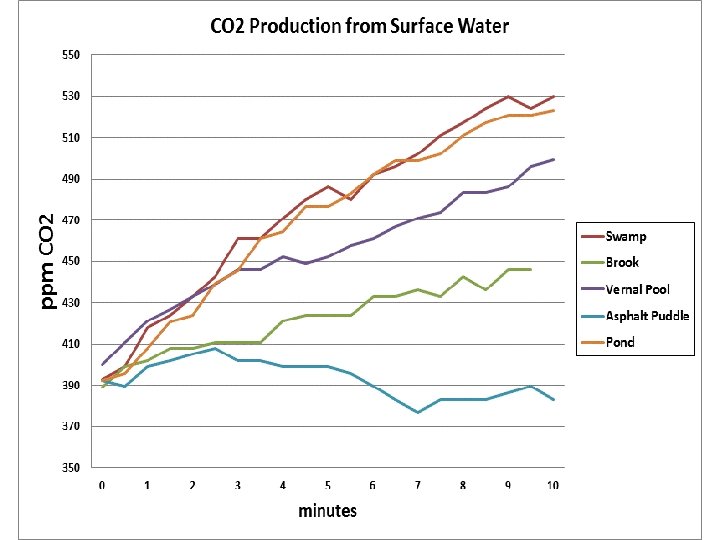
Thawing Permafrost Lessons & Labs By Bruce Taterka, West Morris Mendham High School and Rose Cory, University of Michigan Lesson 5 Respiration from Natural Waters

Instructions for Floating CO 2 Chamber Step 1. Get a large plastic pretzel barrel and cut it in half, or use a plastic storage container or file box. Step 2. Cut a hole in it to fit your CO 2 sensor Step 3. Wrap a piece of foam pipe insulation around container for stability. Tape or attach with cable tie. Step 4. Float it! You can tell if it’s tight if there’s suction when you pull it from the water.

Vernal pool Pond Swamp Brook

- Slides: 36