THAMMASAT UNIVERSITY Relationship between growth inequality and poverty

THAMMASAT UNIVERSITY Relationship between growth, inequality and poverty and propoor growth in. Chaleampong Thailand: 1986 – 2011 Kongcharoen Faculty of Economics, Thammasat University 14 August 2014 Faculty of Economics 1

THAMMASAT UNIVERSITY Motivation • Thailand economic development in past three decades results in rapid growth in income per capita. • An income distribution hardly changed over the period. • Pro-poor growth may be referred as growth that benefits the poor. [Kakwani and others (2004)] • The World Bank’s definition of pro-poor growth is weak. Faculty of Economics 2

THAMMASAT UNIVERSITY Objective • Examine the effect of economic growth on poverty and income distribution in Thailand both in overall country and by region. • The question is “whether the poor benefit from the rapid growth, i. e. , is the growth pro-poor? ” • We further investigate the relationship between income growth, poverty and income inequality in Thailand over last three decades. Faculty of Economics 3

THAMMASAT UNIVERSITY Methodology • Poverty and Income Inequality Measures – Poverty measures • Headcount Index – the ratio of the poor to the total population • Poverty Gap Index – the difference between the poor’s income and poverty line • Squared Poverty Gap Index or Poverty Severity Faculty of Economics 4

THAMMASAT UNIVERSITY Methodology • Faculty of Economics 5

THAMMASAT UNIVERSITY Methodology • Poverty and Income Inequality Measures – Income Inequality Measures • Gini coefficient • Poverty Reduction Decomposition – Datt and Ravallion (1992) Decomposition - the change in poverty can be decomposed into growth-driven and redistribution-driven components. – Shapley Value Decomposition Approach Faculty of Economics 6

THAMMASAT UNIVERSITY Methodology • Faculty of Economics 7

THAMMASAT UNIVERSITY Methodology • Pro-poor Growth Index – Absolute Measures • Growth Incidence Curve • Rate of Pro-Poor Growth Faculty of Economics 8

THAMMASAT UNIVERSITY Methodology • Faculty of Economics 9
 from year 1986 to 2011.")
THAMMASAT UNIVERSITY Data • Uses the Socio-Economic Survey (SES) from year 1986 to 2011. • The poverty line data is from the National Economic and Social Development Board (NESDB). Faculty of Economics 10

THAMMASAT UNIVERSITY Poverty and Income Inequality in Thailand, 1986 - 2011 Figure 2: Headcount Index • ������ 62% ���� 1986 ����� 15% ���� 2011 • ������������ ����� Faculty of Economics 11

THAMMASAT UNIVERSITY Poverty and Income Inequality in Thailand, 1986 - 2011 Figure 3: Headcount Index by Regions Figure 4: Poverty Gap by Regions • ������������������������� • ������������� Faculty of Economics 12

THAMMASAT UNIVERSITY Poverty and Income Inequality in Thailand, 1986 - 2011 Figure 5: Gini Coefficient and Headcount Index, whole kingdom, 1986 – 2011 ������� 1986 ��� 2011 ������������� ����� Faculty of Economics 13

THAMMASAT UNIVERSITY Poverty and Income Inequality in Thailand, 1986 - 2011 Figure 6: Gini coefficient by Regions, 1986 – 2011 ������� • ������������� ����������� Faculty of Economics 14
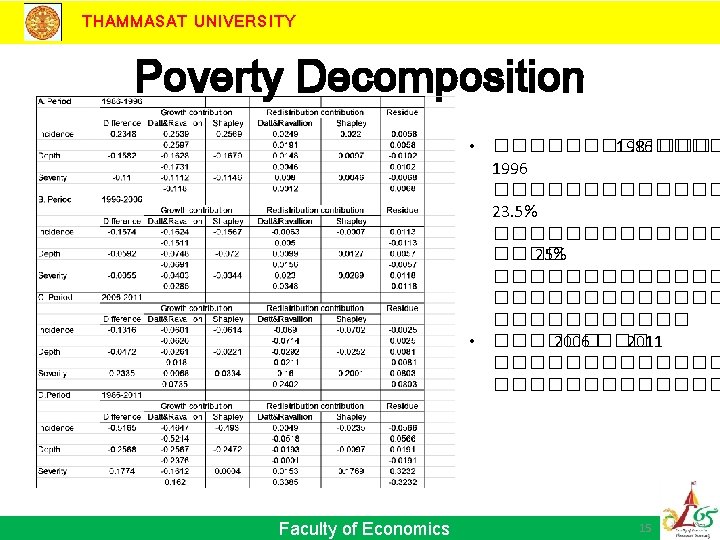

THAMMASAT UNIVERSITY Poverty Decomposition, by Regions • �������������� ������� Faculty of Economics 16
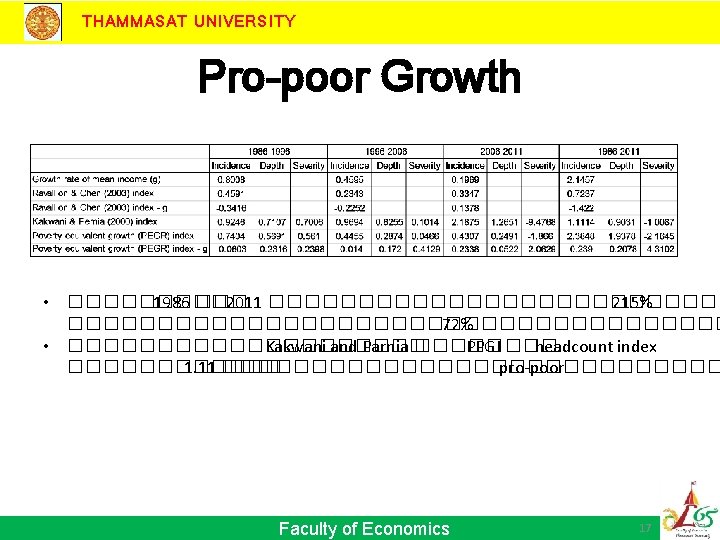

THAMMASAT UNIVERSITY Pro-poor Growth ���������� PPGI > 1 ���������� Faculty of Economics 18

THAMMASAT UNIVERSITY Relationship among Growth, Poverty and Income Distribution • ����� panel data ���������� cross-sectional unit • ������������������������������������� • ������������� GINI ����������� Faculty of Economics 19

THAMMASAT UNIVERSITY Conclusion • Poverty measures have been improved over time corresponding with the economic growth. • Income distribution hardly changed over the period. • The growth is pro-poor for every region except Bangkok. • The estimation results show that there is the negative relationship between income and poverty but. Faculty no ofrelationship with Economics 20
- Slides: 20