Text Classification from Labeled and Unlabeled Documents using

Text Classification from Labeled and Unlabeled Documents using EM by Nigam, Mc. Callum, Thrun, Mitchell Machine Learning, 2000 Ablai | Kristie | Cindy | Shayan

Problem Statement Text Classification - is a fundamental problem in NLP, which involves assigning tags or categories to text according to its content. Broad application area: ● Spam detection ● Sentiment analysis ● Topic labeling and so on

Text Classification Example: spam filtering Naive Bayes Classifier:

Labels in NLP ● Labels are expensive ● Labeling is slow ● Human is error-prone ● Usually free ● Large amount of unlabeled data ● Could be categorized by domain

Employing Unlabeled Data

Employing Unlabeled Data

Employing Unlabeled Data

Employing Unlabeled Data

Overview 1. M-step: train a NB classifier on labeled data 2. E-step: label unlabeled data 3. M-step: train a new NB classifier on the data 4. E-step: relabel the data Contributions: �� -EM, significant performance improvements Repeat until convergence

Mixture Model Data modelled in terms of a mixture of components, where each component has a simple parametric form (such as multinomial, Gaussian) Each cluster (component) is a generative model

Generative Model ● Why called ‘generative’ model? ○ We assume there are underlying models that may have generated the given data ● Each cluster is parameterized by a disjoint subset of θ ● But we don’t know these parameters of the underlying model ● So estimate the parameters for all component clusters

Naive Bayes Classifier a generative classifier

● With training data, a certain probability distribution is assumed ○ multinomial distributions → Naive Bayes classifier (a mixture of multinomials) ● Distribution’s required parameters are calculated to be used in the classifier: ○ plug parameters into Bayes’ rule (later)

Assumptions 1. data produced by a mixture model 2. 1 -1 correspondence between mixture components of the mixture model and classes of the classification problem 3. naive Bayes assumption of word independence → reduces number of parameters

Model Parameters of a mixture component: ● word probabilities (probability of a word given a component): P(x|c) ● mixture weight, ie class prior probabilities (probability of selecting a component): P(c)
, P(Y) Want to find parameter values that")
Training Classifier Learning = estimating parameters P(X|Y), P(Y) Want to find parameter values that are most probable given the training data How: use ratios of counts from labeled training data + smoothing (example to follow)

Example Label email that contains text: “Free $$$ bonus” Training data: Email Class Label Free while supplies last Not spam Unlimited $$$ Spam Your free bonus offer Spam Example adapted from “A practical explanation of a Naive Bayes classifier”, Bruno Stecanella

Example Goal: calculate whether the email has higher probability of being spam/not, using Bayes’ rule

Example Make naive Bayes assumption

Example In order to estimate parameters, find ratios of counts = =

Example Email Class Label Free while supplies last Not spam Unlimited $$$ Spam Your free bonus offer Spam word P(word | spam) P(word | not spam) free 1/6 1/4 $$$ 1/6 0/4=0 bonus 1/6 0/4=0 Need to apply Laplace smoothing!

Example Augment numerator and denominator of ratios with “pseudo-count” = =
 P(word | notspam) free (1 + 1) / (6")
Example word P(word | spam) P(word | notspam) free (1 + 1) / (6 + 9) (1 + 1) / (4 + 9) $$$ (1 + 1) / (6 + 9) (0 + 1) / (4 + 9) bonus (1 + 1) / (6 + 9) (0 + 1) / (4 + 9) P(spam | free $$$ bonus) = P(free | spam) * P($$$ | spam) * P(bonus | spam) * P(spam) P(not spam | free $$$ bonus) = P(free | notspam) * P($$$ | notspam) * P(bonus | notspam) * P(notspam) P(spam | free $$$ bonus) > P(not spam | free $$$ bonus) → label as spam

Using Classifier 1. Calculate probability that a particular mixture component generated the document using Bayes’ rule, using estimated parameters 2. Label: class with the highest posterior probability of generating the document Naive Bayes classifier was shown to do a good job at text classification but can do better… (Next: by applying EM to naive Bayes to improve parameter estimation/classification accuracy)

Expectation Maximization

Preface to Expectation Maximization: Revisit K-Means Randomly initialize centers Assign each point to one cluster based on distance. Recompute center based on average of points inside. Image: http: //stanford. edu/~cpiech/cs 221/handouts/kmeans. html

Preface to Expectation Maximization: Revisit K-Means Iteration Membership: Fix Centers. Assign points to one class. Readjust center: Fix point memberships. Recompute center. What if we want to estimate a probability for how likely the point belongs to each class?

Hard Clustering vs. Soft Clustering Hard Clustering Every object is assigned to one cluster i Ai = 0 or 1 ∑(Ai) = 1 for all clusters i Soft Clustering 0 ≤ Ai ≤ 1 Q: How do you do this soft clustering?

Mixture Models Each cluster is a generative model: Gaussian or Multinomial ● Parameters of the model are unknown -- to be estimated How to estimate? Expectation Maximization!

Expectation Maximization: Basic Example Assume we use 1 -D Gaussian model. Assume we know how many clusters k. If we know true assignments, Images from Victor Lavrenko

Expectation Maximization: Basic Example If we don’t know true assignments BUT know Gaussian parameters, You can guess how likely each point belongs to each cluster Likelihood Posterior Images from Victor Lavrenko Likelihood: Prior

Expectation Maximization: Basic Example Issue: What if we don’t know those Gaussian parameters? We need to know those Gaussian parameters… to calculate those posterior probabilities But we need to know cluster posterior probabilities to estimate Gaussian parameters You can guess how likely each point belongs to each cluster Likelihood Posterior Images from Victor Lavrenko Likelihood: Prior
 ● Each has")
Expectation Maximization: Basic Example Initialization: Randomly initialize k Gaussians (assume Gaussian) ● Each has their own mean and variance E-step: Fix model parameters. “Soft” assign points to clusters. ● Each point has probability of belonging to each cluster M-step: Fix membership probabilities. Adjust parameters that maximize the expected likelihood

Expectation Maximization: Basic Example Recalculate means and variances for each cluster. Images from Victor Lavrenko

Break When we come back: Wrapping up Basic EM

Why pick EM? ● Unlabeled data -- want to discover clusters ● Assume each cluster has underlying model ● To estimate, need iterative method for parameters If interested in which model belongs to which class label… Happy Volunteer Samaritan Cheat (curse words) Scam

Spam? Not spam? EM and Text ● Words in a document !! Free $$$ Free while supplies last! ○ Word count ○ Multinomial distribution word Word count, spam Word count, Not spam free 1 1 $$$ 1 0 supplies 0 1 Given this class label, how likely will you generate this bag of words?

Naive Bayes and EM 1. Initialization: Naive Bayes - estimate classifier parameters from labeled data 2. Loop: a. Assign probabilistically-weighted class labels to each unlabeled document using EM b. Estimate new classifier parameters using BOTH labeled and unlabeled data

Limitations to Basic EM Let’s look at the assumptions… 1. All data are generated by the mixture model a. Generated data uses the same parametric model used in classification 2. 1 -to-1 correspondence between mixture components and classes Unlabeled data helps when there is very limited labeled data… But what if there are lots of labeled data?

Augmented EM - Part 1 1. Assumption: All data are generated by the mixture model When enough labeled data is already provided, unlabeled data overwhelms and badly skews estimates → Introduce a parameter 0 ≤ λ ≤ 1 to decrease unlabeled documents Labeled data contribution Prior Unlabeled data

Augmented EM - Part 1 → By weighing unlabeled documents by λ, you are weighing the word counts of unlabeled documents less by a factor of λ λ is selected based on cross-validation → When setting 0 < λ < 1 , classification improves

Augmented EM - Part 2 Assumption: 1 -to-1 correspondence between mixture components and classes → Many-to-one correspondence Ex: One class may be comprised of several different sub-topics. Machine Learning → neural networks, Bayesian, regression, … activation Re. LU One multinomial distribution may not be enough! F-statistic ANOVA

Experiments A discussion on the practical results of this approach

Empirical Validation of the Proposed System ● Validation of all their claims: ○ Unlabeled data and overall efficacy ○ Weighting ○ Multiple mixture components

Datasets ● Task: Text Classification ● We need datasets!

Datasets: Use. Net - General Information ● ● Available at: http: //qwone. com/~jason/20 Newsgroups/ 20 Different newsgroups (The labels) 20017 articles Not a considerable class imbalance (important)

Datasets: Use. Net - In this work ● They… ○ ○ ○ 62258 unique words Used a test set of 4000 articles in the latest portion (20%) of the timeline ■ The task is usually predicting the future classes not the past. Train set is composed of ■ 10000 randomly selected articles from the rest, as unlabeled ■ 6000 documents used for labeled examples

Datasets: Web. KB - General Information ● Available at http: //www. cs. cmu. edu/~webkb/ ● 8145 Webpages from CS depratments ● Categories: ○ Student, faculty, staff, course, project, department, other

Datasets: Web. KB - In this work ● Only the four main categories are used (that have more data) ○ ○ 4199 pages Numbers are converted to either time or phone number token ● Did not perform stemming or stoplist ○ Showed that actually hurts the performance ● Vocabulary is limited to the main 300 words (most informative words) ● This vocabulary size is selected empirically ● Test using the leave-one-university-out approach ○ ○ ○ One complete CS department data 2500 randomly selected from the rest: unlabeled set Trainset: same as before

Datasets: Reuters - General Information ● Available at http: //www. daviddlewis. com/resources/testcollections/reuters 21578/ ● 12902 articles ● 90 categories from the Reuters newswire

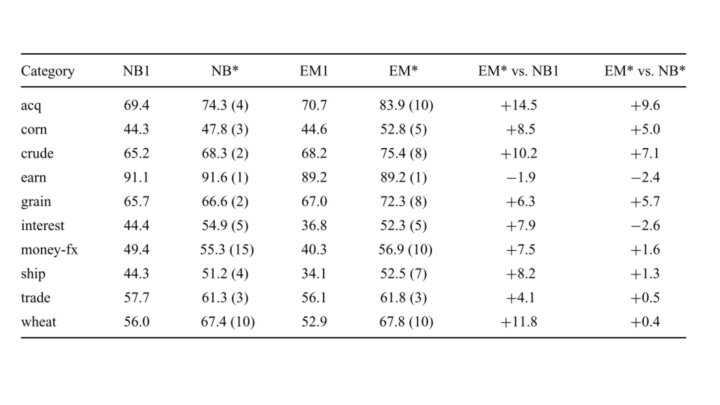
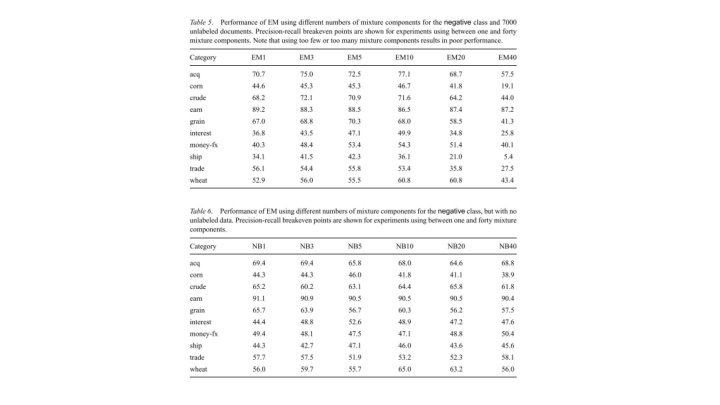
Datasets: Reuters - In this work ● Use all the data ● Binary classifiers for top 10 populous classes ● Vocabulary size is selected based on the labeled data and leave-one-out cross validation ● Randomized selection ○ ○ Later 3299 form the test set - 9603 remaining 7000 unlabeled ● Because of imbalance, they focused on precision and recall scores.

Observations

Effect of labeled documents

Effect of labeled documents

Effect of unlabeled documents

Varying the weight of unlabeled data

Performance Reviews

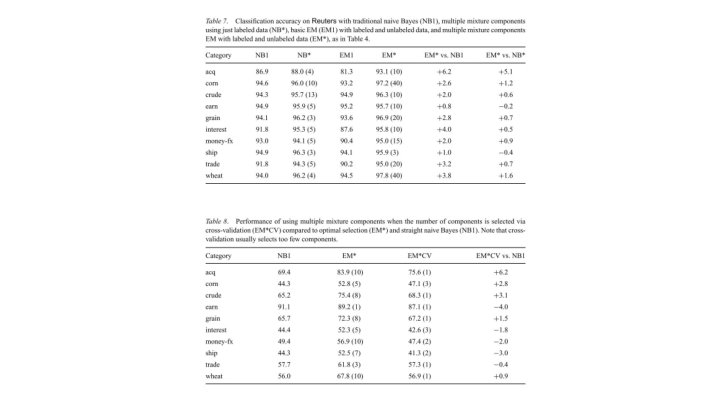
Findings ● Unlabeled data can be used effectively to reduce the error ● Having multiple mixture components for a category results in a more flexible model: ○ ○ Using too many or too few mixture components can worsen the results Weighting unlabeled data’s contribution to the model formation works

Closing Notes

Summary ● EM is a 2 -step iterative process ● Authors adjust basic EM to prevent unlabeled data from harming the performance: ○ ○ Weighting the unlabeled data Assuming multiple mixtures to one class correspondence ● Error rate decreases by 30% ● Critiques: ○ ○ Did not compare results against the case when all data is labeled. EM’s local minima convergence? Formal requirements to similarity between labeled and unlabeled data?
- Slides: 63