
Testing with English Learners and the CLIM Myths
- Slides: 45
Testing with English Learners and the C-LIM: Myths and misconceptions. School Psyched Podcast September 2, 2018 Samuel O. Ortiz, Ph. D. St. John’s University
Evidence-Based Assessment According to the APA Task Force on Evidence-based practice in psychology (EBPP), evidence-based practice is defined as: “the integration of the best available research with clinical expertise in the context of patient characteristics, culture, and preferences (p. 273) Evidence-based practice within the context of psychoeducational evaluation has never gone much beyond an over-reliance on the validity of standardized tests. But without inherently fair norm samples, the only recourse for individual practitioners is to apply research on the use of standardized tests with English learners. This becomes, in effect, evidence-based assessment. Source: American Psychological Association (2006). Evidence-Based Practice in Psychology, American Psychologist, pp. 271 -285.
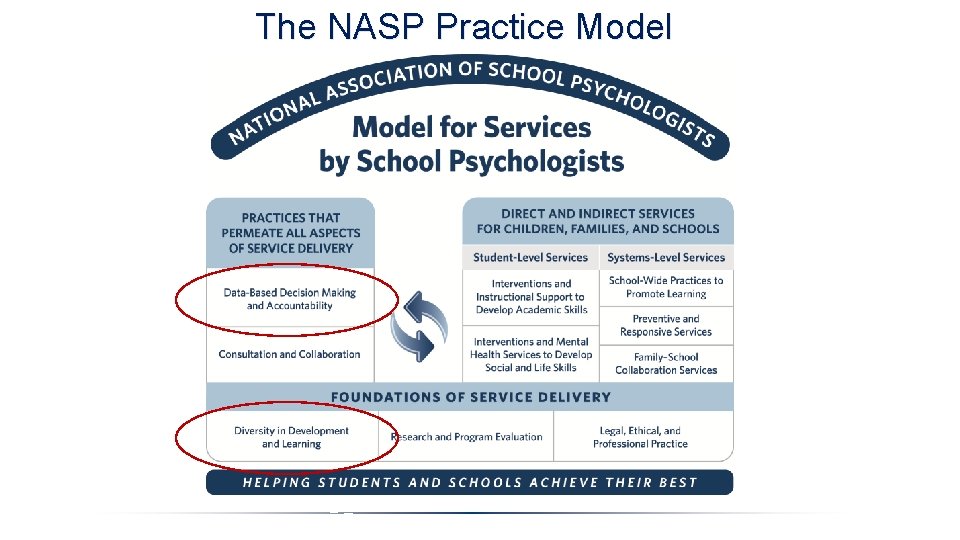
The NASP Practice Model
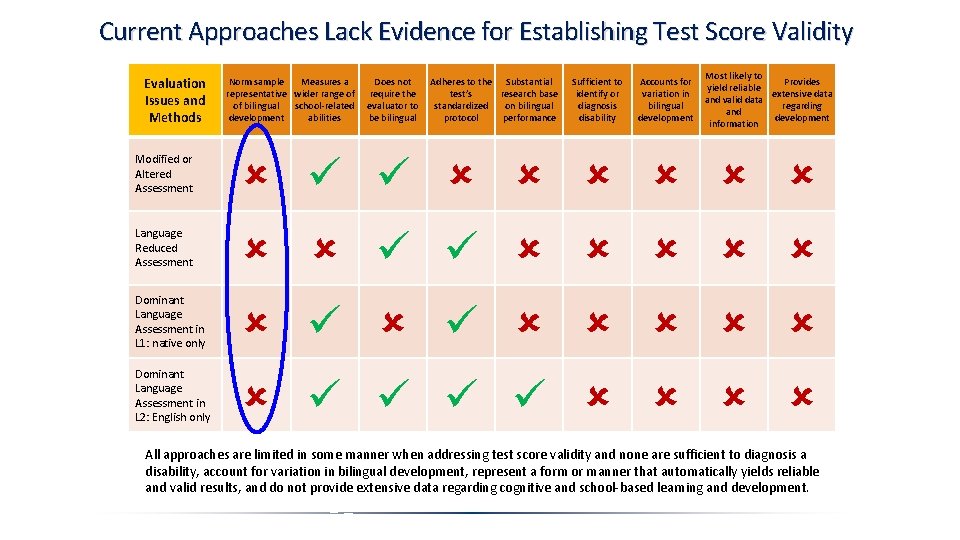
Current Approaches Lack Evidence for Establishing Test Score Validity Evaluation Issues and Methods Norm sample Measures a representative wider range of of bilingual school-related development abilities Does not require the evaluator to be bilingual Adheres to the Substantial test’s research base standardized on bilingual protocol performance Sufficient to identify or diagnosis disability Accounts for variation in bilingual development Most likely to Provides yield reliable extensive data and valid data regarding and development information Modified or Altered Assessment Language Reduced Assessment Dominant Language Assessment in L 1: native only Dominant Language Assessment in L 2: English only All approaches are limited in some manner when addressing test score validity and none are sufficient to diagnosis a disability, account for variation in bilingual development, represent a form or manner that automatically yields reliable and valid results, and do not provide extensive data regarding cognitive and school-based learning and development.
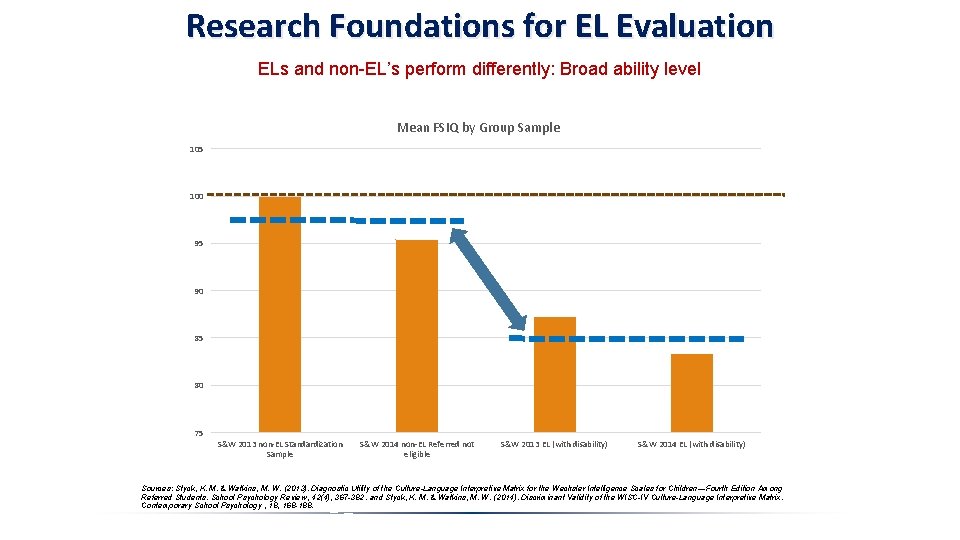
Research Foundations for EL Evaluation ELs and non-EL’s perform differently: Broad ability level Mean FSIQ by Group Sample 105 100 95 90 85 80 75 S&W 2013 non-EL Standardization Sample S&W 2014 non-EL Referred not eligible S&W 2013 EL (with disability) S&W 2014 EL (with disability) Sources: Styck, K. M. & Watkins, M. W. (2013). Diagnostic Utility of the Culture-Language Interpretive Matrix for the Wechsler Intelligence Scales for Children—Fourth Edition Among Referred Students. School Psychology Review, 42(4), 367 -382. and Styck, K. M. & Watkins, M. W. (2014). Discriminant Validity of the WISC-IV Culture-Language Interpretive Matrix. Contemporary School Psychology , 18, 168 -188.
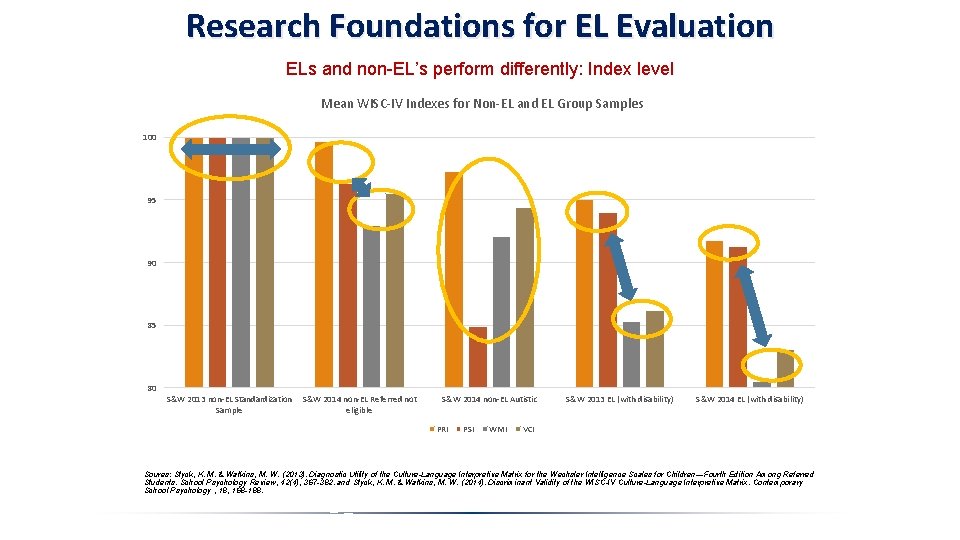
Research Foundations for EL Evaluation ELs and non-EL’s perform differently: Index level Mean WISC-IV Indexes for Non-EL and EL Group Samples 100 95 90 85 80 S&W 2013 non-EL Standardization S&W 2014 non-EL Referred not Sample eligible S&W 2014 non-EL Autistic PRI PSI WMI S&W 2013 EL (with disability) S&W 2014 EL (with disability) VCI Soures: Styck, K. M. & Watkins, M. W. (2013). Diagnostic Utility of the Culture-Language Interpretive Matrix for the Wechsler Intelligence Scales for Children—Fourth Edition Among Referred Students. School Psychology Review, 42(4), 367 -382. and Styck, K. M. & Watkins, M. W. (2014). Discriminant Validity of the WISC-IV Culture-Language Interpretive Matrix. Contemporary School Psychology , 18, 168 -188.
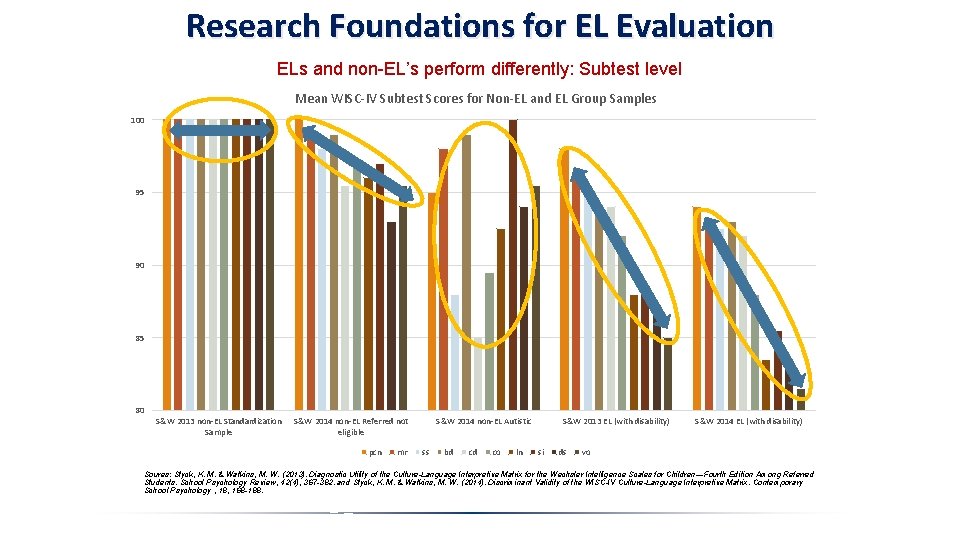
Research Foundations for EL Evaluation ELs and non-EL’s perform differently: Subtest level Mean WISC-IV Subtest Scores for Non-EL and EL Group Samples 100 95 90 85 80 S&W 2013 non-EL Standardization Sample S&W 2014 non-EL Referred not eligible pcn mr S&W 2014 non-EL Autistic ss bd cd co ln S&W 2013 EL (with disability) si ds S&W 2014 EL (with disability) vo Soures: Styck, K. M. & Watkins, M. W. (2013). Diagnostic Utility of the Culture-Language Interpretive Matrix for the Wechsler Intelligence Scales for Children—Fourth Edition Among Referred Students. School Psychology Review, 42(4), 367 -382. and Styck, K. M. & Watkins, M. W. (2014). Discriminant Validity of the WISC-IV Culture-Language Interpretive Matrix. Contemporary School Psychology , 18, 168 -188.
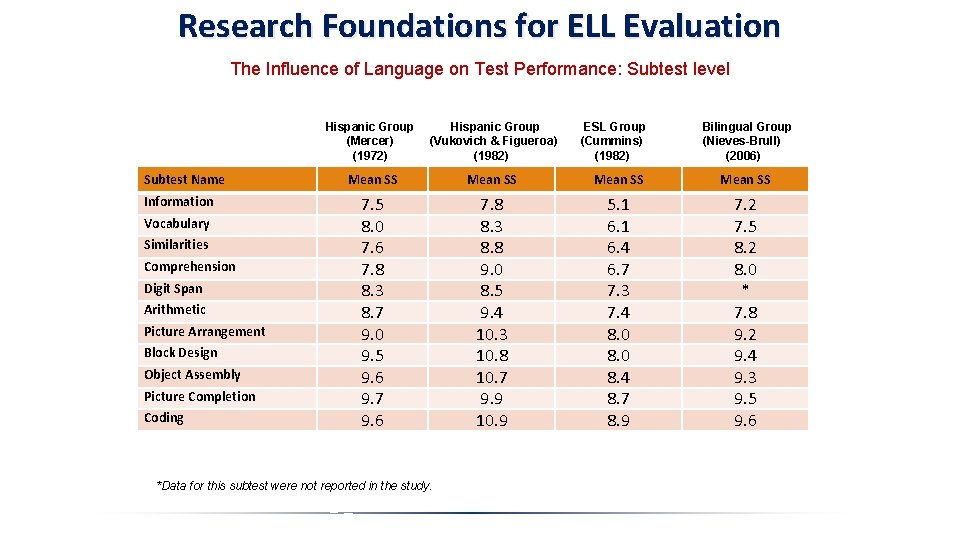
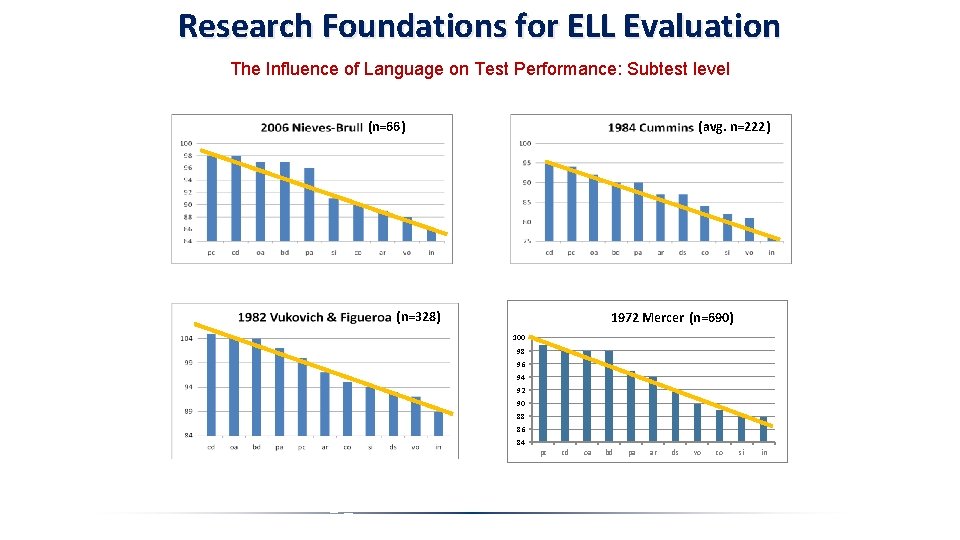
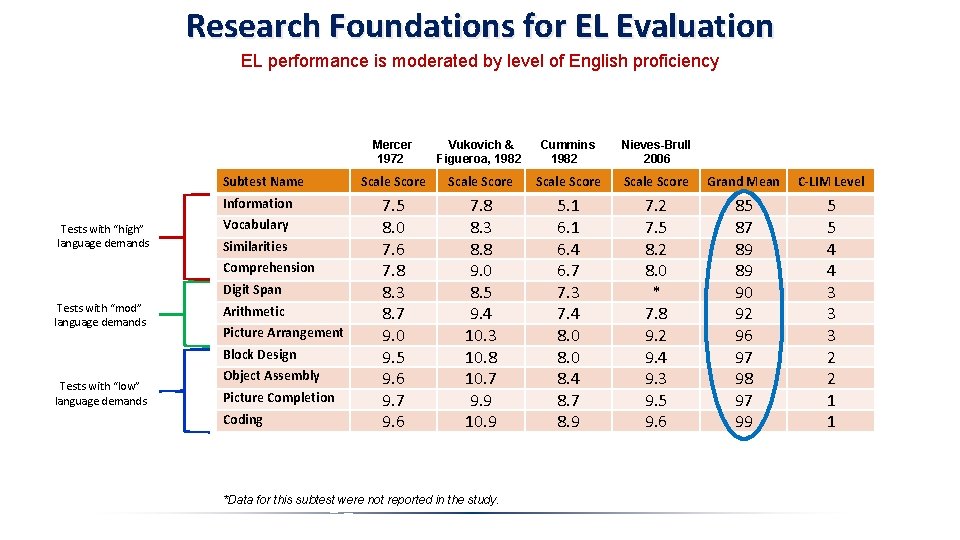
Research Foundations for ELL Evaluation The Influence of Language on Test Performance: Subtest level Name Subtest Information Vocabulary Similarities Comprehension Digit Span Arithmetic Picture Arrangement Block Design Object Assembly Picture Completion Coding Hispanic Group (Mercer) (1972) Hispanic Group (Vukovich & Figueroa) (1982) Mean SS 7. 5 8. 0 7. 6 7. 8 8. 3 8. 7 9. 0 9. 5 9. 6 9. 7 9. 6 7. 8 8. 3 8. 8 9. 0 8. 5 9. 4 10. 3 10. 8 10. 7 9. 9 10. 9 5. 1 6. 4 6. 7 7. 3 7. 4 8. 0 8. 4 8. 7 8. 9 7. 2 7. 5 8. 2 8. 0 * 7. 8 9. 2 9. 4 9. 3 9. 5 9. 6 *Data for this subtest were not reported in the study. ESL Group (Cummins) (1982) Bilingual Group (Nieves-Brull) (2006)
Research Foundations for ELL Evaluation The Influence of Language on Test Performance: Subtest level (n=66) (avg. n=222) (n=328) 1972 Mercer (n=690) 100 98 96 94 92 90 88 86 84 pc cd oa bd pa ar ds vo co si in
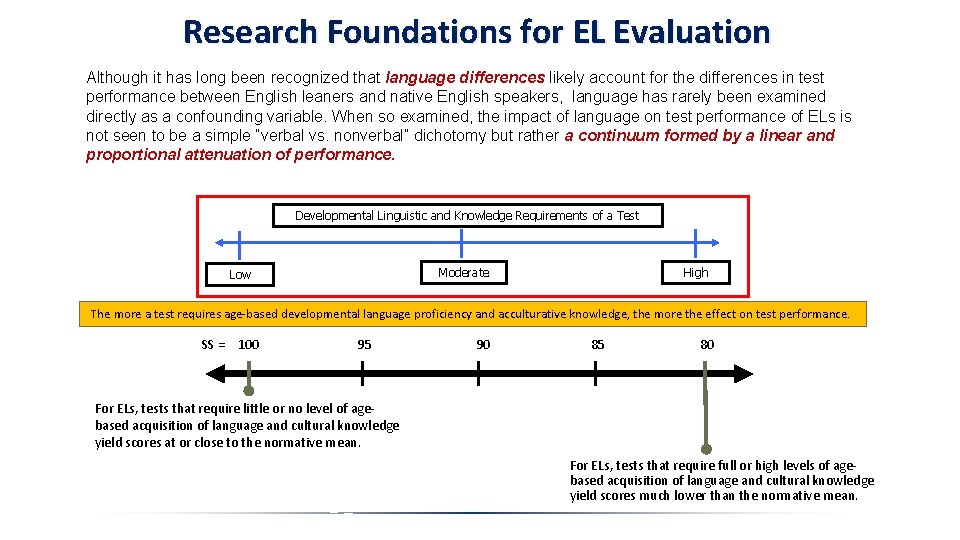
Research Foundations for EL Evaluation Although it has long been recognized that language differences likely account for the differences in test performance between English leaners and native English speakers, language has rarely been examined directly as a confounding variable. When so examined, the impact of language on test performance of ELs is not seen to be a simple “verbal vs. nonverbal” dichotomy but rather a continuum formed by a linear and proportional attenuation of performance. Developmental Linguistic and Knowledge Requirements of a Test Low Moderate High The more a test requires age-based developmental language proficiency and acculturative knowledge, the more the effect on test performance. SS = 100 95 90 85 80 For ELs, tests that require little or no level of agebased acquisition of language and cultural knowledge yield scores at or close to the normative mean. For ELs, tests that require full or high levels of agebased acquisition of language and cultural knowledge yield scores much lower than the normative mean.
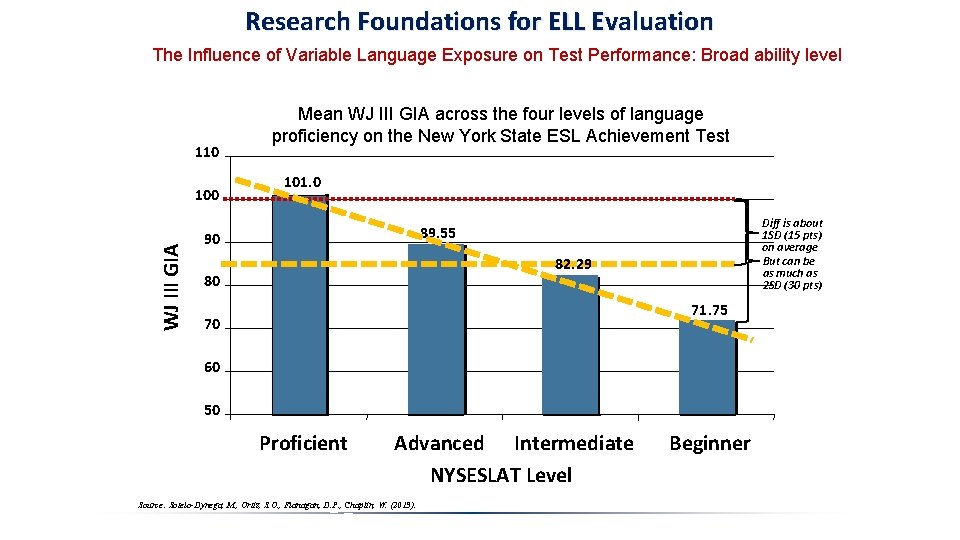
Research Foundations for EL Evaluation ELs vs. non-ELs and ELs vs. ELs Clearly, we have known for a long time that ELs do not perform comparably to native-English speakers at any level of cognitive ability testing and that the reason is due to differences in developmental language proficiency that arises out of differential exposure to English (i. e. , ELs do not learn English from birth). Thus, a 10 year old Hispanic student who began learning English when entering kindergarten has only had about ½ of the exposure to English as that of a monolingual, native-English speaking student and to compare their performance on tests that are moderately to heavily saturated with or dependent on language would be unfair and inappropriate. However, it is also inappropriate to view all ELs as being equal in terms of their English exposure. A 10 year old Hispanic study who started learning English upon school entry at age 5 is not comparable to another 10 year old Hispanic student who started learning English last year. The difference in exposure is 50% vs. only 10% and evaluation in English would be unfair and discriminatory and thus, biased against the student with only 10% exposure. As such, it is necessary to further examine EL performance from the perspective of how ELs compare against other ELs with higher, lower, and similar levels of English exposure and developmental language proficiency. Most studies simply ignore this issue and those studies that do examine EL performance in this manner sometimes do not examine the full range of proficiency necessary to illustrate this principle.
Research Foundations for ELL Evaluation The Influence of Variable Language Exposure on Test Performance: Broad ability level 110 WJ III GIA 100 Mean WJ III GIA across the four levels of language proficiency on the New York State ESL Achievement Test 101. 0 Diff is about 1 SD (15 pts) on average But can be as much as 2 SD (30 pts) 89. 55 90 82. 29 80 71. 75 70 60 50 Proficient Advanced Intermediate NYSESLAT Level Source: Sotelo-Dynega, M. , Ortiz, S. O. , Flanagan, D. P. , Chaplin, W. (2013). Beginner
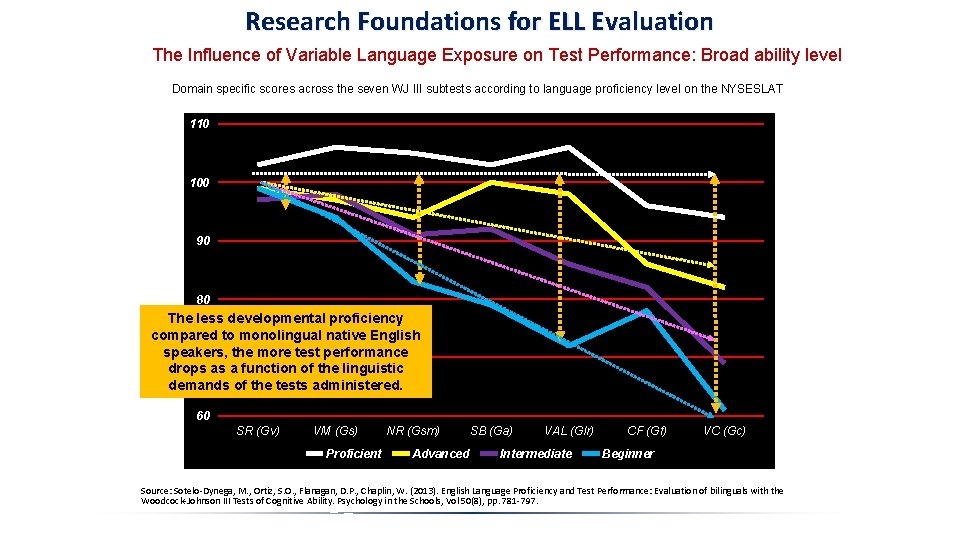
Research Foundations for ELL Evaluation The Influence of Variable Language Exposure on Test Performance: Broad ability level Domain specific scores across the seven WJ III subtests according to language proficiency level on the NYSESLAT 110 100 90 80 The less developmental proficiency compared to monolingual native English speakers, the more test performance 70 drops as a function of the linguistic demands of the tests administered. 60 SR (Gv) VM (Gs) Proficient NR (Gsm) Advanced SB (Ga) VAL (Glr) Intermediate CF (Gf) VC (Gc) Beginner Source: Sotelo-Dynega, M. , Ortiz, S. O. , Flanagan, D. P. , Chaplin, W. (2013). English Language Proficiency and Test Performance: Evaluation of bilinguals with the Woodcock-Johnson III Tests of Cognitive Ability. Psychology in the Schools, Vol 50(8), pp. 781 -797.
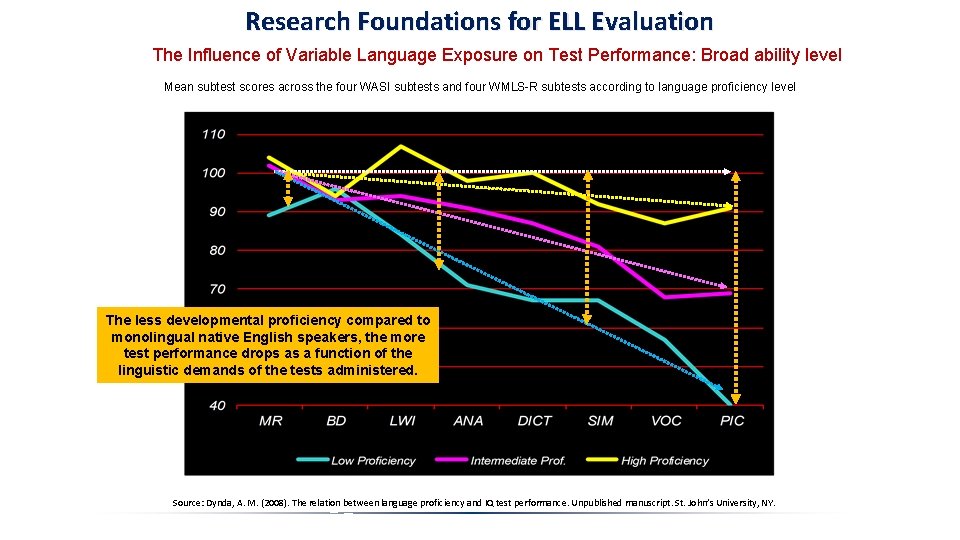
Research Foundations for ELL Evaluation The Influence of Variable Language Exposure on Test Performance: Broad ability level Mean subtest scores across the four WASI subtests and four WMLS-R subtests according to language proficiency level The less developmental proficiency compared to monolingual native English speakers, the more test performance drops as a function of the linguistic demands of the tests administered. Source: Dynda, A. M. (2008). The relation between language proficiency and IQ test performance. Unpublished manuscript. St. John’s University, NY.
Summary of the Foundational Research Principles with English Learners 1. Test performance of ELs is moderated by the degree to which a given index or subtest relies on or requires age- or grade-expected English language development and the acquisition of incidental acculturative knowledge. 2. Because ELs, as a group, vary widely in terms of their own developmental English language proficiency and acculturative knowledge acquisition, index or subtest performance is affected proportionally according to degree of exposure. Proper interpretation of EL test performance thus requires a true peer group that is based not on the language spoken by the individual but on comparison to other ELs with the same degree of English exposure and development. With one exception, current test norm samples lack control for developmental differences in English language exposure. This means that interpretation of test scores at any level must be made within the context of research which provides the only empirically-derived, albeit, very rough, true peer standard or “norm group”. Use of research on the relative test performance of ELs based on language exposure (as reflected by the degree of “difference” the student displays relative to the norm samples of the tests being used) is the very foundation and sole purpose of the C-LIM.
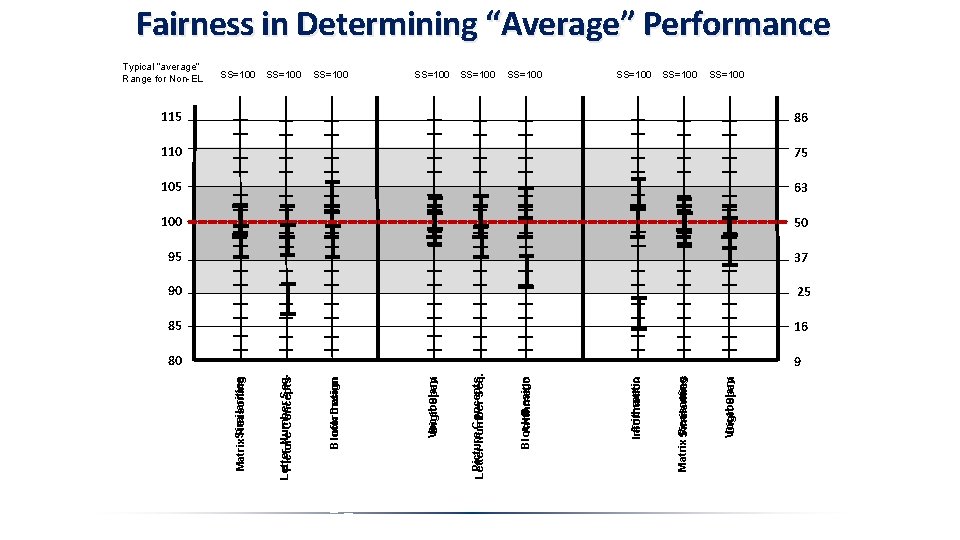
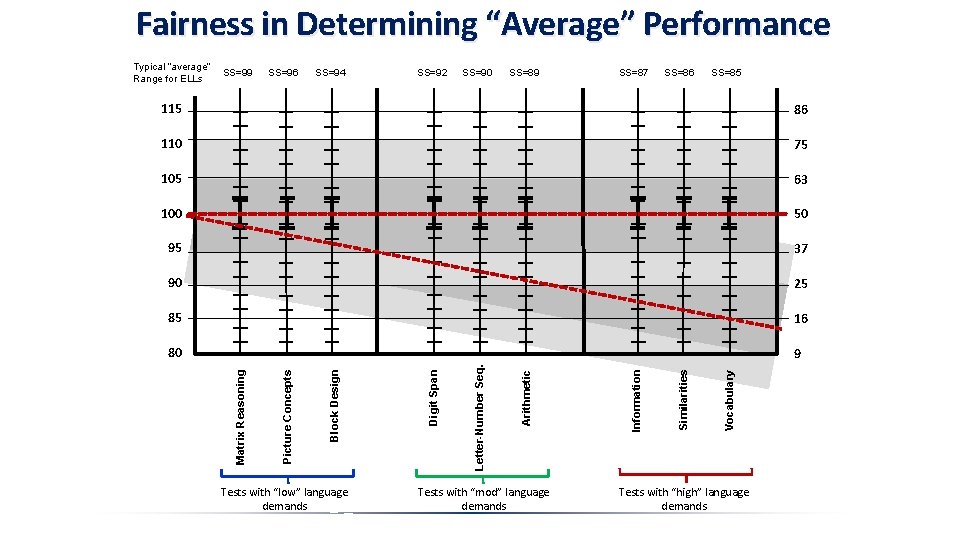
SS=100 Vocabulary Digit Span Matrix Similarities Reasoning SS=100 Arithmetic Information SS=100 Block Design Arithmetic Picture Concepts Letter-Number Seq. SS=100 Vocabulary Digit Span SS=100 Block Design Information Letter-Number Seq. Picture Concepts Typical “average” Range for Non-EL Matrix. Similarities Reasoning Fairness in Determining “Average” Performance SS=100 115 86 110 75 105 63 100 50 95 37 90 25 85 16 80 9
Research Foundations for EL Evaluation EL performance is moderated by level of English proficiency Subtest Name Information Tests with “high” language demands Vocabulary Similarities Comprehension Digit Span Tests with “mod” language demands Arithmetic Picture Arrangement Block Design Tests with “low” language demands Object Assembly Picture Completion Coding Mercer 1972 Vukovich & Figueroa, 1982 Cummins 1982 Nieves-Brull 2006 Scale Score Grand Mean C-LIM Level 7. 5 8. 0 7. 6 7. 8 8. 3 8. 7 9. 0 9. 5 9. 6 9. 7 9. 6 7. 8 8. 3 8. 8 9. 0 8. 5 9. 4 10. 3 10. 8 10. 7 9. 9 10. 9 5. 1 6. 4 6. 7 7. 3 7. 4 8. 0 8. 4 8. 7 8. 9 7. 2 7. 5 8. 2 8. 0 * 7. 8 9. 2 9. 4 9. 3 9. 5 9. 6 85 87 89 89 90 92 96 97 98 97 99 5 5 4 4 3 3 3 2 2 1 1 *Data for this subtest were not reported in the study.
Fairness in Determining “Average” Performance Typical “average” SS=99 Range for ELLs SS=96 SS=94 SS=92 SS=90 SS=89 SS=87 SS=86 SS=85 37 90 25 85 16 80 9 Tests with “low” language demands Tests with “mod” language demands Vocabulary 95 Similarities 50 Information 100 Arithmetic 63 Letter-Number Seq. 105 Digit Span 75 Block Design 110 Picture Concepts 86 Matrix Reasoning 115 Tests with “high” language demands
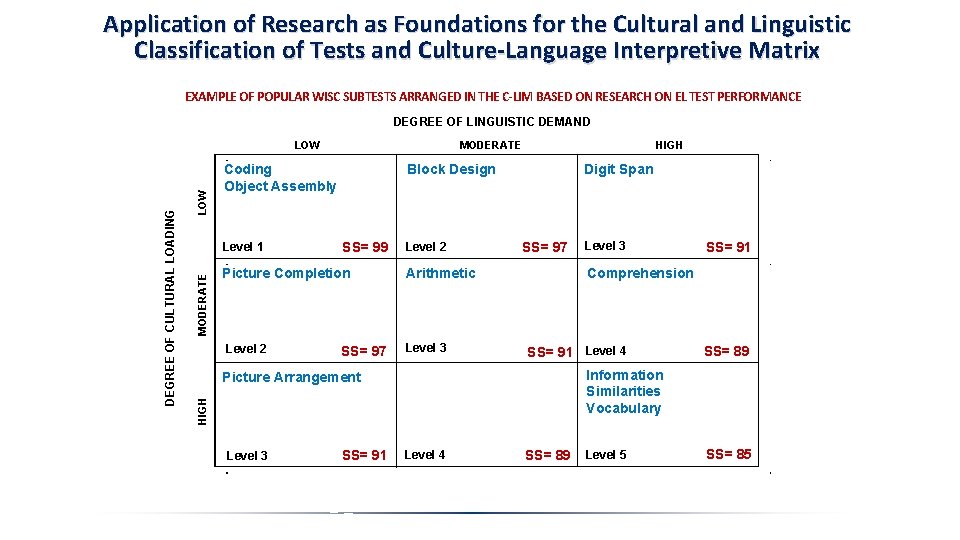
Application of Research as Foundations for the Cultural and Linguistic Classification of Tests and Culture-Language Interpretive Matrix EXAMPLE OF POPULAR WISC SUBTESTS ARRANGED IN THE C-LIM BASED ON RESEARCH ON EL TEST PERFORMANCE DEGREE OF LINGUISTIC DEMAND LOW Coding Object Assembly Level 1 MODERATE Block Design SS= 99 Picture Completion Level 2 HIGH SS= 97 Level 2 Digit Span SS= 97 Arithmetic Level 3 SS= 91 Level 4 SS= 91 SS= 89 Information Similarities Vocabulary Picture Arrangement Level 3 Comprehension HIGH DEGREE OF CULTURAL LOADING LOW Level 4 SS= 89 Level 5 SS= 85
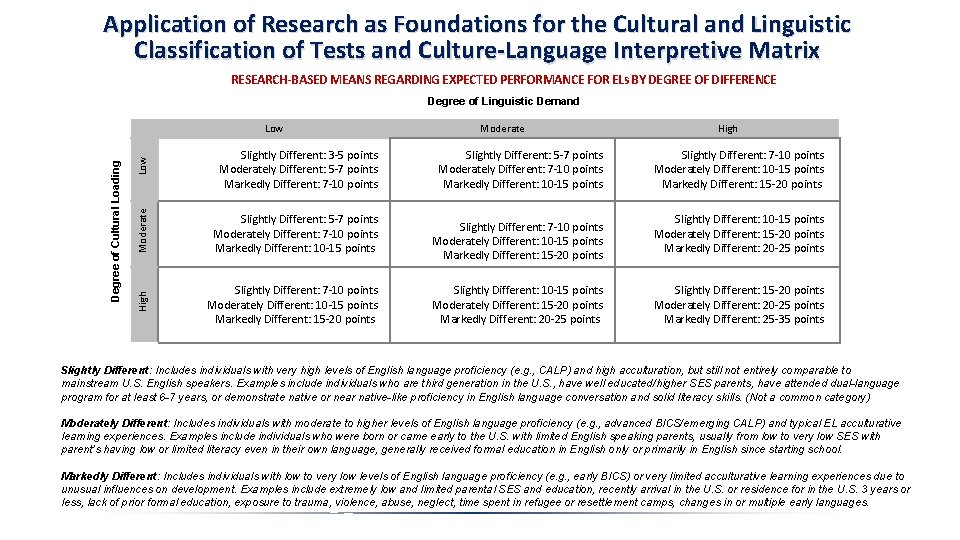
Application of Research as Foundations for the Cultural and Linguistic Classification of Tests and Culture-Language Interpretive Matrix RESEARCH-BASED MEANS REGARDING EXPECTED PERFORMANCE FOR ELs BY DEGREE OF DIFFERENCE Degree of Linguistic Demand High Low Moderate Slightly Different: 3 -5 points Moderately Different: 5 -7 points Markedly Different: 7 -10 points Slightly Different: 5 -7 points Moderately Different: 7 -10 points Markedly Different: 10 -15 points Slightly Different: 7 -10 points Moderately Different: 10 -15 points Markedly Different: 15 -20 points Moderate Low Slightly Different: 5 -7 points Moderately Different: 7 -10 points Markedly Different: 10 -15 points Slightly Different: 7 -10 points Moderately Different: 10 -15 points Markedly Different: 15 -20 points Slightly Different: 10 -15 points Moderately Different: 15 -20 points Markedly Different: 20 -25 points High Degree of Cultural Loading Slightly Different: 7 -10 points Moderately Different: 10 -15 points Markedly Different: 15 -20 points Slightly Different: 10 -15 points Moderately Different: 15 -20 points Markedly Different: 20 -25 points Slightly Different: 15 -20 points Moderately Different: 20 -25 points Markedly Different: 25 -35 points Slightly Different: Includes individuals with very high levels of English language proficiency (e. g. , CALP) and high acculturation, but still not entirely comparable to mainstream U. S. English speakers. Examples include individuals who are third generation in the U. S. , have well educated/higher SES parents, have attended dual-language program for at least 6 -7 years, or demonstrate native or near native-like proficiency in English language conversation and solid literacy skills. (Not a common category) Moderately Different: Includes individuals with moderate to higher levels of English language proficiency (e. g. , advanced BICS/emerging CALP) and typical EL acculturative learning experiences. Examples include individuals who were born or came early to the U. S. with limited English speaking parents, usually from low to very low SES with parent’s having low or limited literacy even in their own language, generally received formal education in English only or primarily in English since starting school. Markedly Different: Includes individuals with low to very low levels of English language proficiency (e. g. , early BICS) or very limited acculturative learning experiences due to unusual influences on development. Examples include extremely low and limited parental SES and education, recently arrival in the U. S. or residence for in the U. S. 3 years or less, lack of prior formal education, exposure to trauma, violence, abuse, neglect, time spent in refugee or resettlement camps, changes in or multiple early languages.
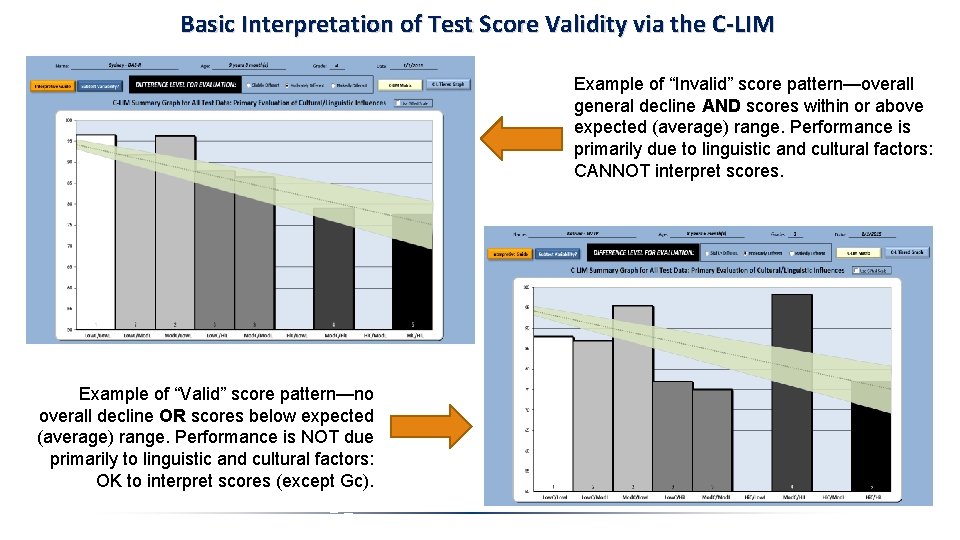
Basic Interpretation of Test Score Validity via the C-LIM Example of “Invalid” score pattern—overall general decline AND scores within or above expected (average) range. Performance is primarily due to linguistic and cultural factors: CANNOT interpret scores. Example of “Valid” score pattern—no overall decline OR scores below expected (average) range. Performance is NOT due primarily to linguistic and cultural factors: OK to interpret scores (except Gc).
A Critical Review of C-LIM Research: Kranzler et al. According to the demographic information regarding the participants used in the study, the sample: 1. was comprised of ELs with a mean age of 11 with an average grade placement of 6 th 2. of the included ELs, approximately 74% had been educated in their native language and country prior to coming to the U. S. 3. was extremely small (n=46) and there was no control regarding level of English language proficiency or native language proficiency Thus, the age, grade, and background of 3/4 th of the ELs in the sample suggests that the vast majority of participants had very likely already undergone full academic skill development in their native language (i. e. , had developed CALP) prior to receiving an education in the U. S. Despite being very different than the background and development of typical ELs in the U. S. , the results remained quite consistent with the research underlying the C-LIM, especially that indicated by the “slightly different range.
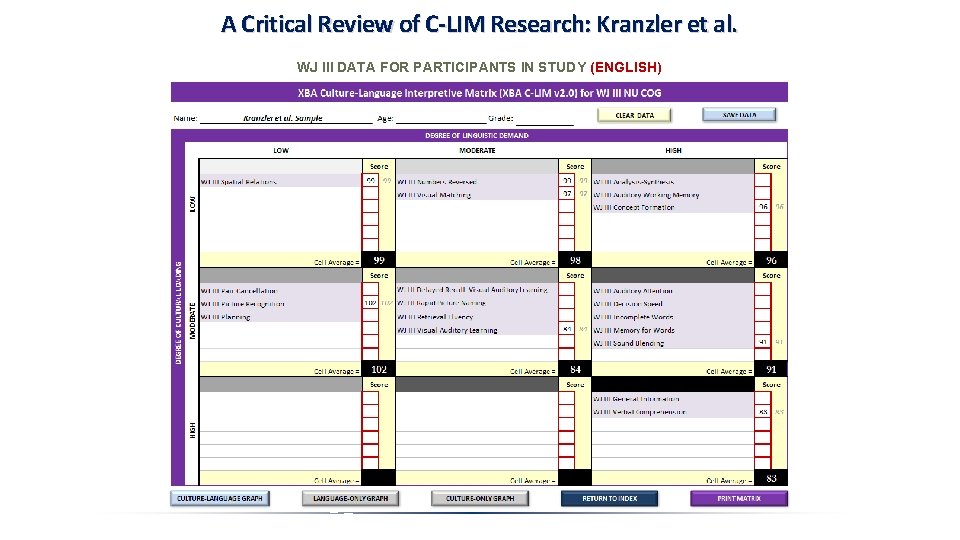
A Critical Review of C-LIM Research: Kranzler et al. WJ III DATA FOR PARTICIPANTS IN STUDY (ENGLISH)
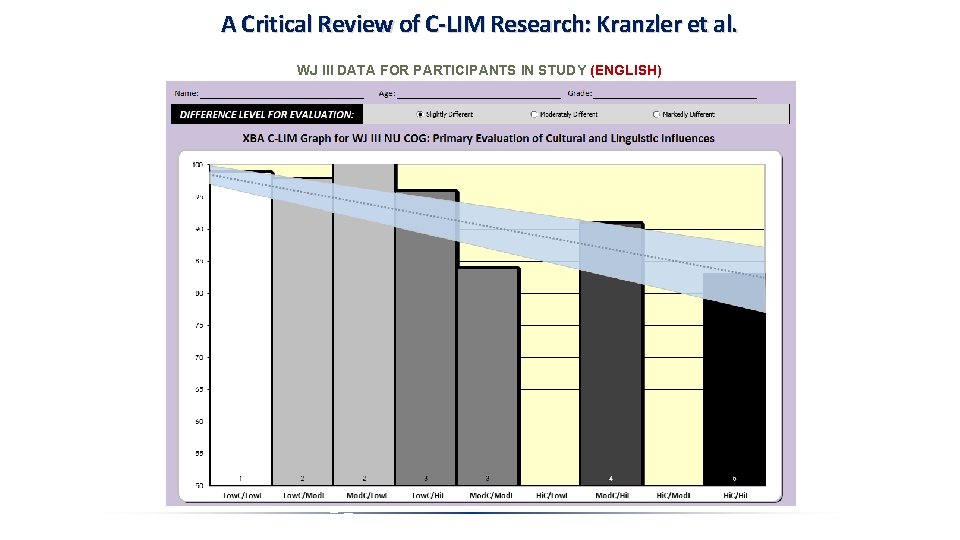
A Critical Review of C-LIM Research: Kranzler et al. WJ III DATA FOR PARTICIPANTS IN STUDY (ENGLISH)
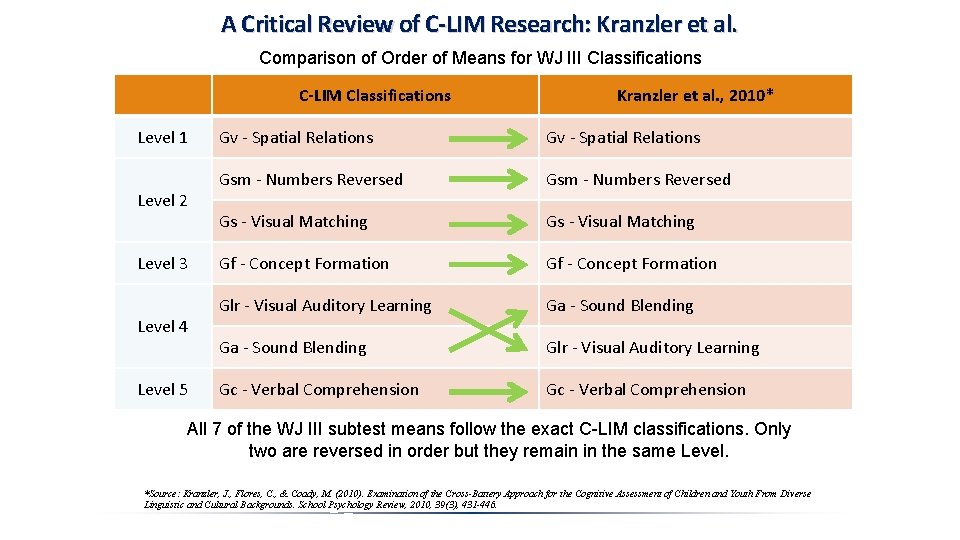
A Critical Review of C-LIM Research: Kranzler et al. Comparison of Order of Means for WJ III Classifications C-LIM Classifications Level 1 Level 2 Level 3 Level 4 Level 5 Kranzler et al. , 2010* Gv - Spatial Relations Gsm - Numbers Reversed Gs - Visual Matching Gf - Concept Formation Glr - Visual Auditory Learning Ga - Sound Blending Glr - Visual Auditory Learning Gc - Verbal Comprehension All 7 of the WJ III subtest means follow the exact C-LIM classifications. Only two are reversed in order but they remain in the same Level. *Source: Kranzler, J. , Flores, C. , & Coady, M. (2010). Examination of the Cross-Battery Approach for the Cognitive Assessment of Children and Youth From Diverse Linguistic and Cultural Backgrounds. School Psychology Review, 2010, 39(3), 431 -446.
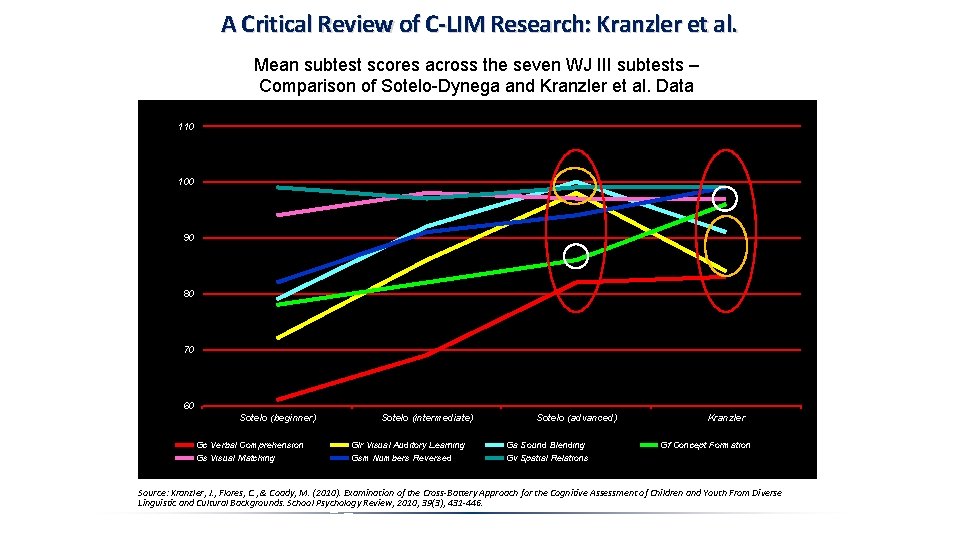
A Critical Review of C-LIM Research: Kranzler et al. Mean subtest scores across the seven WJ III subtests – Comparison of Sotelo-Dynega and Kranzler et al. Data 110 100 90 80 70 60 Sotelo (beginner) Gc Verbal Comprehension Gs Visual Matching Sotelo (intermediate) Glr Visual Auditory Learning Gsm Numbers Reversed Sotelo (advanced) Ga Sound Blending Gv Spatial Relations Kranzler Gf Concept Formation Source: Kranzler, J. , Flores, C. , & Coady, M. (2010). Examination of the Cross-Battery Approach for the Cognitive Assessment of Children and Youth From Diverse Linguistic and Cultural Backgrounds. School Psychology Review, 2010, 39(3), 431 -446.
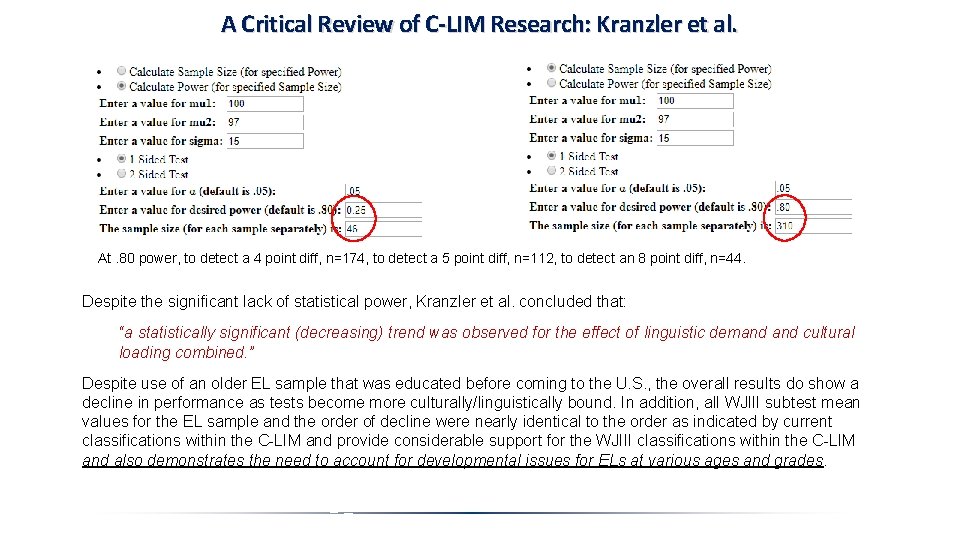
A Critical Review of C-LIM Research: Kranzler et al. At. 80 power, to detect a 4 point diff, n=174, to detect a 5 point diff, n=112, to detect an 8 point diff, n=44. Despite the significant lack of statistical power, Kranzler et al. concluded that: “a statistically significant (decreasing) trend was observed for the effect of linguistic demand cultural loading combined. ” Despite use of an older EL sample that was educated before coming to the U. S. , the overall results do show a decline in performance as tests become more culturally/linguistically bound. In addition, all WJIII subtest mean values for the EL sample and the order of decline were nearly identical to the order as indicated by current classifications within the C-LIM and provide considerable support for the WJIII classifications within the C-LIM and also demonstrates the need to account for developmental issues for ELs at various ages and grades.
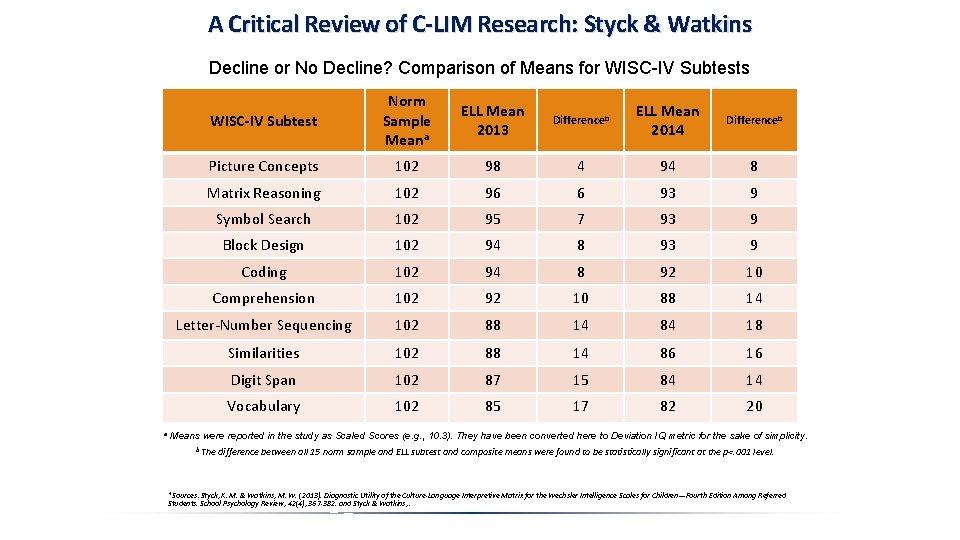
A Critical Review of C-LIM Research: Styck & Watkins The main finding in the study is stated as follows: “The valid C-LIM profile (i. e. , cell means did not decline) emerged in the mean WISC-IV normative sample and the ELL sample. ” (p. 374). (emphasis added) It is clear that the normative sample “did not decline” as their mean on every subtest was invariant, 10. 3 (SS=102). However, for the ELL sample, the highest mean was on Picture Concepts (SS=98) and lowest was on Vocabulary (SS=85). With minor variation, examination of the data in the following table strongly suggests a clear decline in the EL sample’s means. *Source: Styck, K. M. & Watkins, M. W. (2013). Diagnostic Utility of the Culture-Language Interpretive Matrix for the Wechsler Intelligence Scales for Children—Fourth Edition Among Referred Students. School Psychology Review, 42(4), 367 -382.
A Critical Review of C-LIM Research: Styck & Watkins Decline or No Decline? Comparison of Means for WISC-IV Subtests a WISC-IV Subtest Norm Sample Meana ELL Mean 2013 Differenceb ELL Mean 2014 Differenceb Picture Concepts 102 98 4 94 8 Matrix Reasoning 102 96 6 93 9 Symbol Search 102 95 7 93 9 Block Design 102 94 8 93 9 Coding 102 94 8 92 10 Comprehension 102 92 10 88 14 Letter-Number Sequencing 102 88 14 84 18 Similarities 102 88 14 86 16 Digit Span 102 87 15 84 14 Vocabulary 102 85 17 82 20 Means were reported in the study as Scaled Scores (e. g. , 10. 3). They have been converted here to Deviation IQ metric for the sake of simplicity. b The difference between all 15 norm sample and ELL subtest and composite means were found to be statistically significant at the p<. 001 level. *Sources: Styck, K. M. & Watkins, M. W. (2013). Diagnostic Utility of the Culture-Language Interpretive Matrix for the Wechsler Intelligence Scales for Children—Fourth Edition Among Referred Students. School Psychology Review, 42(4), 367 -382. and Styck & Watkins, .
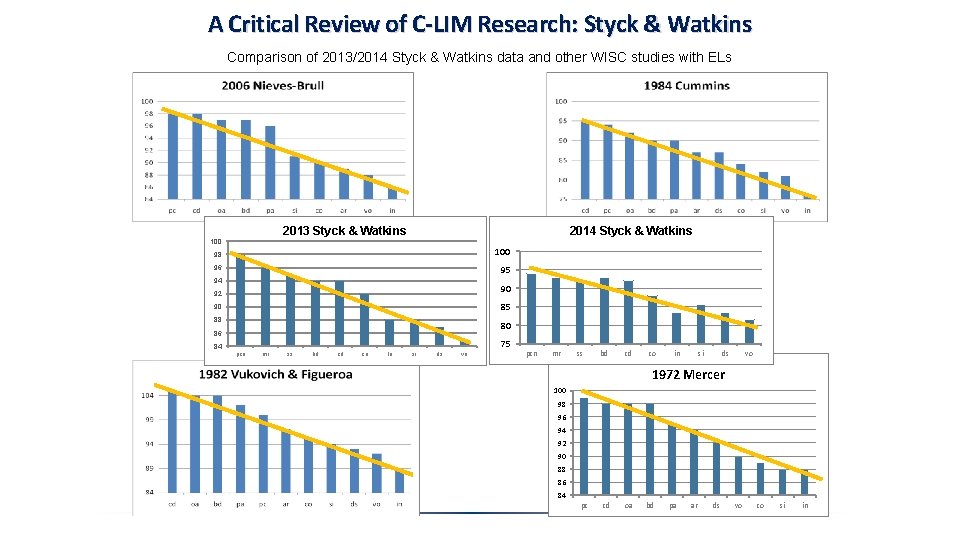
A Critical Review of C-LIM Research: Styck & Watkins Comparison of 2013/2014 Styck & Watkins data and other WISC studies with ELs 2013 Styck & Watkins 2014 Styck & Watkins 100 98 100 96 95 94 92 90 90 85 88 80 86 75 84 pcn mr ss bd cd co ln si ds vo pcn mr ss bd cd co in si ds vo 1972 Mercer 100 98 96 94 92 90 88 86 84 pc cd oa bd pa ar ds vo co si in
A Critical Review of C-LIM Research: Styck & Watkins Main conclusion in the 2013 study is stated as follows: “Thus, neither sample of children exhibited the invalid C-LIM profile when group mean scores were considered” (p. 374) (emphasis added). The “invalid C-LIM profile” would be indicated by a systematic decline in mean scores in the matrix meaning that the test results were influenced primarily by the presence of cultural and linguistic variables. Although the C-LIM is not for use with monolingual, native English speakers, an “invalid” pattern should result anyway because language is effectively controlled in this sample by age and thus not finding a decline is wholly unremarkable and not the least bit unusual or surprising. However, in an EL sample, the “invalid” pattern should not result and the scores should decline, UNLESS, as in this case, the sample is comprised of individuals, 97% of whom have disabilities. In such cases, there should be no invalid pattern precisely as was observed. Yet, the pattern, given that SLD does not have a single identifying ability deficit profile, remained largely consistent with the C-LIM classifications. *Source: Styck, K. M. & Watkins, M. W. (2013). Diagnostic Utility of the Culture-Language Interpretive Matrix for the Wechsler Intelligence Scales for Children—Fourth Edition Among Referred Students. School Psychology Review, 42(4), 367 -382.
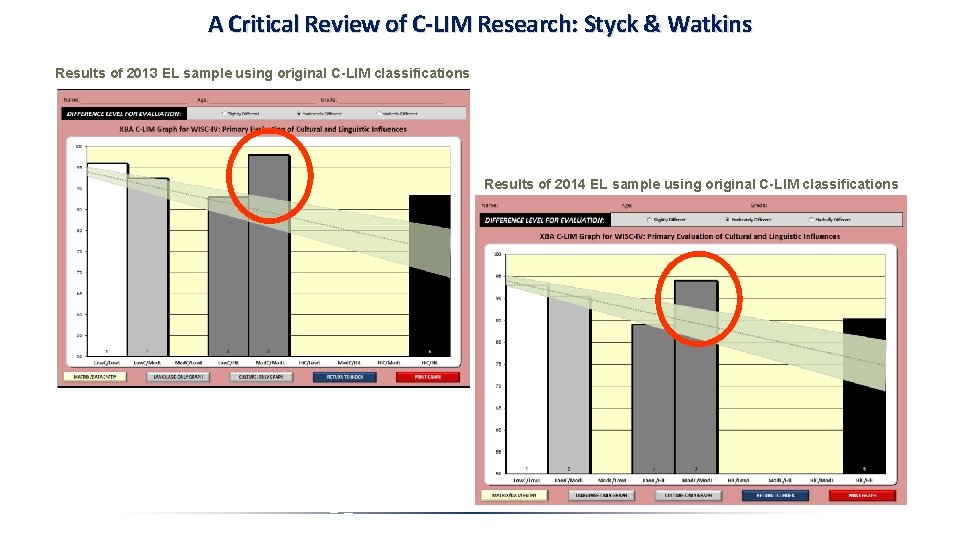
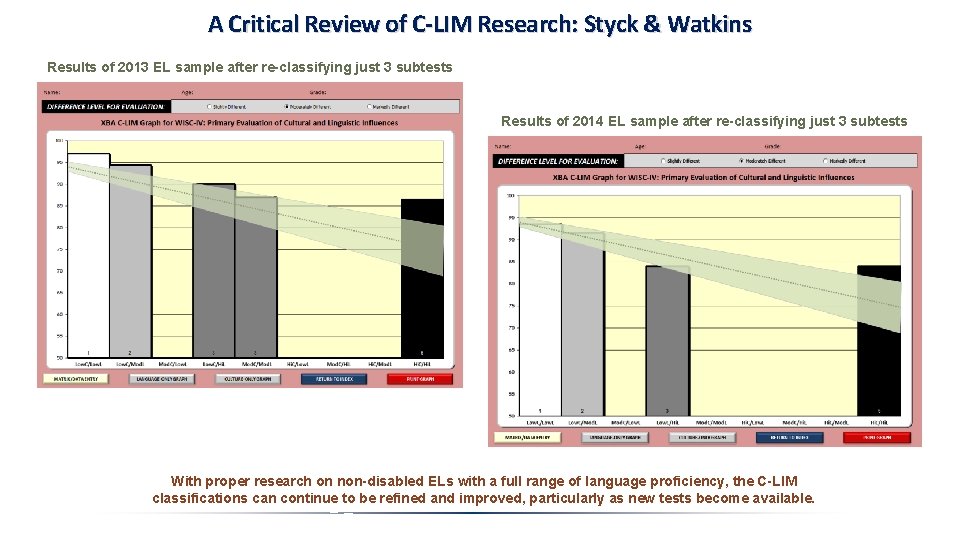
A Critical Review of C-LIM Research: Styck & Watkins Results of 2013 EL sample using original C-LIM classifications Results of 2014 EL sample using original C-LIM classifications
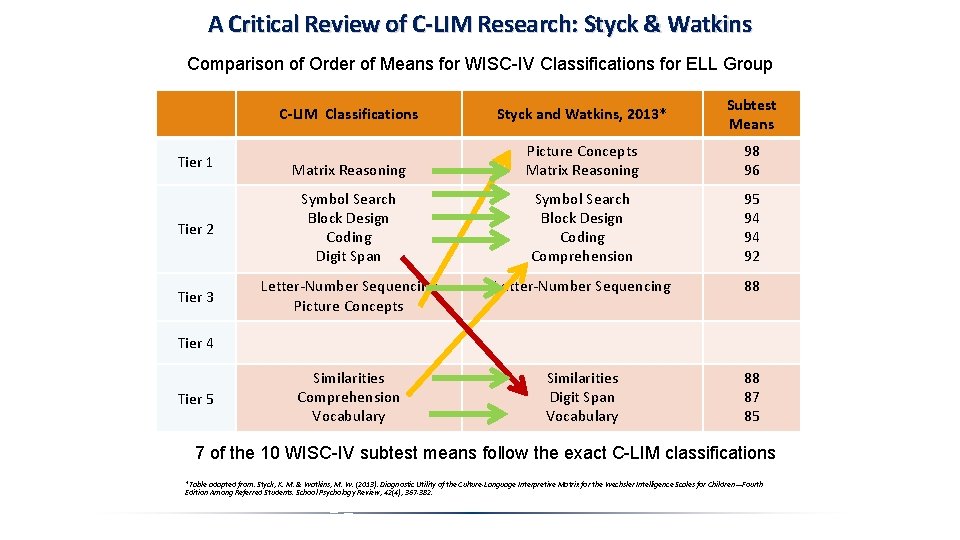
A Critical Review of C-LIM Research: Styck & Watkins Comparison of Order of Means for WISC-IV Classifications for ELL Group C-LIM Classifications Styck and Watkins, 2013* Subtest Means Matrix Reasoning Picture Concepts Matrix Reasoning 98 96 Tier 2 Symbol Search Block Design Coding Digit Span Symbol Search Block Design Coding Comprehension 95 94 94 92 Tier 3 Letter-Number Sequencing Picture Concepts Letter-Number Sequencing 88 Similarities Comprehension Vocabulary Similarities Digit Span Vocabulary 88 87 85 Tier 1 Tier 4 Tier 5 7 of the 10 WISC-IV subtest means follow the exact C-LIM classifications *Table adapted from: Styck, K. M. & Watkins, M. W. (2013). Diagnostic Utility of the Culture-Language Interpretive Matrix for the Wechsler Intelligence Scales for Children—Fourth Edition Among Referred Students. School Psychology Review, 42(4), 367 -382.
A Critical Review of C-LIM Research: Styck & Watkins Results of 2013 EL sample after re-classifying just 3 subtests Results of 2014 EL sample after re-classifying just 3 subtests With proper research on non-disabled ELs with a full range of language proficiency, the C-LIM classifications can continue to be refined and improved, particularly as new tests become available.
A Critical Review of C-LIM Research: Styck & Watkins Of most importance perhaps, the 2013 study noted that: “roughly 97% of (n = 83) of participants were identified as meeting criteria for an educational disability (86% as SLD)” (p. 371). As noted previously, this suggests that individual C-LIM profiles for the EL sample should display valid results (i. e. , non-declining), not invalid (i. e. , declining), since valid results are needed to support the district’s identification of a disability. Thus, when individual C-LIM’s for the EL sample were examined, they found that nearly 89. 5% of the ELs did in fact display valid (i. e. , non-declining) results contrary to their incorrect expectation that the score patterns should be invalid (i. e. , declining). This indicates that because low scores were likely valid, they may very well have reflected a disability and demonstrates a very high degree of consistency with the clinical decisions made by the district’s eligibility team, up to 93% overall. In short, Styck & Watkins interpreted the expected pattern for ELs backwards and thus failed to note the impressive support for the C-LIM in their own data. *Source: Styck, K. M. & Watkins, M. W. (2013). Diagnostic Utility of the Culture-Language Interpretive Matrix for the Wechsler Intelligence Scales for Children—Fourth Edition Among Referred Students. School Psychology Review, 42(4), 367 -382.
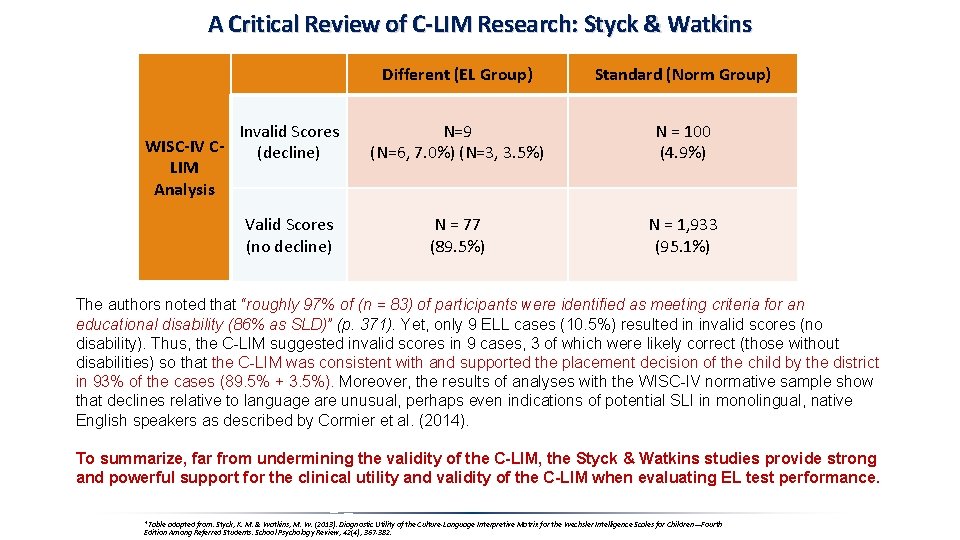
A Critical Review of C-LIM Research: Styck & Watkins WISC-IV CLIM Analysis Different (EL Group) Standard (Norm Group) Invalid Scores (decline) N=9 (N=6, 7. 0%) (N=3, 3. 5%) N = 100 (4. 9%) Valid Scores (no decline) N = 77 (89. 5%) N = 1, 933 (95. 1%) The authors noted that “roughly 97% of (n = 83) of participants were identified as meeting criteria for an educational disability (86% as SLD)” (p. 371). Yet, only 9 ELL cases (10. 5%) resulted in invalid scores (no disability). Thus, the C-LIM suggested invalid scores in 9 cases, 3 of which were likely correct (those without disabilities) so that the C-LIM was consistent with and supported the placement decision of the child by the district in 93% of the cases (89. 5% + 3. 5%). Moreover, the results of analyses with the WISC-IV normative sample show that declines relative to language are unusual, perhaps even indications of potential SLI in monolingual, native English speakers as described by Cormier et al. (2014). To summarize, far from undermining the validity of the C-LIM, the Styck & Watkins studies provide strong and powerful support for the clinical utility and validity of the C-LIM when evaluating EL test performance. *Table adapted from: Styck, K. M. & Watkins, M. W. (2013). Diagnostic Utility of the Culture-Language Interpretive Matrix for the Wechsler Intelligence Scales for Children—Fourth Edition Among Referred Students. School Psychology Review, 42(4), 367 -382.
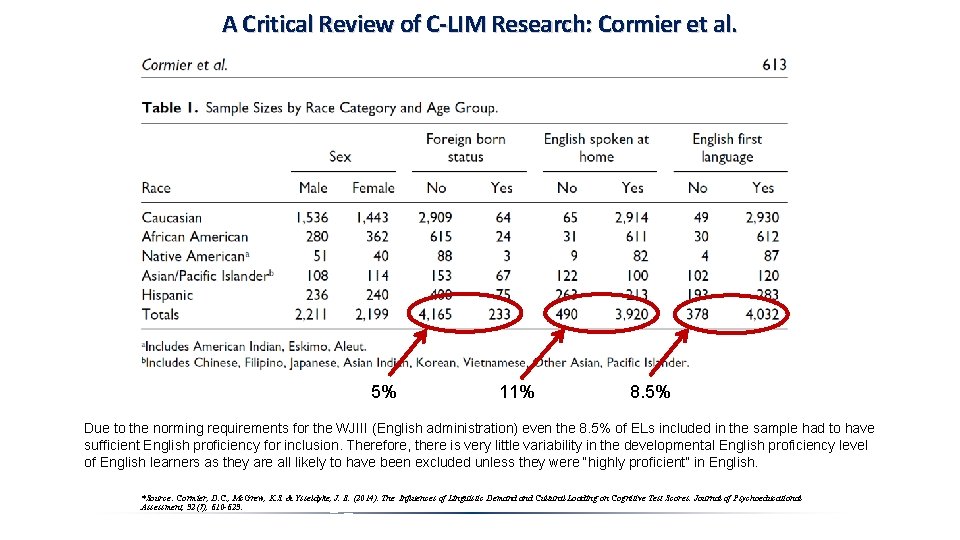
A Critical Review of C-LIM Research: Cormier et al. 5% 11% 8. 5% Due to the norming requirements for the WJIII (English administration) even the 8. 5% of ELs included in the sample had to have sufficient English proficiency for inclusion. Therefore, there is very little variability in the developmental English proficiency level of English learners as they are all likely to have been excluded unless they were “highly proficient” in English. *Source: Cormier, D. C. , Mc. Grew, K. S. & Ysseldyke, J. E. (2014). The Influences of Linguistic Demand Cultural Loading on Cognitive Test Scores. Journal of Psychoeducational Assessment, 32(7), 610 -623.
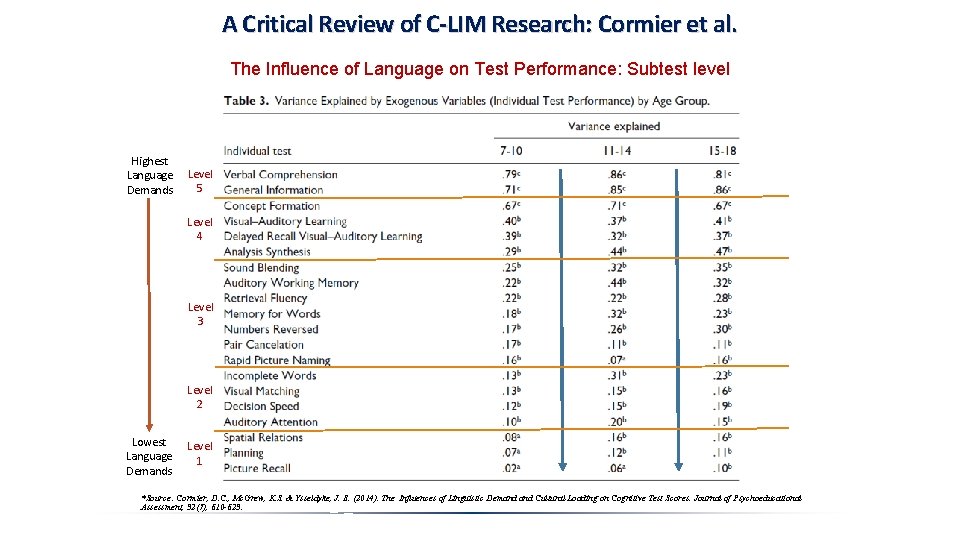
A Critical Review of C-LIM Research: Cormier et al. The Influence of Language on Test Performance: Subtest level Highest Language Demands Level 5 Level 4 Level 3 Level 2 Lowest Language Demands Level 1 *Source: Cormier, D. C. , Mc. Grew, K. S. & Ysseldyke, J. E. (2014). The Influences of Linguistic Demand Cultural Loading on Cognitive Test Scores. Journal of Psychoeducational Assessment, 32(7), 610 -623.
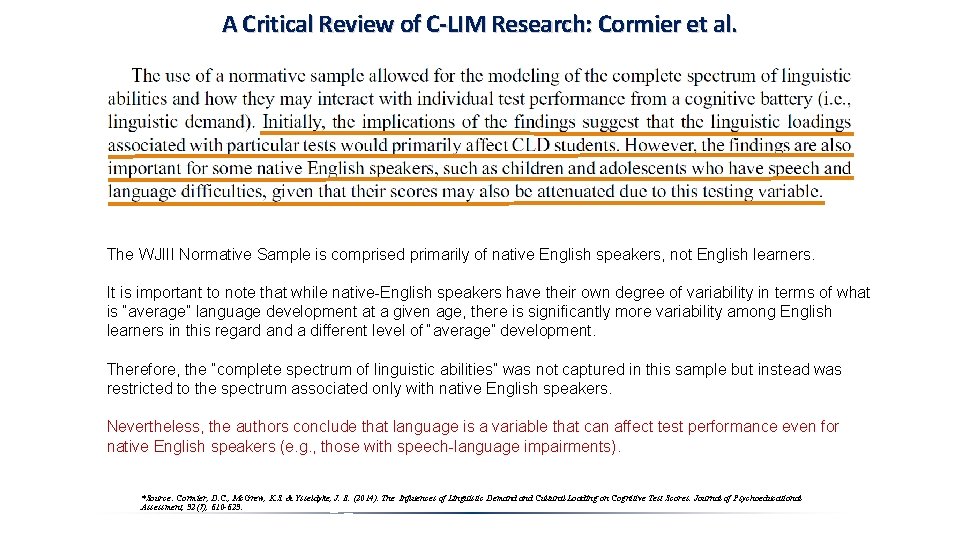
A Critical Review of C-LIM Research: Cormier et al. The WJIII Normative Sample is comprised primarily of native English speakers, not English learners. It is important to note that while native-English speakers have their own degree of variability in terms of what is “average” language development at a given age, there is significantly more variability among English learners in this regard and a different level of “average” development. Therefore, the “complete spectrum of linguistic abilities” was not captured in this sample but instead was restricted to the spectrum associated only with native English speakers. Nevertheless, the authors conclude that language is a variable that can affect test performance even for native English speakers (e. g. , those with speech-language impairments). *Source: Cormier, D. C. , Mc. Grew, K. S. & Ysseldyke, J. E. (2014). The Influences of Linguistic Demand Cultural Loading on Cognitive Test Scores. Journal of Psychoeducational Assessment, 32(7), 610 -623.
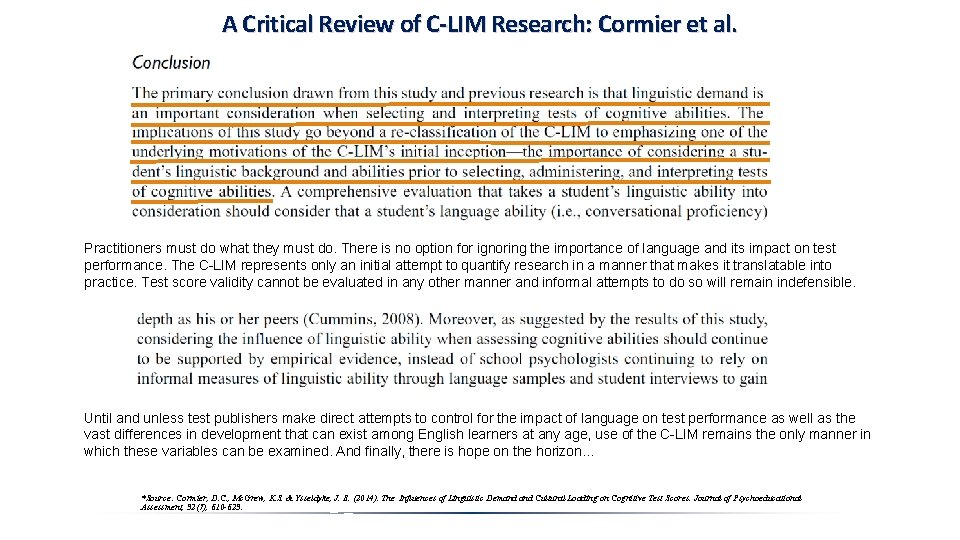
A Critical Review of C-LIM Research: Cormier et al. Practitioners must do what they must do. There is no option for ignoring the importance of language and its impact on test performance. The C-LIM represents only an initial attempt to quantify research in a manner that makes it translatable into practice. Test score validity cannot be evaluated in any other manner and informal attempts to do so will remain indefensible. Until and unless test publishers make direct attempts to control for the impact of language on test performance as well as the vast differences in development that can exist among English learners at any age, use of the C-LIM remains the only manner in which these variables can be examined. And finally, there is hope on the horizon… *Source: Cormier, D. C. , Mc. Grew, K. S. & Ysseldyke, J. E. (2014). The Influences of Linguistic Demand Cultural Loading on Cognitive Test Scores. Journal of Psychoeducational Assessment, 32(7), 610 -623.
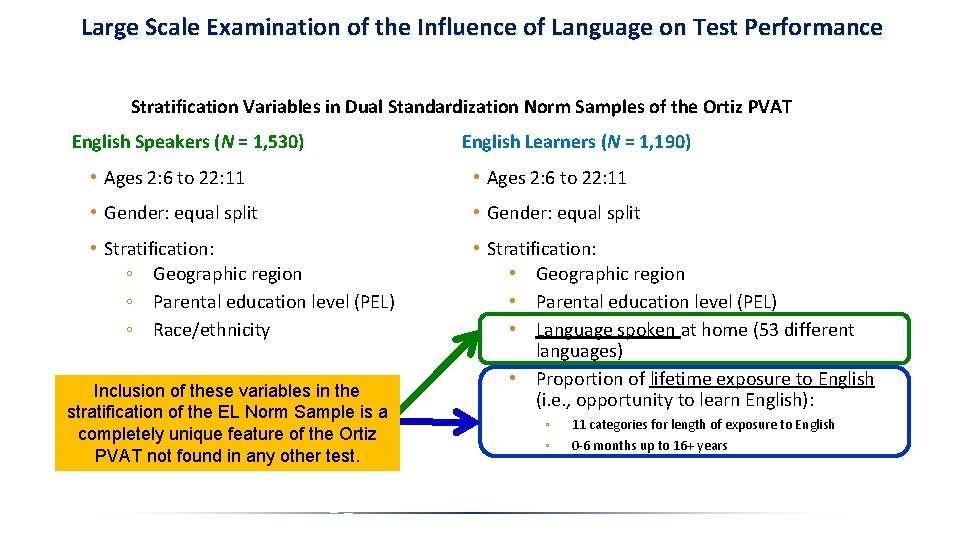
Large Scale Examination of the Influence of Language on Test Performance Stratification Variables in Dual Standardization Norm Samples of the Ortiz PVAT English Speakers (N = 1, 530) English Learners (N = 1, 190) • Ages 2: 6 to 22: 11 • Gender: equal split • Stratification: ◦ Geographic region ◦ Parental education level (PEL) ◦ Race/ethnicity • Stratification: • Geographic region • Parental education level (PEL) • Language spoken at home (53 different languages) • Proportion of lifetime exposure to English (i. e. , opportunity to learn English): Inclusion of these variables in the stratification of the EL Norm Sample is a completely unique feature of the Ortiz PVAT not found in any other test. ◦ ◦ 11 categories for length of exposure to English 0 -6 months up to 16+ years
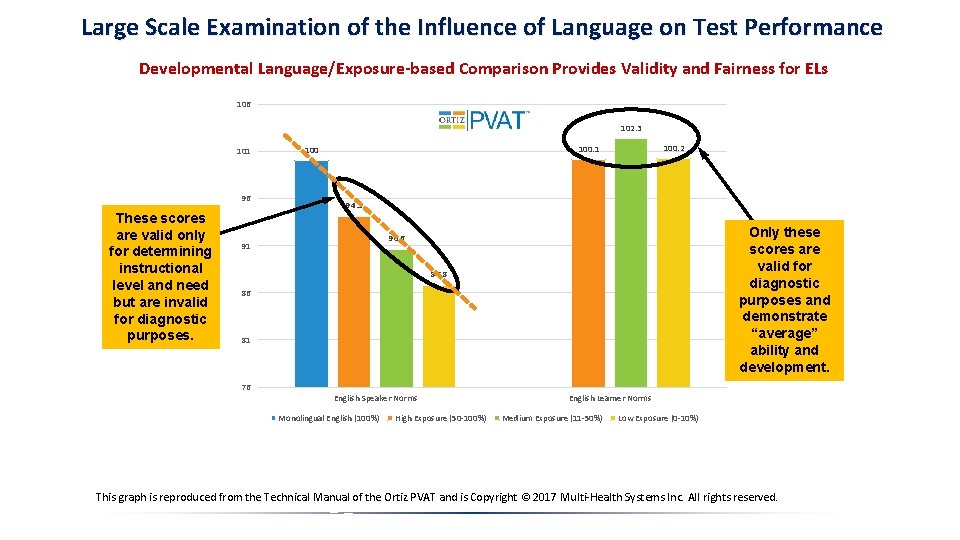
Large Scale Examination of the Influence of Language on Test Performance Developmental Language/Exposure-based Comparison Provides Validity and Fairness for ELs 106 102. 3 101 96 These scores are valid only for determining instructional level and need but are invalid for diagnostic purposes. 100. 2 100. 1 100 94. 1 Only these scores are valid for diagnostic purposes and demonstrate “average” ability and development. 90. 6 91 86. 8 86 81 76 English Speaker Norms Monolingual English (100%) High Exposure (50 -100%) English Learner Norms Medium Exposure (11 -50%) Low Exposure (0 -10%) This graph is reproduced from the Technical Manual of the Ortiz PVAT and is Copyright © 2017 Multi-Health Systems Inc. All rights reserved.
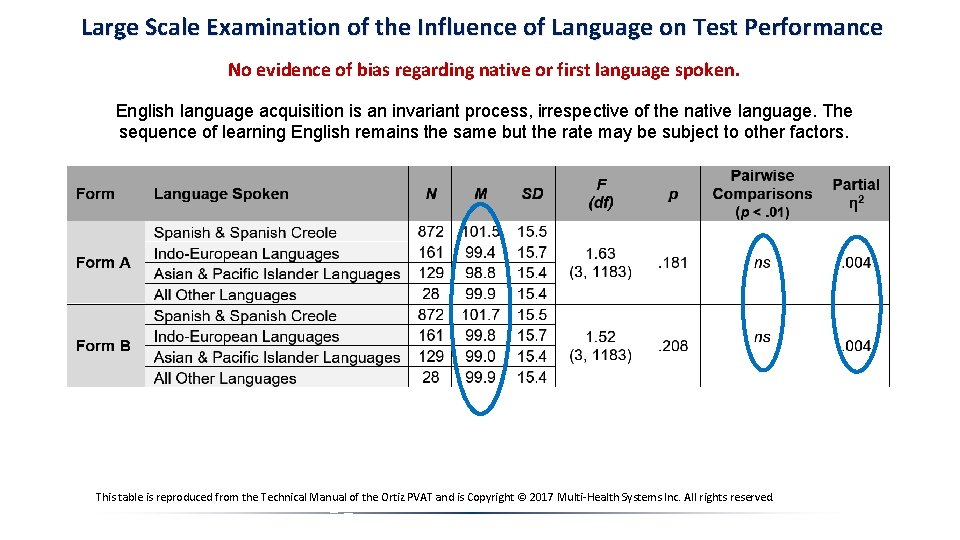
Large Scale Examination of the Influence of Language on Test Performance No evidence of bias regarding native or first language spoken. English language acquisition is an invariant process, irrespective of the native language. The sequence of learning English remains the same but the rate may be subject to other factors. This table is reproduced from the Technical Manual of the Ortiz PVAT and is Copyright © 2017 Multi-Health Systems Inc. All rights reserved.
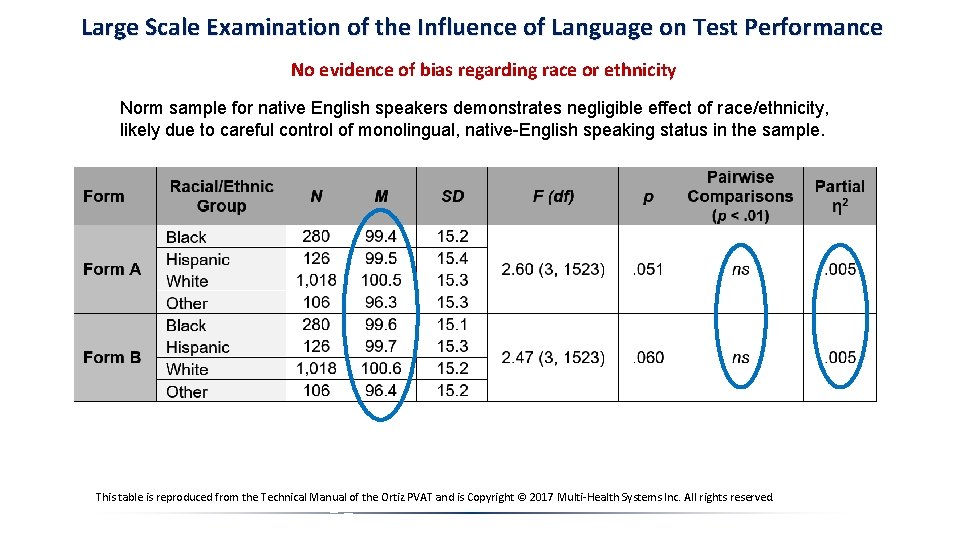
Large Scale Examination of the Influence of Language on Test Performance No evidence of bias regarding race or ethnicity Norm sample for native English speakers demonstrates negligible effect of race/ethnicity, likely due to careful control of monolingual, native-English speaking status in the sample. This table is reproduced from the Technical Manual of the Ortiz PVAT and is Copyright © 2017 Multi-Health Systems Inc. All rights reserved.
The Culture-Language Interpretive Matrix (C-LIM) Important Facts for Use and Practice The C-LIM is not a test, scale, measure, or mechanism for making diagnoses. The C-LIM is a dynamic and modifiable visual representation of both current and prior research on the test performance of English learners arranged by mean values that permits examination of the combined influence of acculturative knowledge acquisition and limited English proficiency and its impact on test score validity. The C-LIM is not a language proficiency measure and will not “distinguish” between native English speakers and English learners and is not designed to determine if someone is or is not an English learner. Moreover, the C-LIM is not for use with individuals who are native English speakers. The C-LIM is valid as long as the research upon which it is based is valid. Even research critical of the C-LIM continues to provide data that supports its use in evaluation. The failure of researchers to understand the CLIM or ELs is unfortunate and their criticisms serve only to cloud best practice by unnecessarily alarming practitioners who would otherwise be unable to conduct evidence-based practice without the C-LIM. The C-LIM’s primary purpose is to assist evaluators in ruling out cultural and linguistic influences as exclusionary factors that may have undermined the validity of test scores, particularly in evaluations of SLD or other cognitive-based disorders. Being able to make this determination is the primary and main hurdle in evaluation of ELs and the C-LIM represents an evidence-based method that assists clinician’s regarding interpretation of test score data in a nondiscriminatory manner. Free C-LIM and resources available at: http: //facpub. stjohns. edu/~ortizs/CLIM/index. html