
Testing the first Mainz SMDHBU Sascha Krause Johannes
Testing the first Mainz SMD-HBU Sascha Krause Johannes Gutenberg-Universität Mainz CALICE Collaboration Meeting, MPP Munich Sep. 10, 2015 Norman Bhatti, Volker Büscher, Julien Caudron, Phi Chau, Reinhold Degele, Karl-Heinz Geib, Yong Liu, Lucia Masetti, Anna Rosmanitz, Ulrich Schäfer, Stefan Tapprogge, Rainer Wanke
Testing the first Mainz SMD-HBU Outline: • Measurements performed in Mainz • Obtaining Pedestal and Gain Values • Comparison to Gain Values at DESY April Testbeam • Measurement of Muons in Cosmic Ray Test Stand • Determination of MIP Response • Measurements performed at DESY April Testbeam • MIP reponse analysis steps • Investigating in understanding long tail • Estimation of MIP Response • Comparison • Conclusion
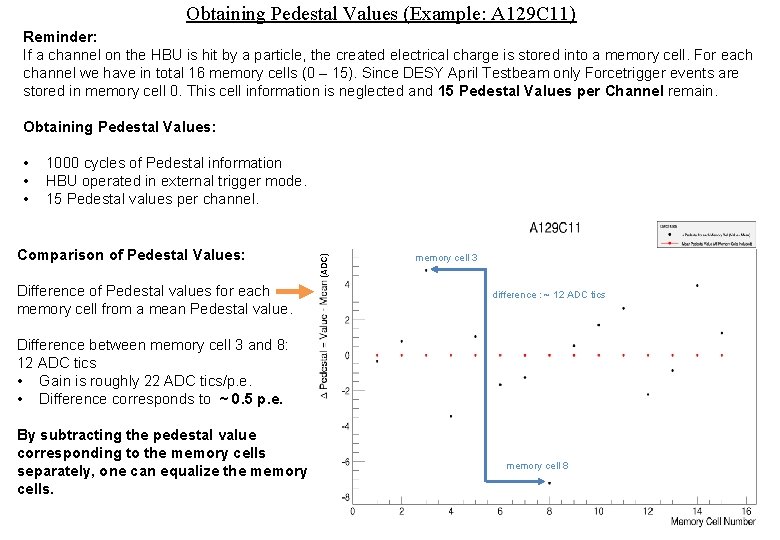
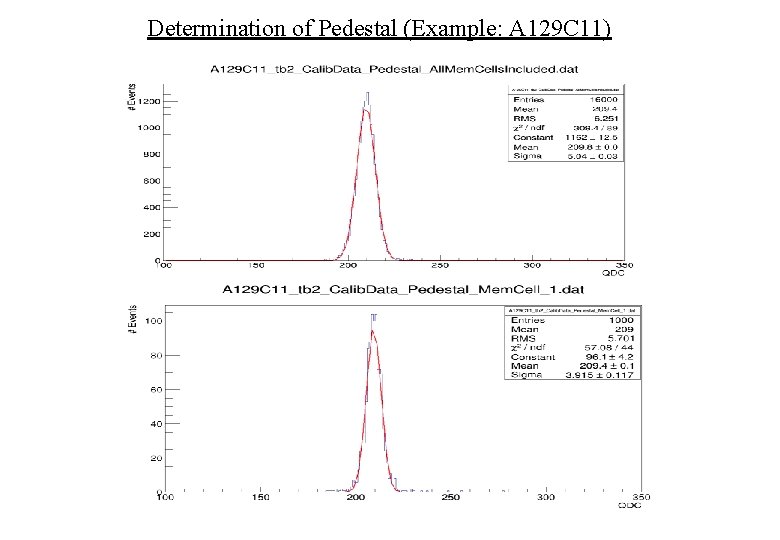
Obtaining Pedestal Values (Example: A 129 C 11) Reminder: If a channel on the HBU is hit by a particle, the created electrical charge is stored into a memory cell. For each channel we have in total 16 memory cells (0 – 15). Since DESY April Testbeam only Forcetrigger events are stored in memory cell 0. This cell information is neglected and 15 Pedestal Values per Channel remain. Obtaining Pedestal Values: 1000 cycles of Pedestal information HBU operated in external trigger mode. 15 Pedestal values per channel. Comparison of Pedestal Values: Difference of Pedestal values for each memory cell from a mean Pedestal value. (ADC) • • • memory cell 3 difference : ~ 12 ADC tics Difference between memory cell 3 and 8: 12 ADC tics • Gain is roughly 22 ADC tics/p. e. • Difference corresponds to ~ 0. 5 p. e. By subtracting the pedestal value corresponding to the memory cells separately, one can equalize the memory cells. memory cell 8
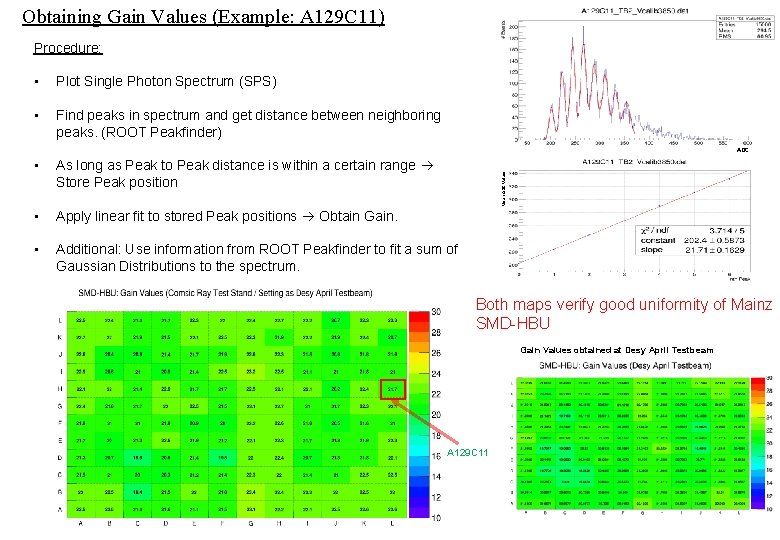
Obtaining Gain Values (Example: A 129 C 11) Procedure: • Plot Single Photon Spectrum (SPS) • Find peaks in spectrum and get distance between neighboring peaks. (ROOT Peakfinder) ADC As long as Peak to Peak distance is within a certain range Store Peak position • Apply linear fit to stored Peak positions Obtain Gain. • Additional: Use information from ROOT Peakfinder to fit a sum of Gaussian Distributions to the spectrum. Mean ADC Values • Both maps verify good uniformity of Mainz SMD-HBU Gain Values obtained at Desy April Testbeam A 129 C 11
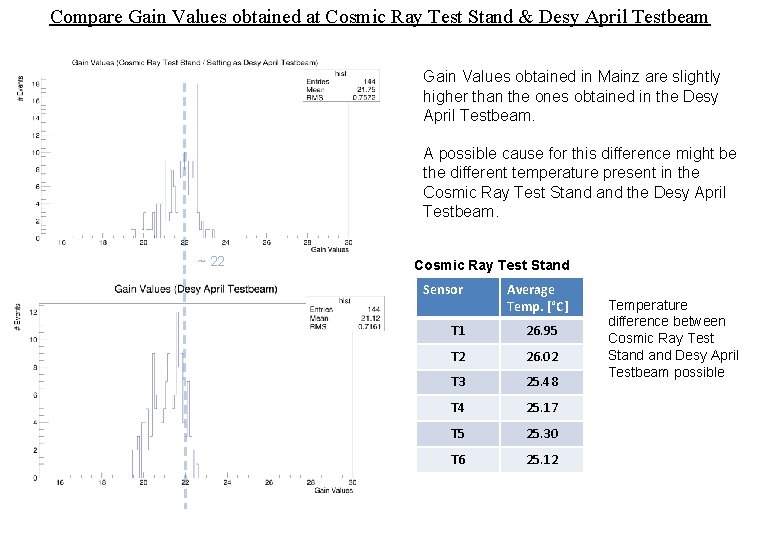
Compare Gain Values obtained at Cosmic Ray Test Stand & Desy April Testbeam Gain Values obtained in Mainz are slightly higher than the ones obtained in the Desy April Testbeam. A possible cause for this difference might be the different temperature present in the Cosmic Ray Test Stand the Desy April Testbeam. ~ 22 Cosmic Ray Test Stand Sensor Average Temp. [°C] T 1 26. 95 T 2 26. 02 T 3 25. 48 T 4 25. 17 T 5 25. 30 T 6 25. 12 Temperature difference between Cosmic Ray Test Stand Desy April Testbeam possible
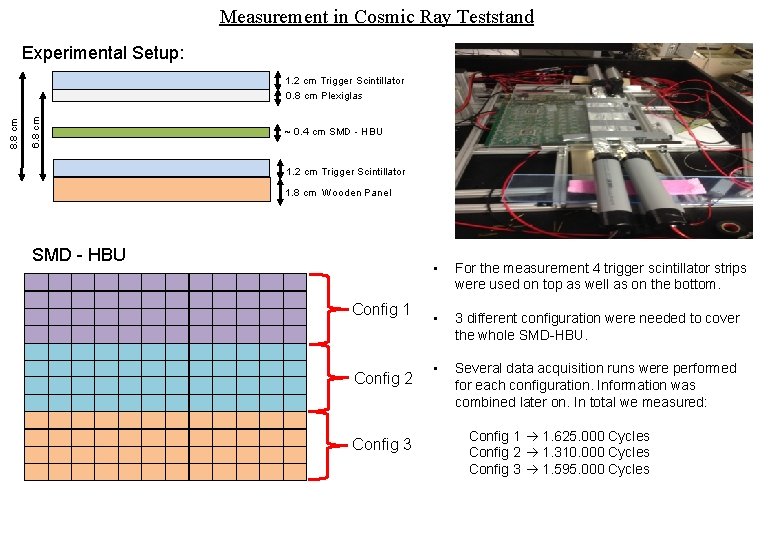
Measurement in Cosmic Ray Teststand Experimental Setup: 6. 8 cm 8. 8 cm 1. 2 cm Trigger Scintillator 0. 8 cm Plexiglas ~ 0. 4 cm SMD - HBU 1. 2 cm Trigger Scintillator 1. 8 cm Wooden Panel SMD - HBU Config 1 Config 2 Config 3 • For the measurement 4 trigger scintillator strips were used on top as well as on the bottom. • 3 different configuration were needed to cover the whole SMD-HBU. • Several data acquisition runs were performed for each configuration. Information was combined later on. In total we measured: Config 1 1. 625. 000 Cycles Config 2 1. 310. 000 Cycles Config 3 1. 595. 000 Cycles
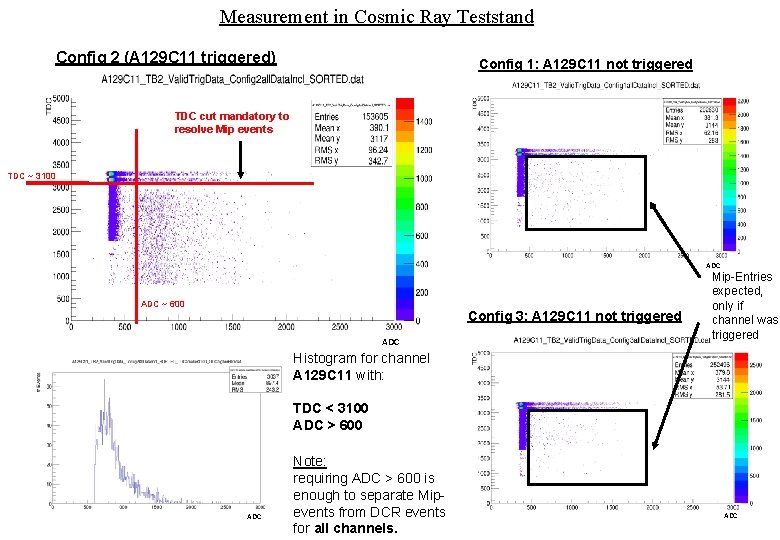
Measurement in Cosmic Ray Teststand Config 2 (A 129 C 11 triggered) Config 1: A 129 C 11 not triggered TDC cut mandatory to resolve Mip events TDC ~ 3100 ADC ~ 600 Config 3: A 129 C 11 not triggered ADC Mip-Entries expected, only if channel was triggered Histogram for channel A 129 C 11 with: TDC < 3100 ADC > 600 ADC Note: requiring ADC > 600 is enough to separate Mipevents from DCR events for all channels. ADC
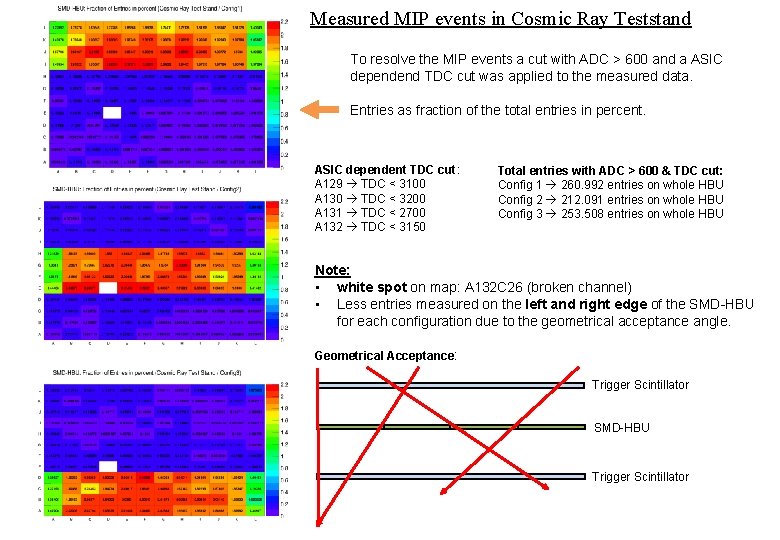
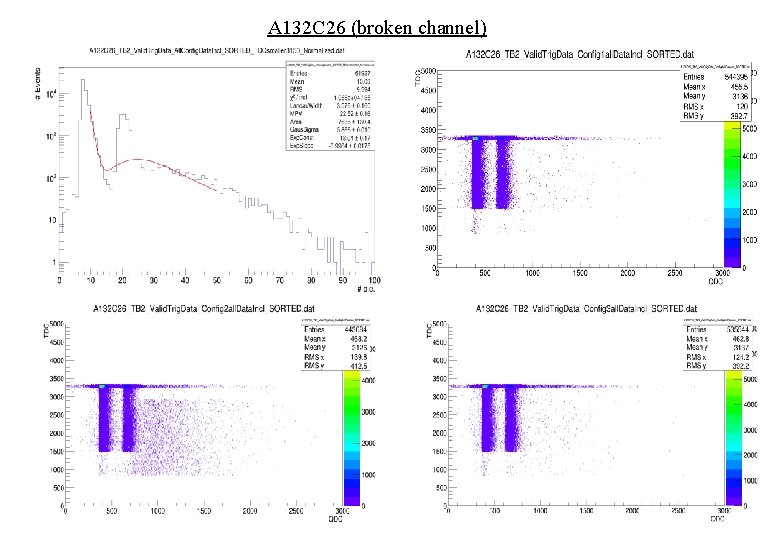
Measured MIP events in Cosmic Ray Teststand To resolve the MIP events a cut with ADC > 600 and a ASIC dependend TDC cut was applied to the measured data. Entries as fraction of the total entries in percent. ASIC dependent TDC cut: A 129 TDC < 3100 A 130 TDC < 3200 A 131 TDC < 2700 A 132 TDC < 3150 Total entries with ADC > 600 & TDC cut: Config 1 260. 992 entries on whole HBU Config 2 212. 091 entries on whole HBU Config 3 253. 508 entries on whole HBU Note: • white spot on map: A 132 C 26 (broken channel) • Less entries measured on the left and right edge of the SMD-HBU for each configuration due to the geometrical acceptance angle. Geometrical Acceptance: Trigger Scintillator SMD-HBU Trigger Scintillator
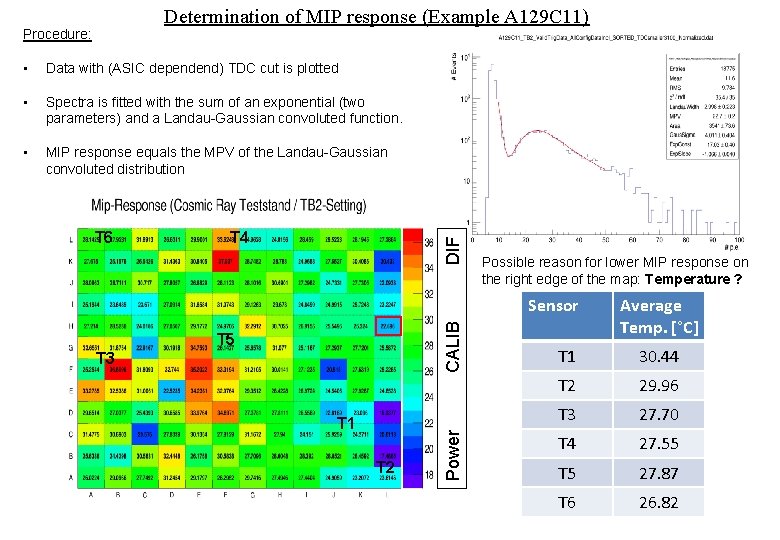
Determination of MIP response (Example A 129 C 11) Procedure: • Data with (ASIC dependend) TDC cut is plotted • Spectra is fitted with the sum of an exponential (two parameters) and a Landau-Gaussian convoluted function. • MIP response equals the MPV of the Landau-Gaussian convoluted distribution T 4 DIF T 6 Possible reason for lower MIP response on the right edge of the map: Temperature ? T 5 T 3 T 1 T 2 Power CALIB Sensor Average Temp. [°C] T 1 30. 44 T 2 29. 96 T 3 27. 70 T 4 27. 55 T 5 27. 87 T 6 26. 82
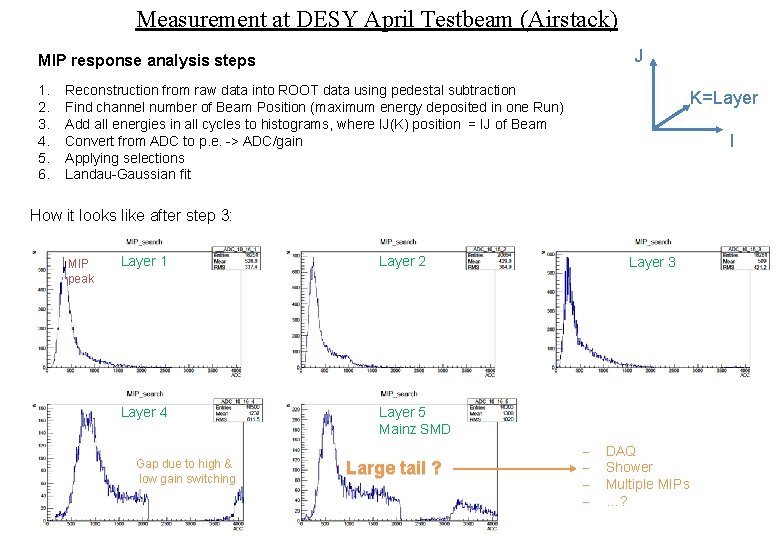
Measurement at DESY April Testbeam (Airstack) J MIP response analysis steps 1. 2. 3. 4. 5. 6. Reconstruction from raw data into ROOT data using pedestal subtraction Find channel number of Beam Position (maximum energy deposited in one Run) Add all energies in all cycles to histograms, where IJ(K) position = IJ of Beam Convert from ADC to p. e. -> ADC/gain Applying selections Landau-Gaussian fit K=Layer I How it looks like after step 3: MIP peak Layer 1 Layer 2 Layer 4 Layer 5 Mainz SMD Gap due to high & low gain switching Large tail ? Layer 3 - DAQ Shower Multiple MIPs …?
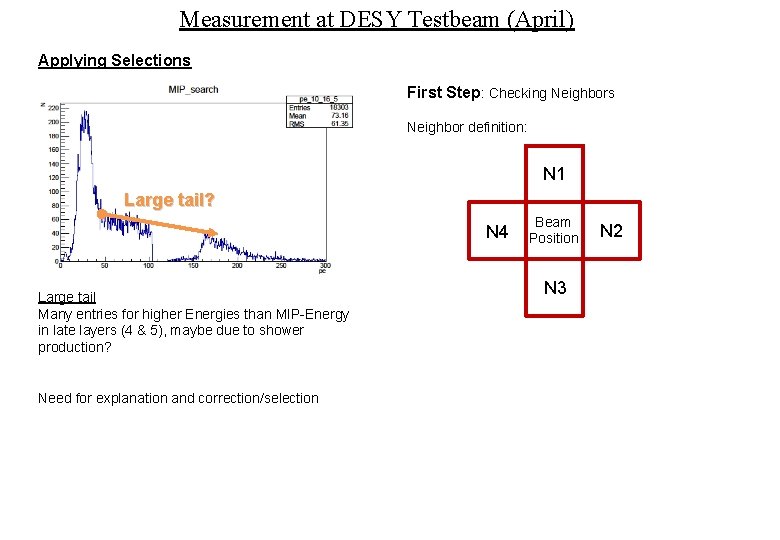
Measurement at DESY Testbeam (April) Applying Selections First Step: Checking Neighbors Neighbor definition: N 1 Large tail? N 4 Large tail Many entries for higher Energies than MIP-Energy in late layers (4 & 5), maybe due to shower production? Need for explanation and correction/selection Beam Position N 3 N 2
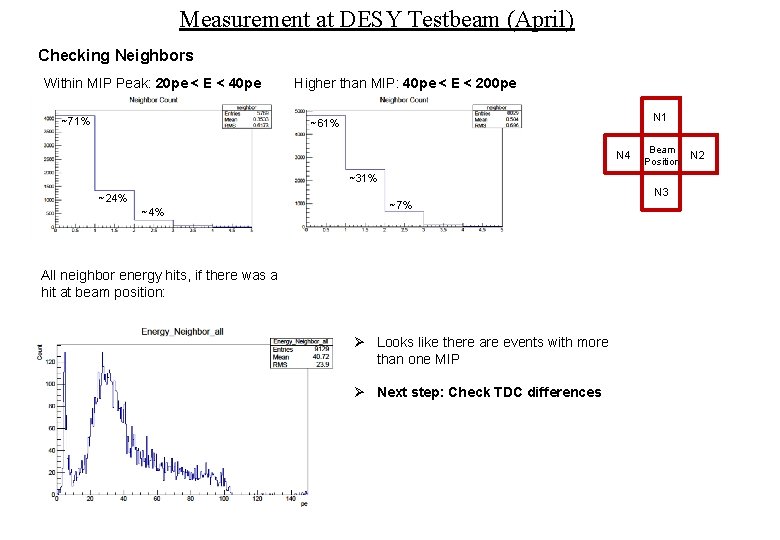
Measurement at DESY Testbeam (April) Checking Neighbors Within MIP Peak: 20 pe < E < 40 pe ~71% Higher than MIP: 40 pe < E < 200 pe N 1 ~61% N 4 Beam Position ~31% N 3 ~24% ~7% All neighbor energy hits, if there was a hit at beam position: Ø Looks like there are events with more than one MIP Ø Next step: Check TDC differences N 2
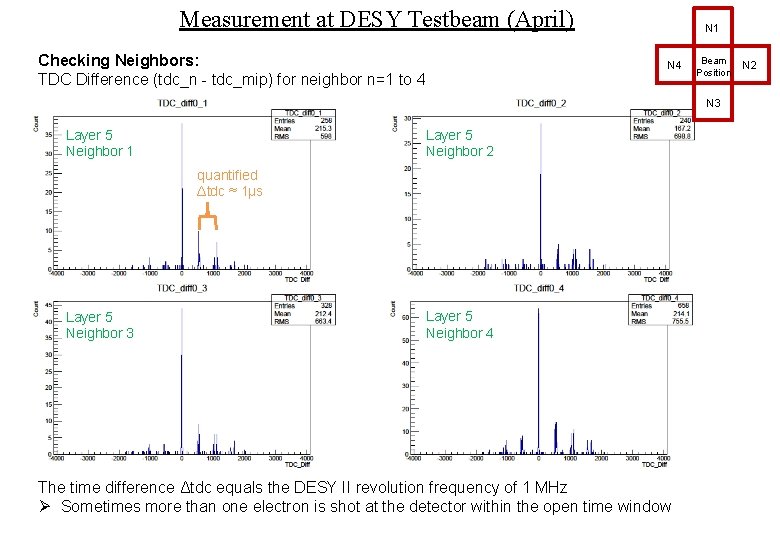
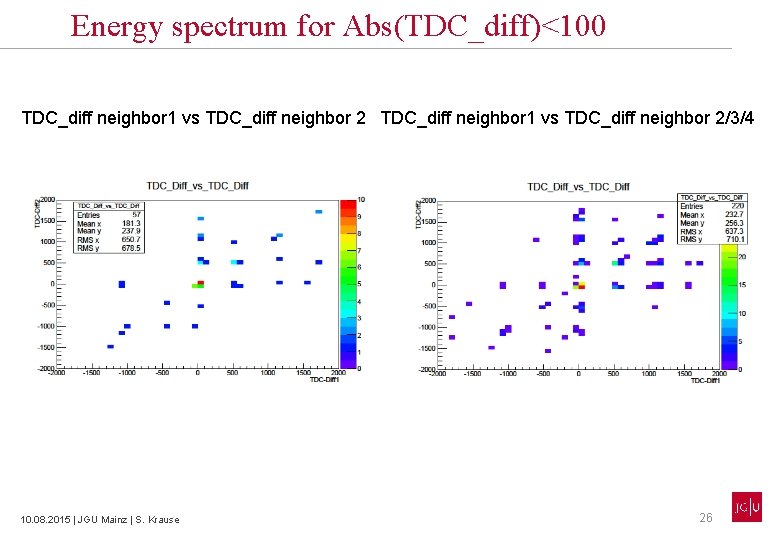
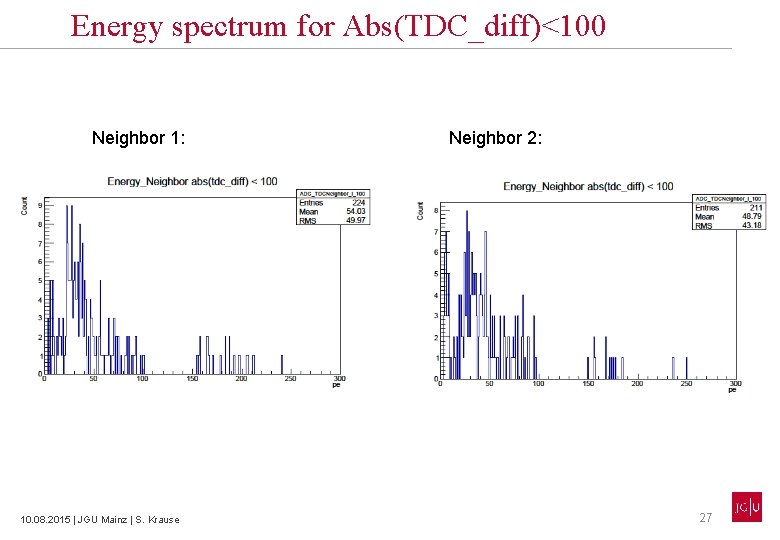
Measurement at DESY Testbeam (April) Checking Neighbors: TDC Difference (tdc_n - tdc_mip) for neighbor n=1 to 4 N 1 N 4 Beam Position N 3 Layer 5 Neighbor 1 Layer 5 Neighbor 2 quantified Δtdc ≈ 1µs Layer 5 Neighbor 3 Layer 5 Neighbor 4 The time difference Δtdc equals the DESY II revolution frequency of 1 MHz Ø Sometimes more than one electron is shot at the detector within the open time window N 2
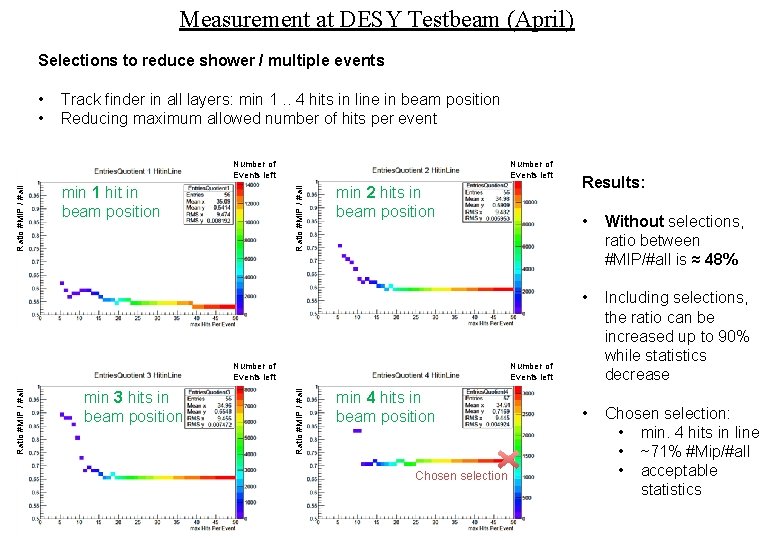
Measurement at DESY Testbeam (April) Selections to reduce shower / multiple events • • Track finder in all layers: min 1. . 4 hits in line in beam position Reducing maximum allowed number of hits per event Number of Events left min 1 hit in beam position Ratio #MIP / #all Number of Events left min 2 hits in beam position min 3 hits in beam position • Without selections, ratio between #MIP/#all is ≈ 48% • Including selections, the ratio can be increased up to 90% while statistics decrease • Chosen selection: • min. 4 hits in line • ~71% #Mip/#all • acceptable statistics Number of Events left Ratio #MIP / #all Number of Events left Results: min 4 hits in beam position Chosen selection
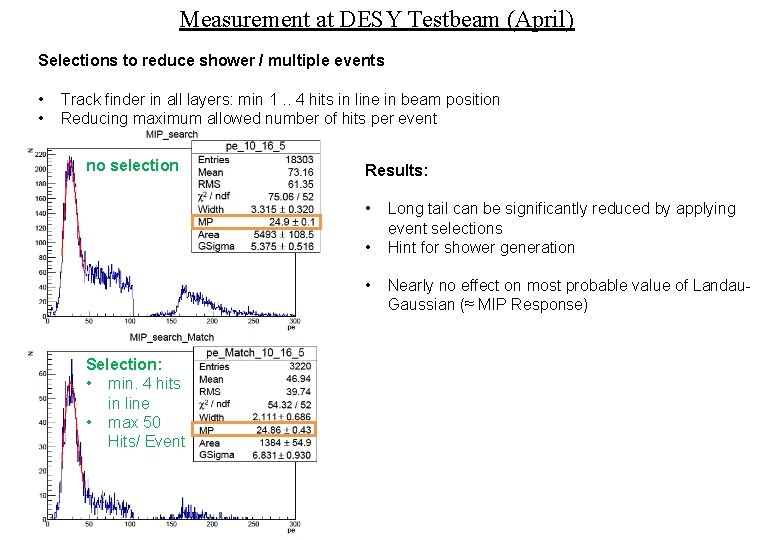
Measurement at DESY Testbeam (April) Selections to reduce shower / multiple events • • Track finder in all layers: min 1. . 4 hits in line in beam position Reducing maximum allowed number of hits per event no selection Results: • • • Selection: • min. 4 hits in line • max 50 Hits/ Event Long tail can be significantly reduced by applying event selections Hint for shower generation Nearly no effect on most probable value of Landau. Gaussian (≈ MIP Response)
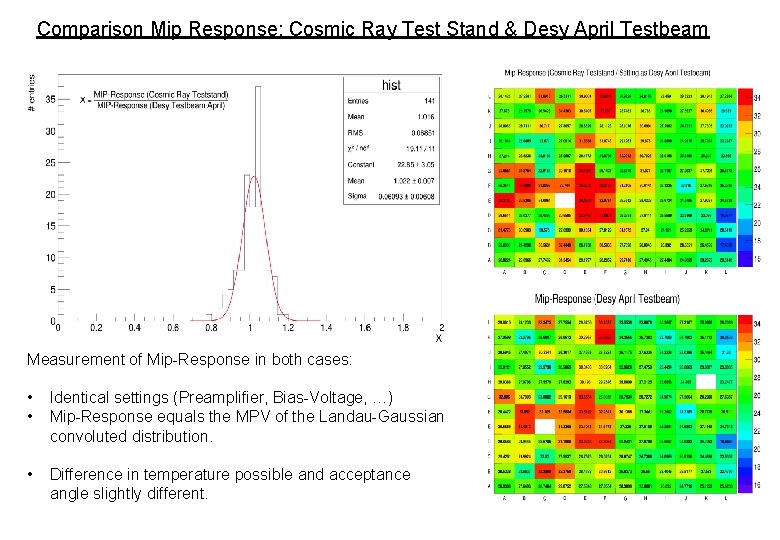
Comparison Mip Response: Cosmic Ray Test Stand & Desy April Testbeam Measurement of Mip-Response in both cases: • • Identical settings (Preamplifier, Bias-Voltage, …) Mip-Response equals the MPV of the Landau-Gaussian convoluted distribution. • Difference in temperature possible and acceptance angle slightly different.
Conclusion • • Cosmic Ray Test Stand: • allows to measure Pedestal, Gain and MIP response which equal the results of the DESY April Testbeam • SMD-HBU shows a good uniformity in gain DESY April TB: • Neighbor TDC differences show: Sometimes more than one electron is shot at the detector within the open time window • Should belong to a different event • Selections like trackfinders reduce large tail in ADCSpectrum but don’t have large influence on MIP response analysis

Thank you!
Backup
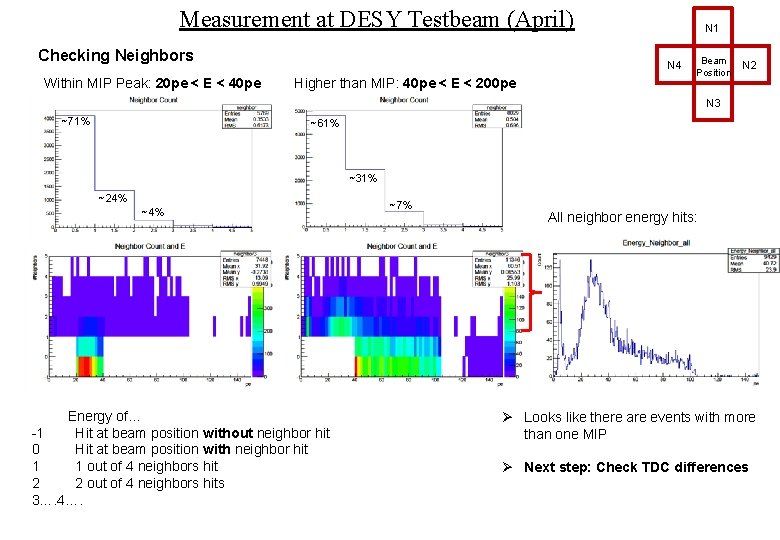
Measurement at DESY Testbeam (April) Checking Neighbors Within MIP Peak: 20 pe < E < 40 pe N 1 N 4 Higher than MIP: 40 pe < E < 200 pe Beam Position N 2 N 3 ~71% ~61% ~31% ~24% ~4% Energy of… -1 Hit at beam position without neighbor hit 0 Hit at beam position with neighbor hit 1 1 out of 4 neighbors hit 2 2 out of 4 neighbors hits 3…. 4…. ~7% All neighbor energy hits: Ø Looks like there are events with more than one MIP Ø Next step: Check TDC differences
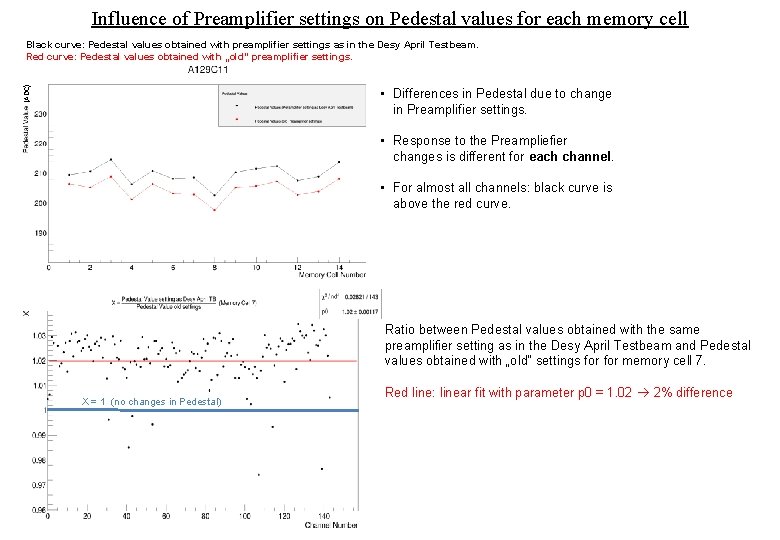
Influence of Preamplifier settings on Pedestal values for each memory cell (ADC) Black curve: Pedestal values obtained with preamplifier settings as in the Desy April Testbeam. Red curve: Pedestal values obtained with „old“ preamplifier settings. • Differences in Pedestal due to change in Preamplifier settings. • Response to the Preampliefier changes is different for each channel. • For almost all channels: black curve is above the red curve. Ratio between Pedestal values obtained with the same preamplifier setting as in the Desy April Testbeam and Pedestal values obtained with „old“ settings for memory cell 7. X = 1 (no changes in Pedestal) Red line: linear fit with parameter p 0 = 1. 02 2% difference
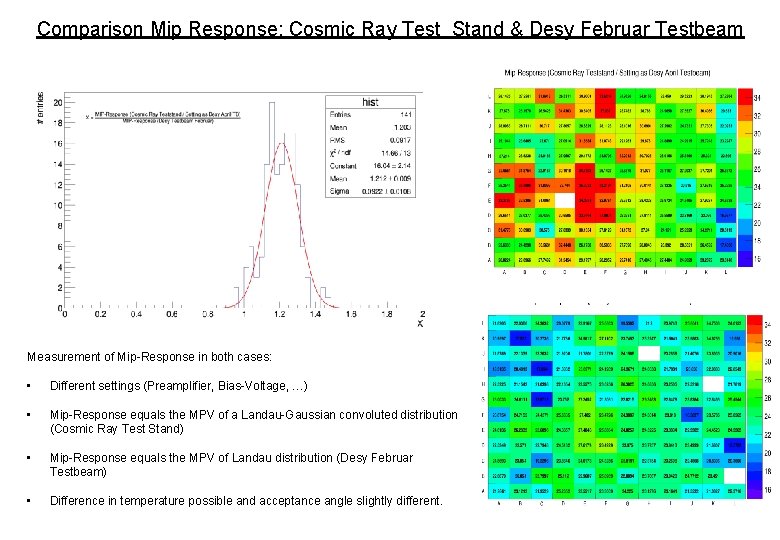
Comparison Mip Response: Cosmic Ray Test Stand & Desy Februar Testbeam Measurement of Mip-Response in both cases: • Different settings (Preamplifier, Bias-Voltage, …) • Mip-Response equals the MPV of a Landau-Gaussian convoluted distribution (Cosmic Ray Test Stand) • Mip-Response equals the MPV of Landau distribution (Desy Februar Testbeam) • Difference in temperature possible and acceptance angle slightly different.
Determination of Pedestal (Example: A 129 C 11)
A 132 C 26 (broken channel)
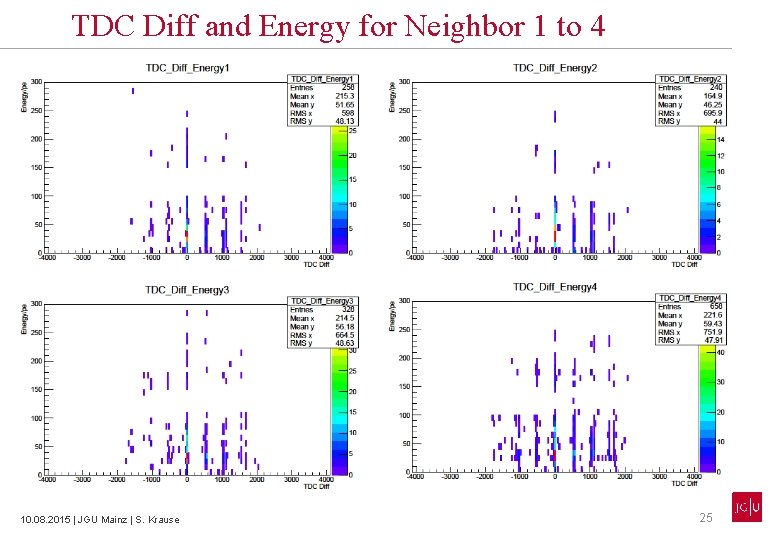
TDC Diff and Energy for Neighbor 1 to 4 10. 08. 2015 | JGU Mainz | S. Krause 25
Energy spectrum for Abs(TDC_diff)<100 TDC_diff neighbor 1 vs TDC_diff neighbor 2/3/4 10. 08. 2015 | JGU Mainz | S. Krause 26
Energy spectrum for Abs(TDC_diff)<100 Neighbor 1: 10. 08. 2015 | JGU Mainz | S. Krause Neighbor 2: 27
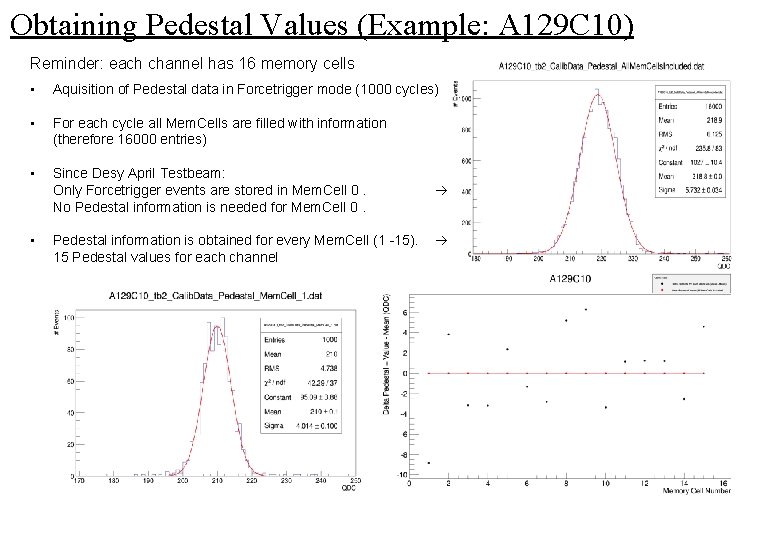
Obtaining Pedestal Values (Example: A 129 C 10) Reminder: each channel has 16 memory cells • Aquisition of Pedestal data in Forcetrigger mode (1000 cycles) • For each cycle all Mem. Cells are filled with information (therefore 16000 entries) • Since Desy April Testbeam: Only Forcetrigger events are stored in Mem. Cell 0. No Pedestal information is needed for Mem. Cell 0. • Pedestal information is obtained for every Mem. Cell (1 -15). 15 Pedestal values for each channel
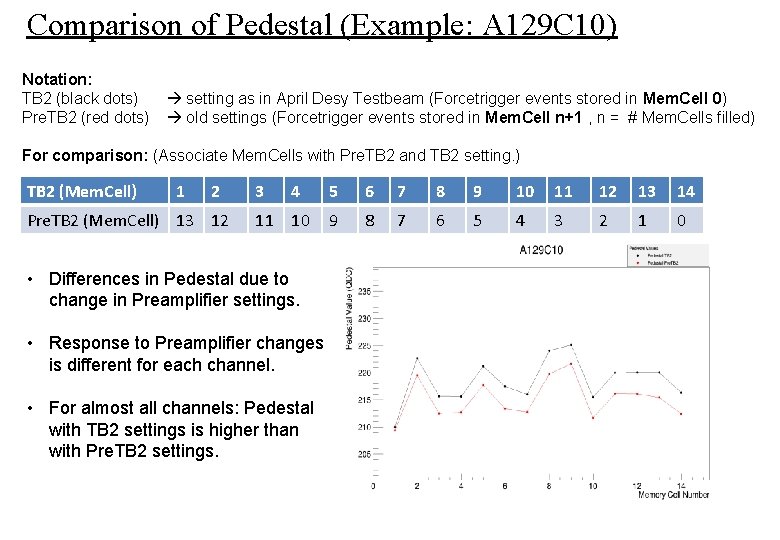
Comparison of Pedestal (Example: A 129 C 10) Notation: TB 2 (black dots) Pre. TB 2 (red dots) setting as in April Desy Testbeam (Forcetrigger events stored in Mem. Cell 0) old settings (Forcetrigger events stored in Mem. Cell n+1 , n = # Mem. Cells filled) For comparison: (Associate Mem. Cells with Pre. TB 2 and TB 2 setting. ) TB 2 (Mem. Cell) 1 2 Pre. TB 2 (Mem. Cell) 13 12 3 4 11 10 • Differences in Pedestal due to change in Preamplifier settings. • Response to Preamplifier changes is different for each channel. • For almost all channels: Pedestal with TB 2 settings is higher than with Pre. TB 2 settings. 5 6 7 8 9 10 11 12 13 14 9 8 7 6 5 4 3 2 1 0
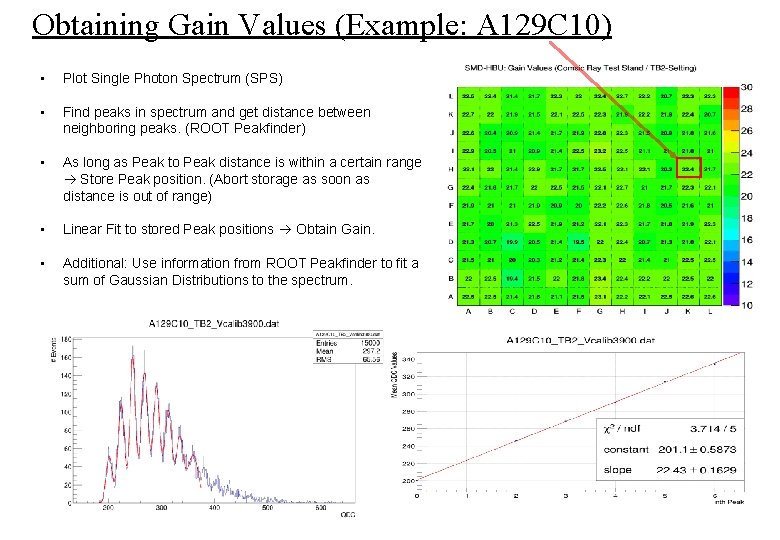
Obtaining Gain Values (Example: A 129 C 10) • Plot Single Photon Spectrum (SPS) • Find peaks in spectrum and get distance between neighboring peaks. (ROOT Peakfinder) • As long as Peak to Peak distance is within a certain range Store Peak position. (Abort storage as soon as distance is out of range) • Linear Fit to stored Peak positions Obtain Gain. • Additional: Use information from ROOT Peakfinder to fit a sum of Gaussian Distributions to the spectrum.
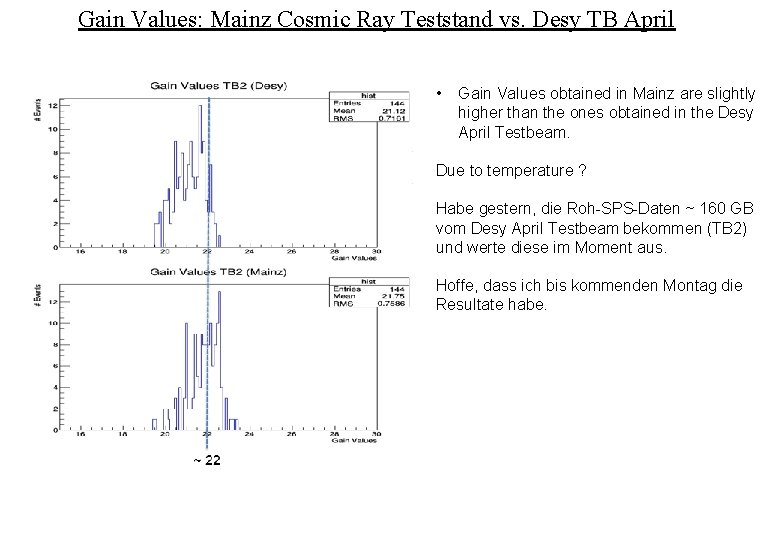
Gain Values: Mainz Cosmic Ray Teststand vs. Desy TB April • Gain Values obtained in Mainz are slightly higher than the ones obtained in the Desy April Testbeam. Due to temperature ? Habe gestern, die Roh-SPS-Daten ~ 160 GB vom Desy April Testbeam bekommen (TB 2) und werte diese im Moment aus. Hoffe, dass ich bis kommenden Montag die Resultate habe.
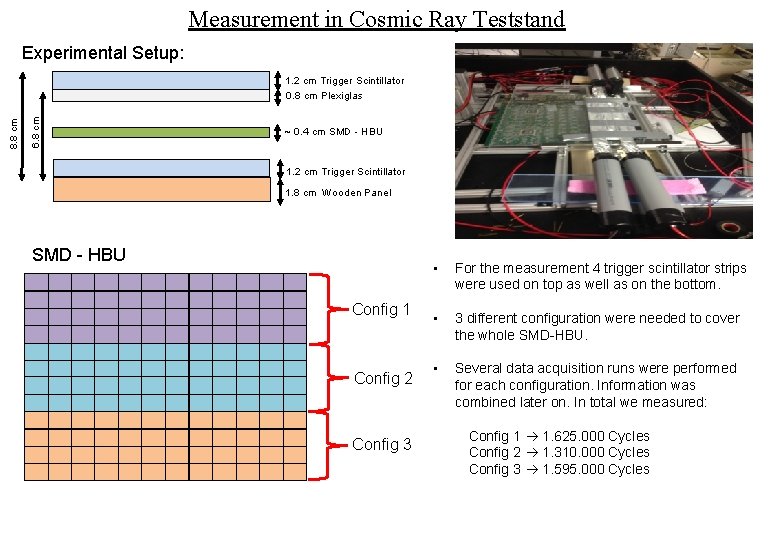
Measurement in Cosmic Ray Teststand Experimental Setup: 6. 8 cm 8. 8 cm 1. 2 cm Trigger Scintillator 0. 8 cm Plexiglas ~ 0. 4 cm SMD - HBU 1. 2 cm Trigger Scintillator 1. 8 cm Wooden Panel SMD - HBU Config 1 Config 2 Config 3 • For the measurement 4 trigger scintillator strips were used on top as well as on the bottom. • 3 different configuration were needed to cover the whole SMD-HBU. • Several data acquisition runs were performed for each configuration. Information was combined later on. In total we measured: Config 1 1. 625. 000 Cycles Config 2 1. 310. 000 Cycles Config 3 1. 595. 000 Cycles
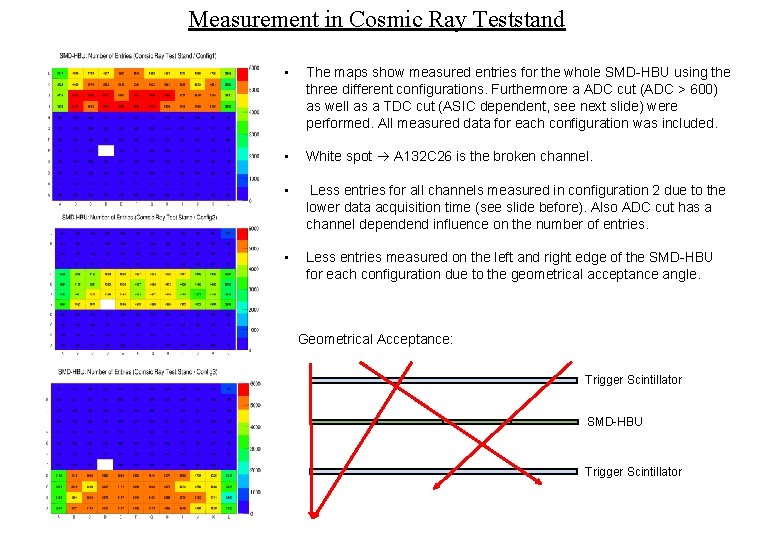
Measurement in Cosmic Ray Teststand • The maps show measured entries for the whole SMD-HBU using the three different configurations. Furthermore a ADC cut (ADC > 600) as well as a TDC cut (ASIC dependent, see next slide) were performed. All measured data for each configuration was included. • White spot A 132 C 26 is the broken channel. • Less entries for all channels measured in configuration 2 due to the lower data acquisition time (see slide before). Also ADC cut has a channel dependend influence on the number of entries. • Less entries measured on the left and right edge of the SMD-HBU for each configuration due to the geometrical acceptance angle. Geometrical Acceptance: Trigger Scintillator SMD-HBU Trigger Scintillator
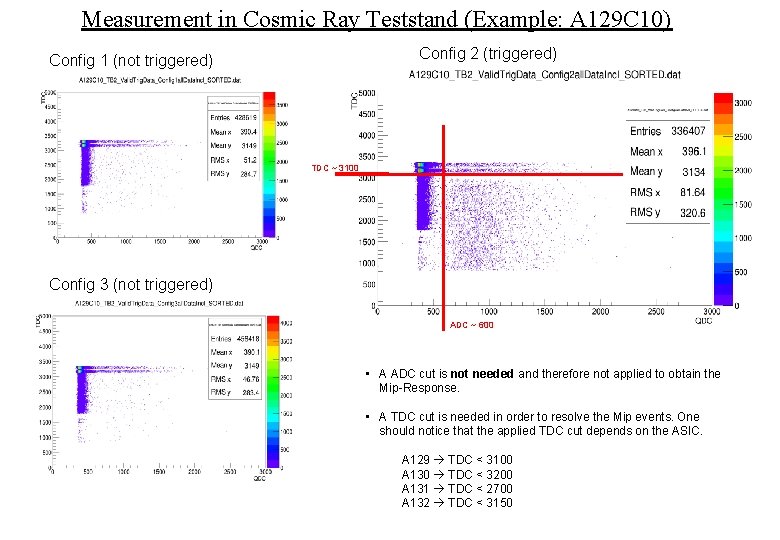
Measurement in Cosmic Ray Teststand (Example: A 129 C 10) Config 2 (triggered) Config 1 (not triggered) TDC ~ 3100 Config 3 (not triggered) ADC ~ 600 • A ADC cut is not needed and therefore not applied to obtain the Mip-Response. • A TDC cut is needed in order to resolve the Mip events. One should notice that the applied TDC cut depends on the ASIC. A 129 TDC < 3100 A 130 TDC < 3200 A 131 TDC < 2700 A 132 TDC < 3150
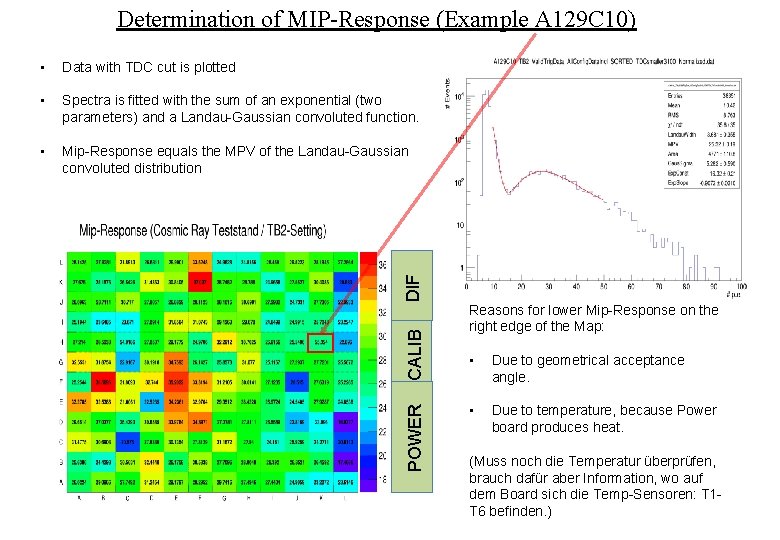
Determination of MIP-Response (Example A 129 C 10) Data with TDC cut is plotted • Spectra is fitted with the sum of an exponential (two parameters) and a Landau-Gaussian convoluted function. • Mip-Response equals the MPV of the Landau-Gaussian convoluted distribution POWER CALIB DIF • Reasons for lower Mip-Response on the right edge of the Map: • Due to geometrical acceptance angle. • Due to temperature, because Power board produces heat. (Muss noch die Temperatur überprüfen, brauch dafür aber Information, wo auf dem Board sich die Temp-Sensoren: T 1 T 6 befinden. )
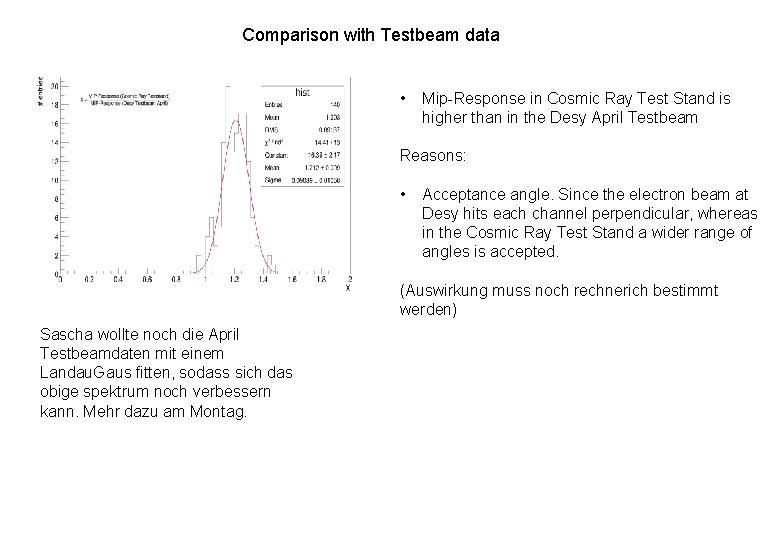
Comparison with Testbeam data • Mip-Response in Cosmic Ray Test Stand is higher than in the Desy April Testbeam Reasons: • Acceptance angle. Since the electron beam at Desy hits each channel perpendicular, whereas in the Cosmic Ray Test Stand a wider range of angles is accepted. (Auswirkung muss noch rechnerich bestimmt werden) Sascha wollte noch die April Testbeamdaten mit einem Landau. Gaus fitten, sodass sich das obige spektrum noch verbessern kann. Mehr dazu am Montag.
- Slides: 36