Testing for moderators A moderator is a third


 and")


 616 666 1282 SE zbar .")


. Group means")
 Research question or Study aims Search & eligibility Coding, computation of effects,")

 ◦")

 X 1 1 1 X’ . 10. 15. 12. 20. 25.")
 197 0 0 0 172 0 0 0 247 0 0")
 Intercept. 27 1. 67 Slope . 0062 -. 0289. 1540 S. E.")


 With multiple-arm studies, chose")
 from")


 – Association between parenting and childhood depression ◦")


- Slides: 40
Testing for moderators A moderator is a third variable that conditions the relations between 2 others. Because effect sizes are the relations between 2 variables, any variable that predicts the effect sizes is a moderator. Categorical Continuous Fixed vs. Mixed Research question or Study aims Search & eligibility Coding, computation of effects, conversions Analysis ◦ ◦ Overall Graphs Moderators Sensitivity Discussion
Number of Independent Variables In theory, a meta-analysis model can contain both continuous and categorical moderator variables. In theory, a model can contain an unlimited number of independent variables – statistical control for IVs In practice, independent variables are usually modeled one at a time, and there are often only a few IVs (should be theory-driven) There are problems with missing data and capitalization on chance. Often both Type I and Type II errors – many small k analyses
Categorical Moderator Example Correlation of SAT and Grades for Males (studies 1 -3) and Females (studies 4 -6)
Hypothetical SAT data Study 1 2 3 4 5 6 r. 40. 42. 45. 60. 55. 65 z. 42. 45. 48. 69. 62. 78 N 200 175 250 200 225 w 197 172 247 197 223 Sex M M M F F F What is the correlation overall? Is it different for males and females?
Study 1 2 3 4 5 6 Sum z. 42. 45. 48. 69. 62. 78 w 197 172 247 197 223 1282 w**2 38809 29584 61009 38809 49284 278504 w*z 83. 46 77. 00 119. 72 171. 21 121. 82 172. 12 745. 33 w*(z-zbar)**2 4. 90 3. 07 2. 31 3. 09 0. 27 8. 35 21. 99
Male Subset Study 1 2 3 Sum z. 42. 45. 48 w 197 172 247 616 w**2 38809 29584 61009 129402 w*z 83. 46 77. 00 119. 72 280. 18 w*(z-zbar)**2 . 192. 009. 220. 421
Female Subset Study 4 5 6 Sum z. 69. 62. 78 w 247 197 223 666 w**2 61009 38809 49284 149102 w*z 171. 21 121. 82 172. 12 465. 14 w*(z-zbar)**2 . 007 1. 26 1. 31 2. 58
Test of Moderator The test of the moderator is the test of QB. The test has df = (Number groups – 1). Here df=1, QB=18. 99, p<. 05. Moderator tests are based on fixed-effects analyses. Total Male Female Zbar . 58 . 45 . 70 Q 21. 99 . 42 2. 58
Group Means Group Male Female Total Sum (w) 616 666 1282 SE zbar . 040. 45. 039. 70. 028. 58 CI 95 L. 38. 62. 53 CI 95 U. 53. 77. 64 rbar CI 95 L. 43. 36. 60. 55. 52. 48 CI 95 U. 49. 65. 56 Note that the difference in means is. 25, which is quite large (and hypothetical; fictional data). Note also that we have a choice in whether to pool REVC when estimating group means for mixed model. Residual REVC is used.
Kvam data Moderator – blinding of outcome judges to condition To test for a moderator, you need a column designated as a moderator.
Moderator analysis Select the two blinding levels. Level 3 is for post outcomes and indicates ‘missing’ for this analysis.
After selecting data, choose computational options, and group by Blinding. Then also choose the pooled and compare options in the box that appears (not shown here).
From here, you can go to the next table for the test of the difference, or you can go to high resolution plot.
Mixed means moderator is fixed, effect size is random (the typical case). Group means Test of the significance of the moderator (null hypothesis of no difference in means between groups). This is a significant difference (consistent with the publication).
Moderator (categorical) Research question or Study aims Search & eligibility Coding, computation of effects, conversions Analysis ◦ ◦ Overall Graphs Moderators Sensitivity Discussion They noted a significant difference between subgroups. No blinding -> bigger effect.
My output.
Weighted Regression for Continuous Moderator OLS regression ◦ Assume equal error variances (homoscedasticity) ◦ Estimate magnitude of error, minimize SSE Weighted regression ◦ Error variances assumed known ◦ Error variances are unequal In meta-analysis, we know the sampling (error) variances, so can use weighted regression Minimize weighted SSE
Hypothetical SAT-Q and pct quant courses in GPA Study Does the percentage of 1 quantitative courses 2 influence (moderate) 3 the size of the correlation between 4 SAT-Q and GPA? 5 6 r. 40. 42. 45. 60. 55. 65 z. 42. 45. 48. 69. 62. 78 N 200 175 250 200 225 w 197 172 247 197 223 Pct Q. 10. 15. 12. 20. 25. 30
SAT-Q Matrices (1) X 1 1 1 X’ . 10. 15. 12. 20. 25. 30 y. 42. 45. 48. 69. 62. 78 1. 10 1. 15 V 1. 12 . 005 0 0 0 . 006 0 0 0 . 004 0 0 0 . 005 1 1. 20. 25 1. 30
SAT-Q Matrices (2) 197 0 0 0 172 0 0 0 247 0 0 0 197 0 0 0 222 V-1 . 27 1. 67 Intercept Slope . 0062 -. 0289. 1540
SAT-Q (3) Intercept. 27 1. 67 Slope . 0062 -. 0289. 1540 S. E. = sqrt(cjj) Intercept . 0787. 3924 Slope t t (or z) = b/S. E. 3. 41 4. 25 Intercept Slope
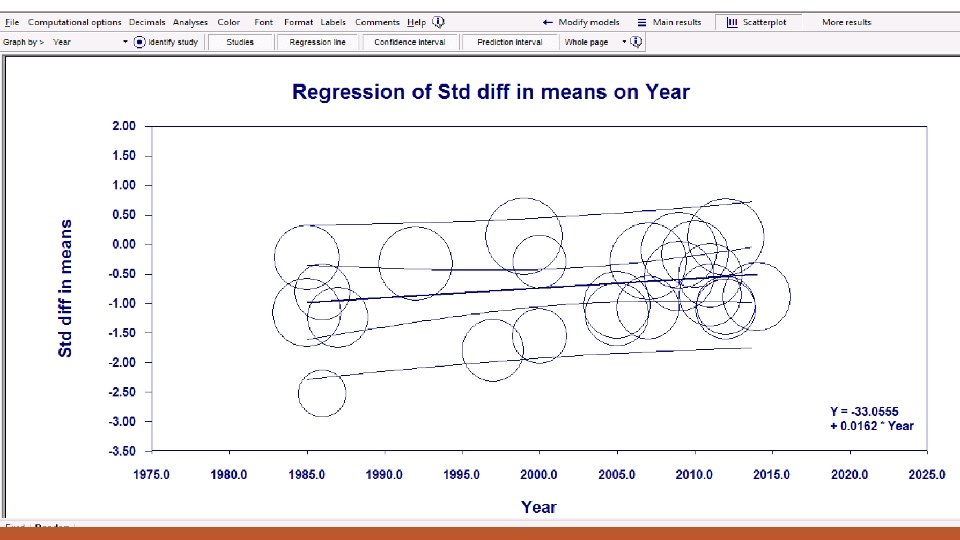
Kvam - Continuous Moderator CMA has improved the regression model substantially Scatterplot Multiple moderators Statistical Tests & Diagnostics
Regression 2 1. Select the data you want 2. Analyses -> Meta regression 2 3. Add variable(s) you want 3
Output Moderator Regression equation Method of computation & testing
Incremental variance
Hierarchical tests
Regression Diagnostics
CMA Exercise 5 Run the moderator test for the ’blinded’ moderator and interpret Run a forest plot for the same moderator Run a moderator test for the year of publication Run a regression plot for the same moderator
Break Coming up next -> Research question or Study aims Search & eligibility Coding, computation of effects, conversions Analysis ◦ ◦ Overall Graphs Moderators Sensitivity Discussion
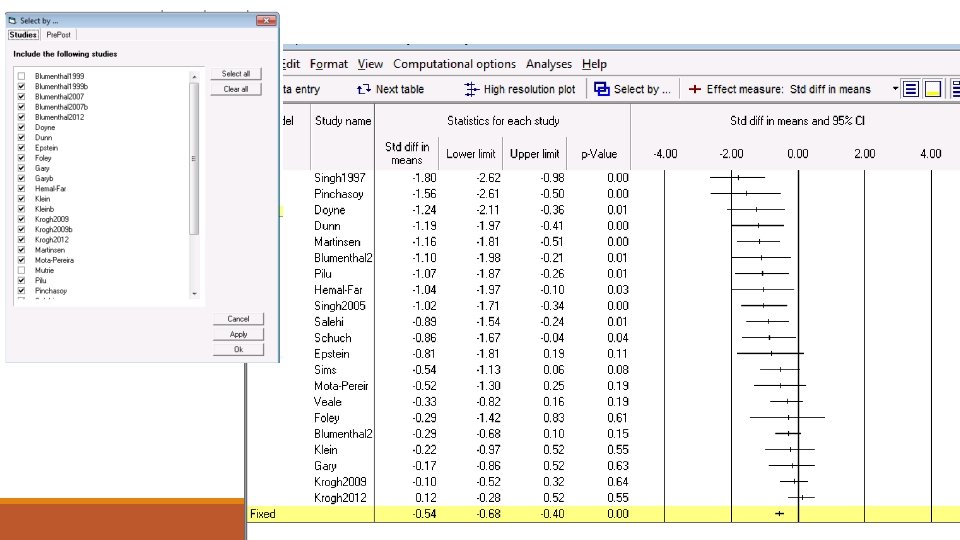
Sensitivity Publication bias ◦ Trim-and-fill ◦ Failsafe N (avoid this) With multiple-arm studies, chose the arm with the largest effect (failed to ask ‘what if? ’) Did not report any adjustment for outliers or differences in coder judgment In general, you are trying to see if your results would change if you made different decisions. If no difference, more confidence in conclusions. Research question or Study aims Search & eligibility Coding, computation of effects, conversions Analysis ◦ ◦ Overall Graphs Moderators Sensitivity Discussion
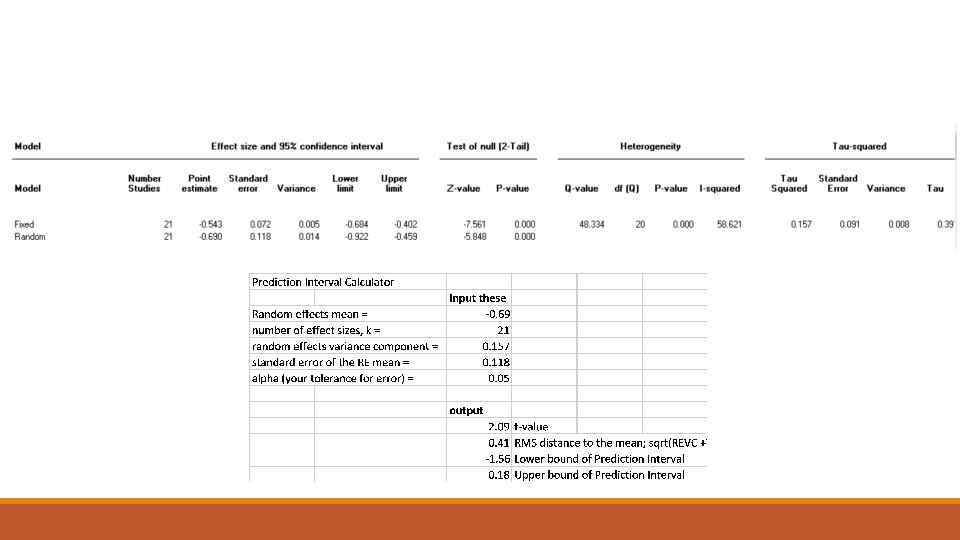
CMA Exercise 6 Drop the largest and smallest effect sizes (one of each) from the overall pretest dataset (23 to 21 effect sizes) Rerun the overall analysis Interpret the mean, CI, I-squared, and PI Compare to values you obtained using all 23 effect sizes (what differences and why)
Kvam’s Discussion Paragraph saying what is new and different Research question or Study aims Overall, exercise effective Search & eligibility Difference between blinded and not Coding, computation of effects, conversions Publication bias analyses suggest overall difference smaller, but still there Analysis Difference for control but not for conventional treatment (CBT etc. ) Effects of exercise diminish after treatment ends Need effectiveness studies, and studies of patient adherence ◦ ◦ Overall Graphs Moderators Sensitivity Discussion
Critique of Kvam Nice job with: Could have improved by: 1. Flow chart 1. Prediction intervals and REVC 2. Search terms & data in appendix 2. Graph of pre and post means for follow up 3. Random-effects model 3. Rater (coder) reliability: pct agree, kappa, ICC 4. Graphs 5. Publication bias and study quality (blinding) assessments 6. Logical next steps and where studies are needed 4. Multiple arms – chose largest - sensitivity
Break Coming up next Practice with a second dataset
Choose your data Mc. Leod (2007) – Association between parenting and childhood depression ◦ Effect size = r ◦ K = 45 ◦ Continuous and categorical moderators Fleminger (2003) – Association between head injury and Alzheimer’s disease ◦ Effect size = OR ◦ K = 15 ◦ Continuous and categorical moderators
Analysis 1 Compute and interpret overall mean, CI 2. Compute and interpret heterogeneity stats ◦ Tau-squared ◦ I-squared ◦ PI 3. Graph overall results with forest plot and interpret
Analysis 2 4. Compute and interpret categorical moderator 5. Compute and interpret continuous moderator 6. Run a funnel plot with trim-and-fill and interpret 7. Compare your results to those of the published article