
Testing Causal Hypotheses The Use of Test statistics




- Slides: 32
Testing Causal Hypotheses The Use of Test statistics and fit indices Willem E. Saris college titel en nummer
Importance of testing • All estimates of effects are based on the assumption that the model is correct • There are two possibilities of misspecifications: - omitted effects of variables - non-normal distribution of the variables • First we concentrate on omitted variables and effects • Later we will discuss deviations from normality 10/7/2020 college titel en nummer 2
An example • Assume that the correct model is presented below. • It is a two factor model with loadings of. 8 and a correlation between the factors of. 5 • and the loading of Y 4 on F 1 is. 2 10/7/2020 college titel en nummer 3
What is the population correlation matrix ? 10/7/2020 college titel en nummer 4
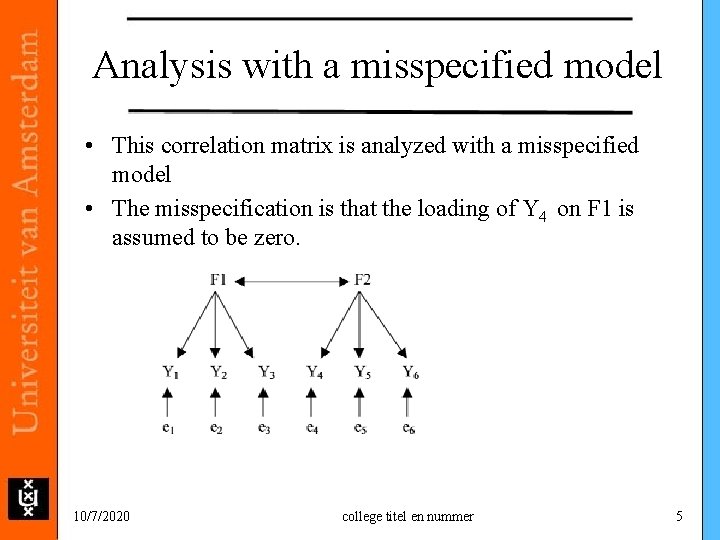
Analysis with a misspecified model • This correlation matrix is analyzed with a misspecified model • The misspecification is that the loading of Y 4 on F 1 is assumed to be zero. 10/7/2020 college titel en nummer 5
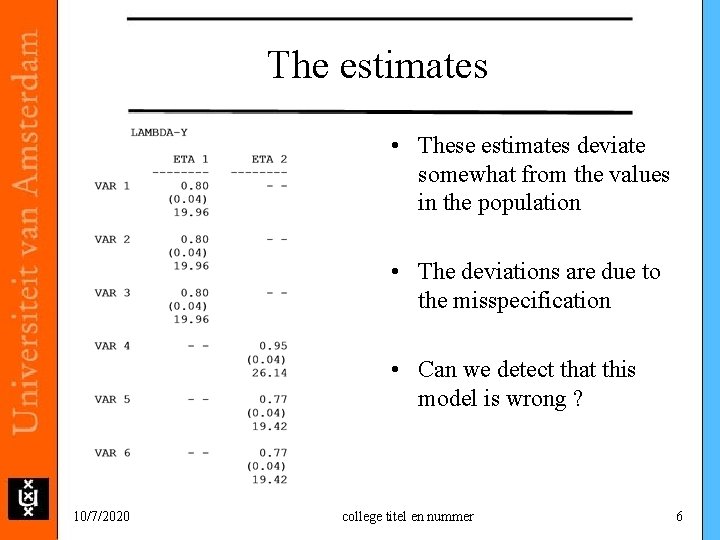
The estimates • These estimates deviate somewhat from the values in the population • The deviations are due to the misspecification • Can we detect that this model is wrong ? 10/7/2020 college titel en nummer 6
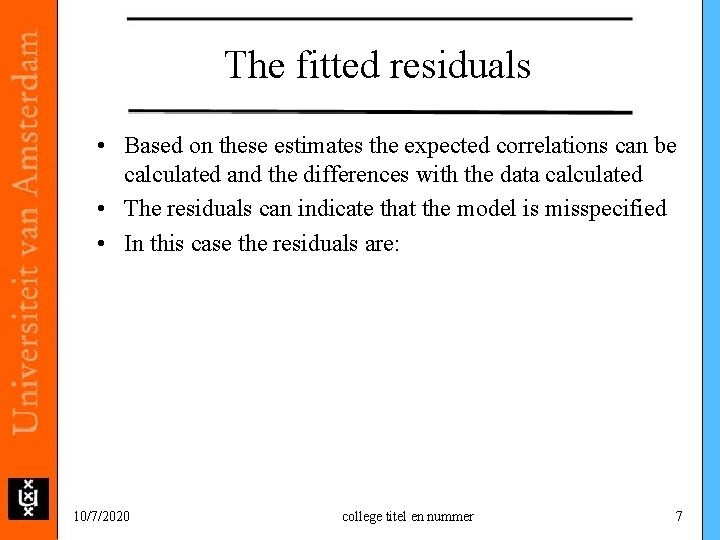
The fitted residuals • Based on these estimates the expected correlations can be calculated and the differences with the data calculated • The residuals can indicate that the model is misspecified • In this case the residuals are: 10/7/2020 college titel en nummer 7
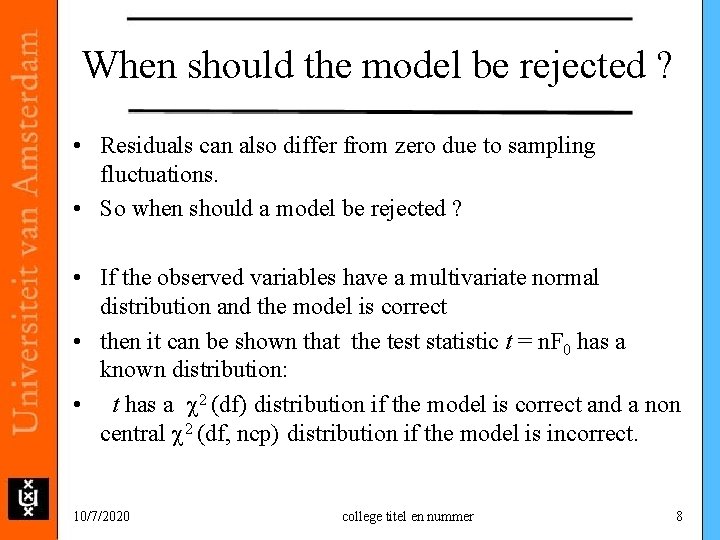
When should the model be rejected ? • Residuals can also differ from zero due to sampling fluctuations. • So when should a model be rejected ? • If the observed variables have a multivariate normal distribution and the model is correct • then it can be shown that the test statistic t = n. F 0 has a known distribution: • t has a 2 (df) distribution if the model is correct and a non central 2 (df, ncp) distribution if the model is incorrect. 10/7/2020 college titel en nummer 8
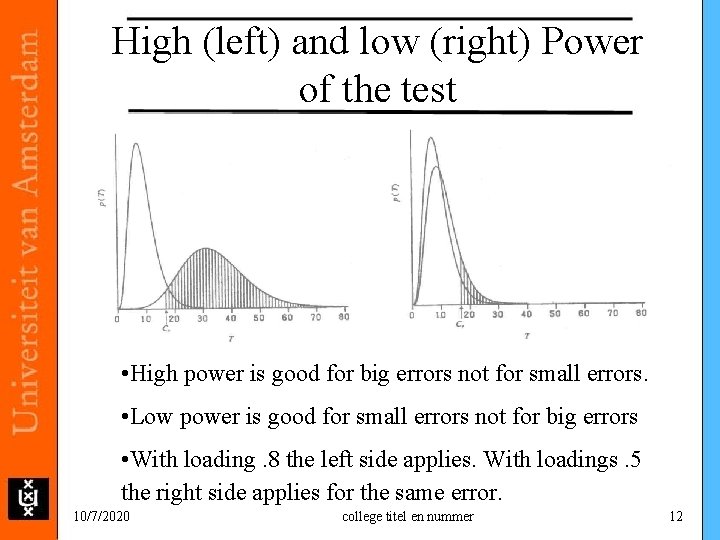
The Central and noncentral chi 2 distribution and the power 10/7/2020 college titel en nummer 9
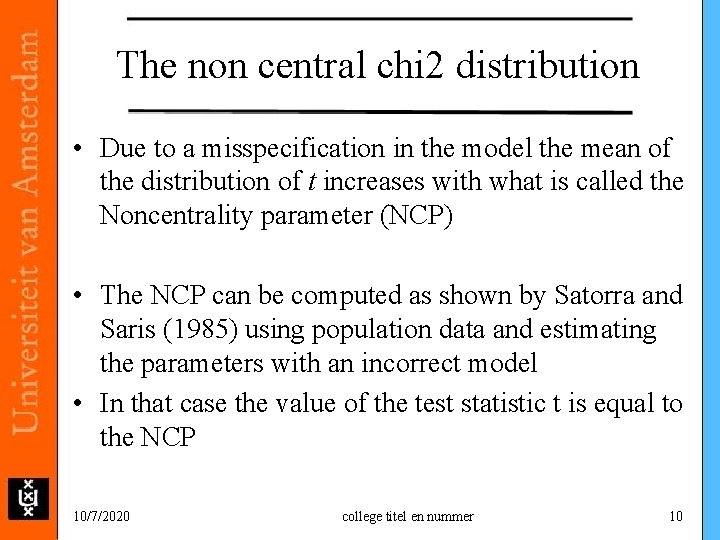
The non central chi 2 distribution • Due to a misspecification in the model the mean of the distribution of t increases with what is called the Noncentrality parameter (NCP) • The NCP can be computed as shown by Satorra and Saris (1985) using population data and estimating the parameters with an incorrect model • In that case the value of the test statistic t is equal to the NCP 10/7/2020 college titel en nummer 10
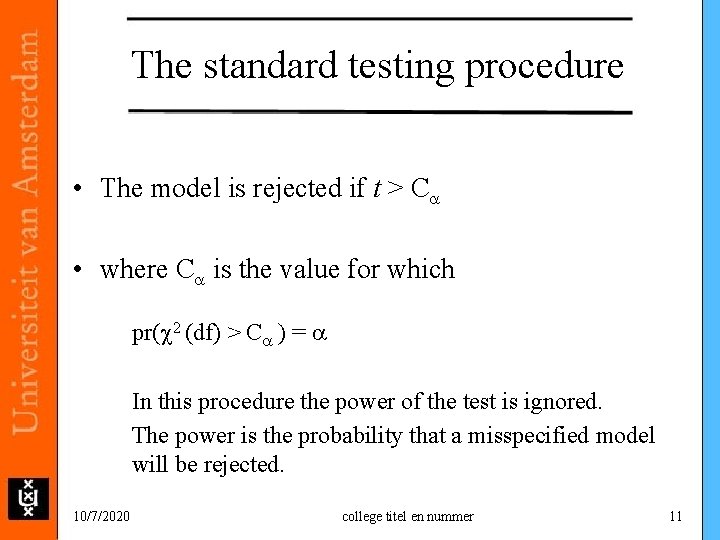
The standard testing procedure • The model is rejected if t > Ca • where Ca is the value for which pr( 2 (df) > Ca ) = a In this procedure the power of the test is ignored. The power is the probability that a misspecified model will be rejected. 10/7/2020 college titel en nummer 11
High (left) and low (right) Power of the test • • High power is good for big errors not for small errors. • Low power is good for small errors not for big errors • With loading. 8 the left side applies. With loadings. 5 the right side applies for the same error. 10/7/2020 college titel en nummer 12
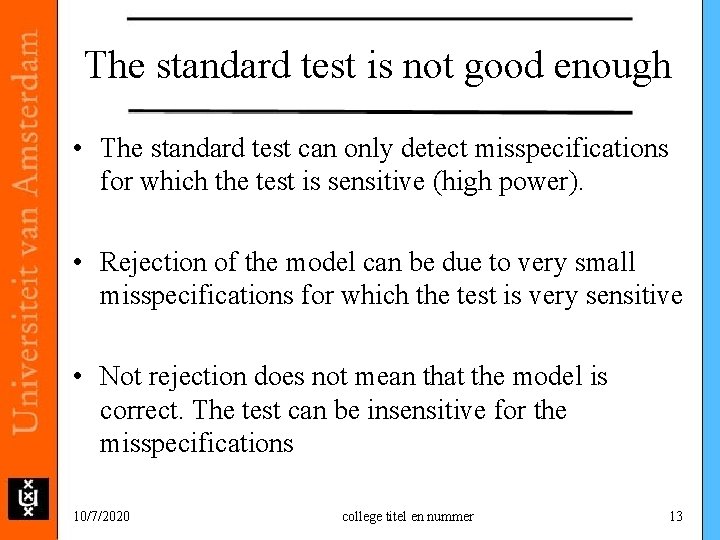
The standard test is not good enough • The standard test can only detect misspecifications for which the test is sensitive (high power). • Rejection of the model can be due to very small misspecifications for which the test is very sensitive • Not rejection does not mean that the model is correct. The test can be insensitive for the misspecifications 10/7/2020 college titel en nummer 13
Testing requires information about the power of the test. • We have suggested the following procedure High power T>Ca ? T<Ca Accepted 10/7/2020 low power Rejection ? college titel en nummer 14
The power of the test • The power of the test can be determined on the basis of the value of the NCP, degrees of freedom and the a level of the test used. • There are tables for the power of the test (see Saris and Stronkhorst (pages 308 -314) • There also programs on the internet for this purpose. • In general the amount of work is considerable to determine the power. • Therefore this procedure is not often used. Alternative procedures have been developed 10/7/2020 college titel en nummer 15
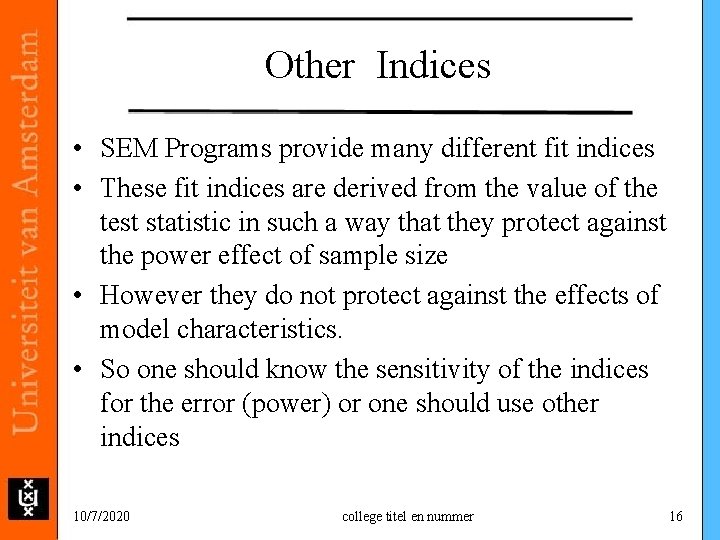
Other Indices • SEM Programs provide many different fit indices • These fit indices are derived from the value of the test statistic in such a way that they protect against the power effect of sample size • However they do not protect against the effects of model characteristics. • So one should know the sensitivity of the indices for the error (power) or one should use other indices 10/7/2020 college titel en nummer 16
Why do these procedures can not be used ? • The test statistic and dit indices are not only affected by the size of the misspecification but also by other characteristics of the model and data: • Sample size • Number of indicators • Explained variance • Incidental parameters unrelated with the misspecification 10/7/2020 college titel en nummer 17
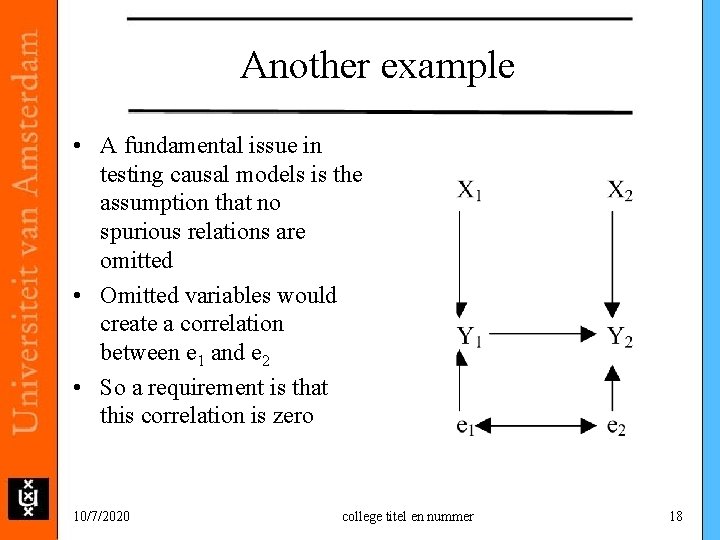
Another example • A fundamental issue in testing causal models is the assumption that no spurious relations are omitted • Omitted variables would create a correlation between e 1 and e 2 • So a requirement is that this correlation is zero 10/7/2020 college titel en nummer 18
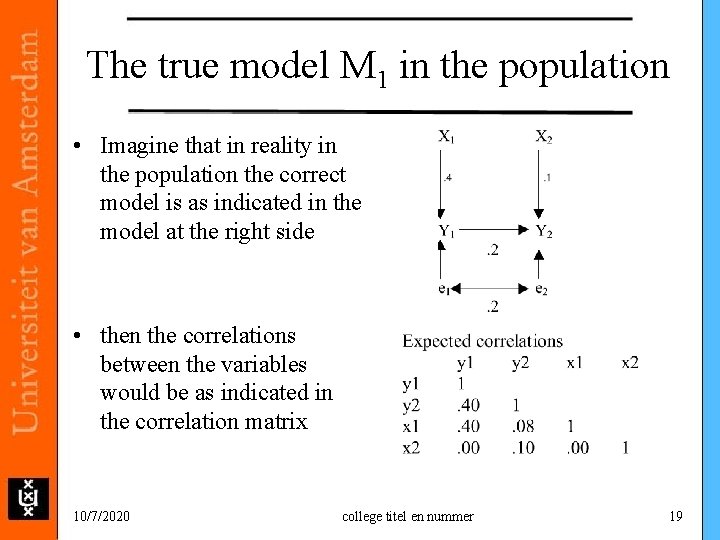
The true model M 1 in the population • Imagine that in reality in the population the correct model is as indicated in the model at the right side • then the correlations between the variables would be as indicated in the correlation matrix 10/7/2020 college titel en nummer 19
Estimates with a misspecified model M 0 • This model is misspecified because the spurious relation is omitted • The result is that the effect of Y 1 on Y 2 is estimated to be. 4 in stead of. 2 • It will be clear that it would be very important to detect this misspecification 10/7/2020 college titel en nummer 20
Test statistics • In the population data we only change one coefficient: the effect of X 2 on Y 2 • We start with the value. 1 and add each time. 1 to its value • We compute the new correlation matrix and estimate the effects and the test statistics • Note that the misspecification remains the same • The test statistics should indicate that the model is wrong in all cases 10/7/2020 college titel en nummer 21
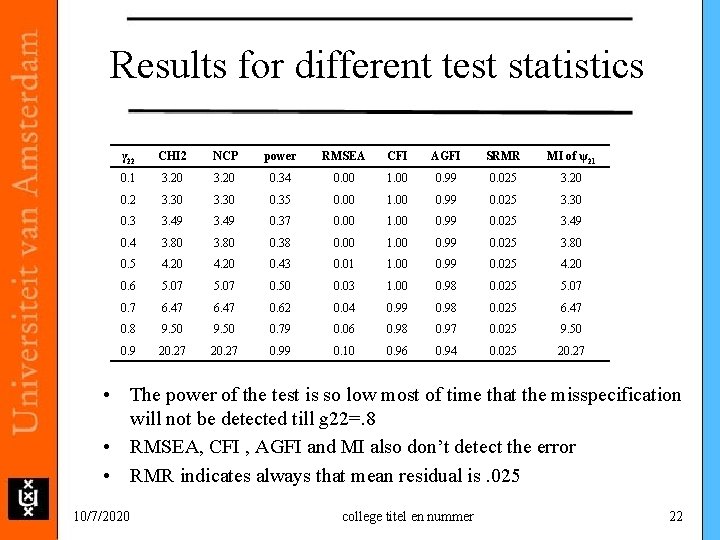
Results for different test statistics γ 22 CHI 2 NCP power RMSEA CFI AGFI SRMR MI of ψ21 0. 1 3. 20 0. 34 0. 00 1. 00 0. 99 0. 025 3. 20 0. 2 3. 30 0. 35 0. 00 1. 00 0. 99 0. 025 3. 30 0. 3 3. 49 0. 37 0. 00 1. 00 0. 99 0. 025 3. 49 0. 4 3. 80 0. 38 0. 00 1. 00 0. 99 0. 025 3. 80 0. 5 4. 20 0. 43 0. 01 1. 00 0. 99 0. 025 4. 20 0. 6 5. 07 0. 50 0. 03 1. 00 0. 98 0. 025 5. 07 0. 7 6. 47 0. 62 0. 04 0. 99 0. 98 0. 025 6. 47 0. 8 9. 50 0. 79 0. 06 0. 98 0. 97 0. 025 9. 50 0. 9 20. 27 0. 99 0. 10 0. 96 0. 94 0. 025 20. 27 • The power of the test is so low most of time that the misspecification will not be detected till g 22=. 8 • RMSEA, CFI , AGFI and MI also don’t detect the error • RMR indicates always that mean residual is. 025 10/7/2020 college titel en nummer 22
Alternative approach • Testing whether a model fits the data can also be done by testing whether the model contains misspecifications • If a misspecification is present the model has to be rejected • This information can be obtained by looking at the EPC and its test statistic MI • This can not be done without taking into account the power of the test 10/7/2020 college titel en nummer 23
EPC and MI • The Expected Parameter Change (EPC) gives the change in the parameter if estimated. If this value is large one can consider to reject the model • The Modification index indicates the reduction in chi 2 if a specific parameter is estimated. • The value of MI can also be used as chi 2 test with df=1 for the significance of the deviation from zero of the EPC. 10/7/2020 college titel en nummer 24
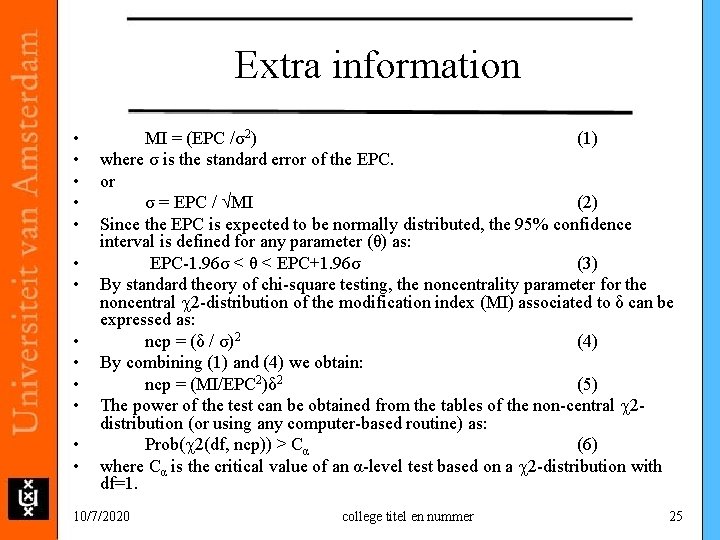
Extra information • • • • MI = (EPC /σ2) (1) where σ is the standard error of the EPC. or σ = EPC / MI (2) Since the EPC is expected to be normally distributed, the 95% confidence interval is defined for any parameter (θ) as: EPC-1. 96σ < θ < EPC+1. 96σ (3) By standard theory of chi-square testing, the noncentrality parameter for the noncentral 2 -distribution of the modification index (MI) associated to δ can be expressed as: ncp = (δ / σ)2 (4) By combining (1) and (4) we obtain: ncp = (MI/EPC 2)δ 2 (5) The power of the test can be obtained from the tables of the non-central 2 distribution (or using any computer-based routine) as: Prob( 2(df, ncp)) > Cα (6) where Cα is the critical value of an α-level test based on a 2 -distribution with df=1. 10/7/2020 college titel en nummer 25
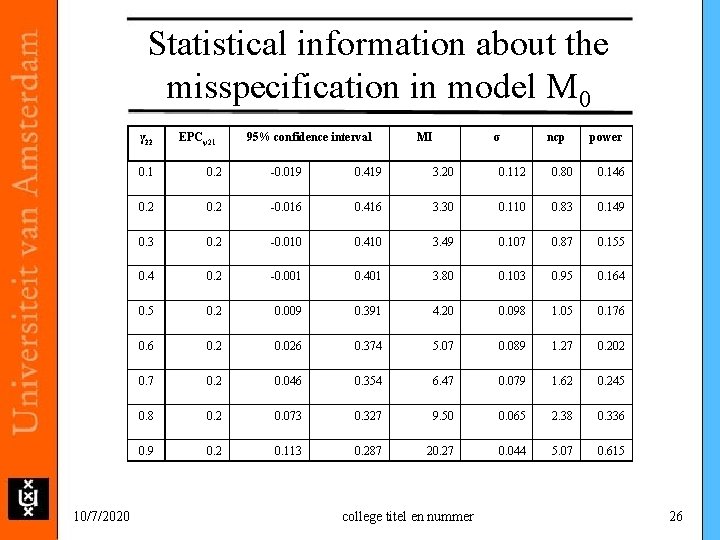
Statistical information about the misspecification in model M 0 γ 22 10/7/2020 EPCψ21 95% confidence interval MI σ ncp power 0. 1 0. 2 -0. 019 0. 419 3. 20 0. 112 0. 80 0. 146 0. 2 -0. 016 0. 416 3. 30 0. 110 0. 83 0. 149 0. 3 0. 2 -0. 010 0. 410 3. 49 0. 107 0. 87 0. 155 0. 4 0. 2 -0. 001 0. 401 3. 80 0. 103 0. 95 0. 164 0. 5 0. 2 0. 009 0. 391 4. 20 0. 098 1. 05 0. 176 0. 2 0. 026 0. 374 5. 07 0. 089 1. 27 0. 202 0. 7 0. 2 0. 046 0. 354 6. 47 0. 079 1. 62 0. 245 0. 8 0. 2 0. 073 0. 327 9. 50 0. 065 2. 38 0. 336 0. 9 0. 2 0. 113 0. 287 20. 27 0. 044 5. 07 0. 615 college titel en nummer 26
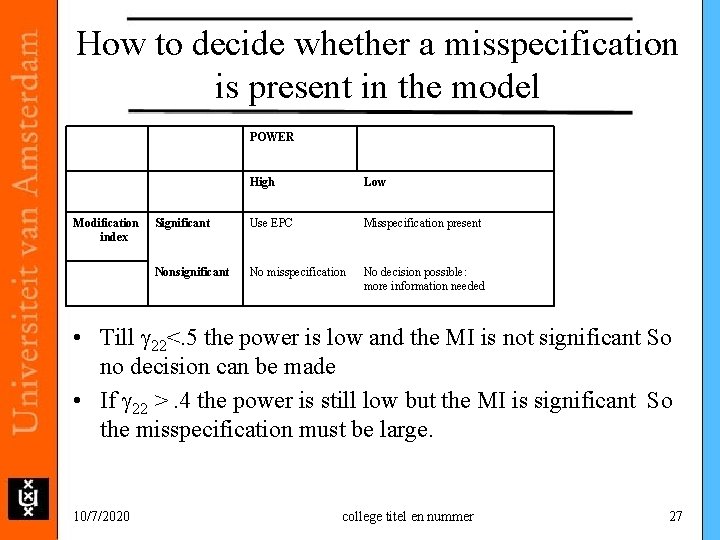
How to decide whether a misspecification is present in the model POWER Modification index High Low Significant Use EPC Misspecification present Nonsignificant No misspecification No decision possible: more information needed • Till g 22<. 5 the power is low and the MI is not significant So no decision can be made • If g 22 >. 4 the power is still low but the MI is significant So the misspecification must be large. 10/7/2020 college titel en nummer 27
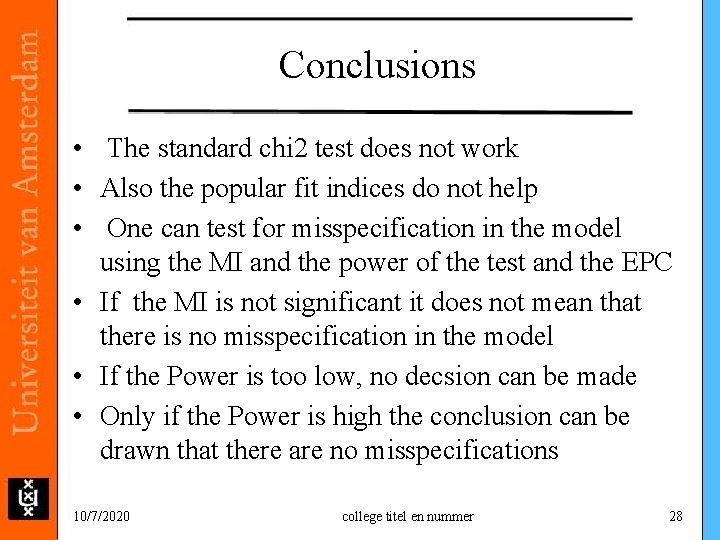
Conclusions • The standard chi 2 test does not work • Also the popular fit indices do not help • One can test for misspecification in the model using the MI and the power of the test and the EPC • If the MI is not significant it does not mean that there is no misspecification in the model • If the Power is too low, no decsion can be made • Only if the Power is high the conclusion can be drawn that there are no misspecifications 10/7/2020 college titel en nummer 28
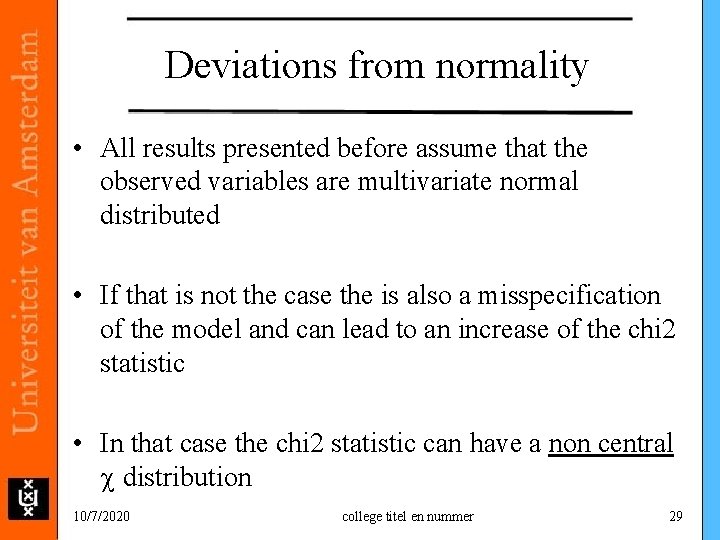
Deviations from normality • All results presented before assume that the observed variables are multivariate normal distributed • If that is not the case the is also a misspecification of the model and can lead to an increase of the chi 2 statistic • In that case the chi 2 statistic can have a non central distribution 10/7/2020 college titel en nummer 29
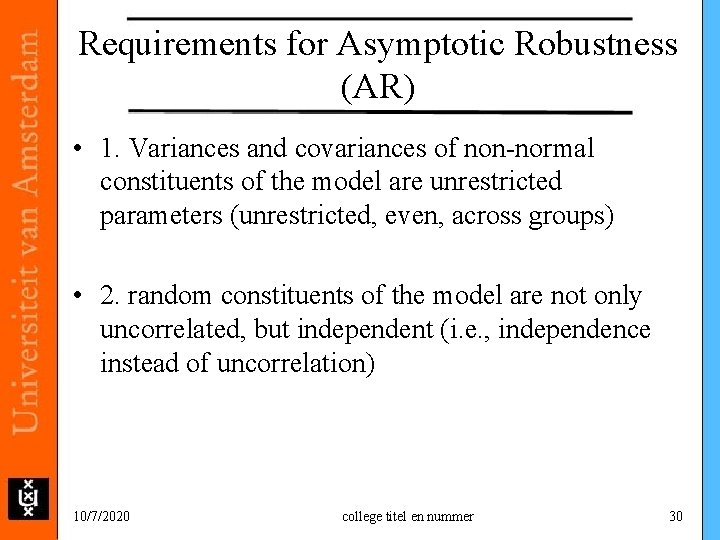
Requirements for Asymptotic Robustness (AR) • 1. Variances and covariances of non-normal constituents of the model are unrestricted parameters (unrestricted, even, across groups) • 2. random constituents of the model are not only uncorrelated, but independent (i. e. , independence instead of uncorrelation) 10/7/2020 college titel en nummer 30
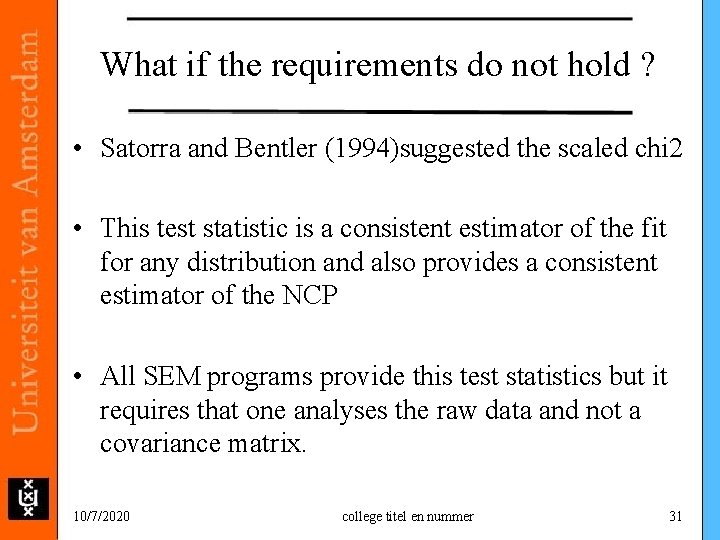
What if the requirements do not hold ? • Satorra and Bentler (1994)suggested the scaled chi 2 • This test statistic is a consistent estimator of the fit for any distribution and also provides a consistent estimator of the NCP • All SEM programs provide this test statistics but it requires that one analyses the raw data and not a covariance matrix. 10/7/2020 college titel en nummer 31
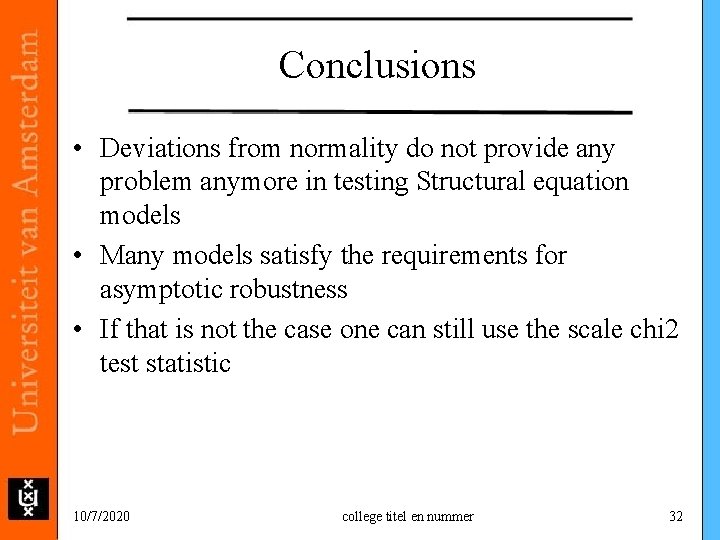
Conclusions • Deviations from normality do not provide any problem anymore in testing Structural equation models • Many models satisfy the requirements for asymptotic robustness • If that is not the case one can still use the scale chi 2 test statistic 10/7/2020 college titel en nummer 32