Terrain Analysis Slope Landslide susceptibility Aspect Solar insolation
 • Aspect (Solar insolation, vegetation) • Catchment or")
Terrain Analysis • Slope (Landslide susceptibility) • Aspect (Solar insolation, vegetation) • Catchment or dispersal area (Runoff volume, soil drainage) • Flow path (Distance of water flow to point) • Profiles, fence diagrams • Viewshed (visibility)

Slope and Aspect • measured from an elevation or bathymetry raster – compare elevations of points in a 3 x 3 neighborhood – slope and aspect at one point estimated from its elevation and that of surrounding 8 points • number points row by row, from top left from 1 to 9 1 2 3 4 5 6 7 8 9

Typical Slope Calculation • b = (z 3 + 2 z 6 + z 9 - z 1 - 2 z 4 - z 7) / 8 D • c = (z 1 + 2 z 2 + z 3 - z 7 - 2 z 8 - z 9) / 8 D – b denotes slope in the x direction – c denotes slope in the y direction – D is the spacing of points (30 m) • find the slope that fits best to the 9 elevations • minimizes the total of squared differences between point elevation and the fitted slope 2 3 • weighting four closer neighbors higher 1 • tan (slope) = sqrt (b 2 + c 2) 4 5 6 7 8 9

Slope Definitions • • Slope defined as an angle … or rise over horizontal run … or rise over actual run various methods – important to know how your favorite GIS calculates slope
")
Slope Definitions (cont. )
 = b/c 1 2 3 4 5 6 7 8")
Aspect • tan (aspect) = b/c 1 2 3 4 5 6 7 8 9 – b denotes slope in the x direction – c denotes slope in the y direction • Angle between vertical and direction of steepest slope • Measured clockwise • add 180 to aspect if c is positive, 360 to aspect if c is negative and b is positive
 • Slope (Landslide susceptibility) •")
Terrain Analysis • Indices (e. g. , TPI/BPI, rugosity) • Slope (Landslide susceptibility) • Aspect (Solar insolation, vegetation) • Catchment or dispersal area (Runoff volume, soil drainage) • Flow path (Distance of water flow to point) • Profiles, fence diagrams • Viewshed (visibility)

Benthic Terrain Modeler Dawn Wright Emily Lundblad*, Emily Larkin^, Ron Rinehart Dept. of Geosciences, Oregon State University Josh Murphy, Lori Cary-Kothera, Kyle Draganov NOAA Coastal Services Center GIS Training for Marine Resource Management Monterey, CA Photo by

Maps courtesy of National Park of American Samoa

Artwork by Jayne Doucette, Woods Hole Oceanographic Institution

By former Or. St grad student Emily Larkin

FBNMS: Some Major Issues • Natural & human impacts – Crown-of-thorns invasion, hurricanes, bleaching – Illegal fishing, sewage outfall Photos courtesy of NOAA National Marine Sanctuary System

Or. St & USF Earliest Multibeam Surveys By Or. St grad student Emily Lundblad

Completed by NOAA CRED By Or. St grad student Kyle Hogrefe

Benthic Habitat Pilot Area, DMWR

Fagatele Bay National Marine Sanctuary, 2001 bathy

Bathymetric Position Index (from TPI, Jones et al. , 2000; Weiss, 2001; Iampietro & Kvitek, 2002) Measure of where a point is in the overall land- or “seascape” Compares elevation of cell to mean elevation of neighborhood (after Weiss 2001)
) +. 5) Algorithm")
Bathymetric Position Index bpi<scalefactor> = int((bathy - focalmean(bathy, annulus, irad, orad)) +. 5) Algorithm compares each cell’s elevation to the mean elevation of the surrounding cells in an annulus or ring. resolution = 3 m irad = 2 cells (6 m) |---2 ---||-----4 -------| orad = 4 cells (12 m) scalefactor = resolution * orad = 36 m • Negative bpi = depression • Positive bpi = crest • Zero bpi = constant slope or flat -3 m-

Broadscale Zones from BPI A surficial characteristic of the seafloor based on a bathymetric position index value range at a broad scale & slope values. (1) Crests (3) Flats (2) Depressions (4) Slopes if (B-BPI >= 100) out_zones = 1 else if (B-BPI > -100 and B-BPI < 100 and slope <= gentle) out_zones = 3

Finescale Structures from BPI A surficial characteristic of the seafloor based on a BPI value range at a combined fine scale & broad scale, slope & depth 1. Narrow depression 8. Open slopes 2. Local depression on flat 9. Local crest in depression 3. Lateral midslope depression 10. Local crest on flat 4. Depression on crest 11. Lateral midslope crest 5. Broad depression with an open bottom 12. Narrow crest 6. Broad flat 7. Shelf 13. Steep slope

BPI Zone and Structure Classification Flowchart Emily Lundblad, Or. St M. S. Thesis

Structure Classification Decision Tree Emily Lundblad, Or. St M. S. Thesis

Emily Lundblad, Or. St M. S. Thesis

Fish Abundance & BPI Courtesy of Pat Iampietro, CSU-MB, ESRI UC 2003

2005 HURL Sub & ROV surveys Ka‘imikai-o-Kanaloa Pisces IV or V RCV-150

Rugosity • Measure of how rough or bumpy a surface is, how convoluted and complex • Ratio of surface area to planar area Surface area based on elevations of 8 neighbors 3 D view of grid on the left Portions of 8 triangles overlapping center cell used for surface area Graphics courtesy of Jeff Jenness, Jenness Enterprises, and Pat Iampietro, CSU-MB Center pts of 9 cells connected To make 8 triangles

Emily Lundblad, Or. St M. S. Thesis

BTM Methodology Step One Step Two Step Three Step Four Classification Dictionary Benthic Terrain Slope Bathymetry + Fine BPI + Broad BPI

Classification Wizard

Help Pages

Standardization Over Multiple Areas

Classification Dictionary

Classification Dictionary

Classification Dictionary

Use of Terrain Analysis Tools • Look at version # (e. g. , v. 1. 0, and all that implies!) • Careful study of your own data – BPI scale factors – Fledermaus Viz and Profile Control helped in conjunction • Customized classification schemes • Arc. GIS 9. x w/ latest Service Pack? • > 2. 0 GHz processor, > 1 Gb disk space

Animated Terrain Flyovers Dr. K, OSU and Aileen Buckley, ESRI

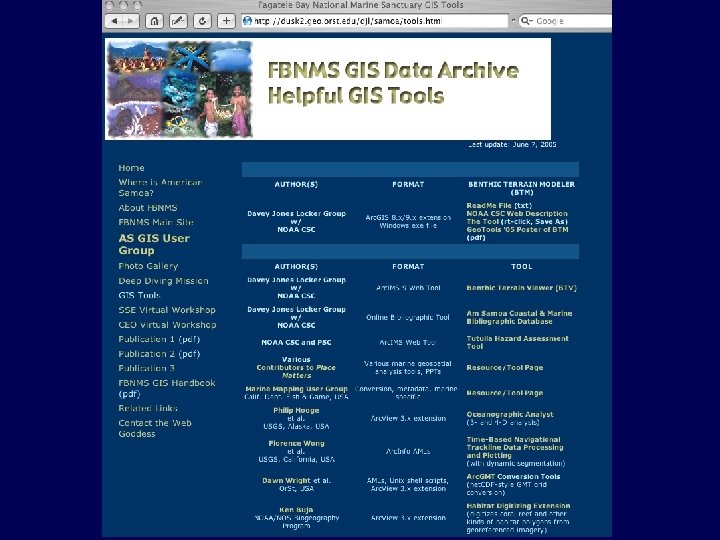
Our Tools Portal … dusk. geo. orst. edu/djl/samoa/tools. html Image courtesy of FBNMS

Other Resources • GEO 580 web site - links • GIS@OSU, “Data & Software” – www. geo. oregonstate. edu/ucgis/datasoft. html • Wilson and Gallant (ed. ), Terrain Analysis • ESRI Virtual Campus library – campus. esri. com/campus/library

Gateway to the Literature • Guisan, A. , Weiss, S. B. , Weiss, A. D. , 1999. GLM versus CCA spatial modeling of plant species distribution. Plant Ecology, 143: 107 -122. • Jenness, J. 2003. Grid Surface Areas: Surface Area and Ratios from Elevation Grids [Electronic manual]. Jenness Enterprises: Arc. View® • • Extensions. http: //www. jennessent. com/arcview_extensions. htm Jones, K. , Bruce, et al. , 2000. Assessing landscape conditions relative to water resources in the western United States: A strategic approach, Environmental Monitoring and Assessment, 64: 227 -245. Lundblad, E. , Wright, D. J. , Miller, J. , Larkin, E. M. , Rinehart, R. , Battista, T. , Anderson, S. M. , Naar, D. F. , and Donahue, B. T. , 2006. A benthic terrain classification scheme for American Samoa, Marine Geodesy, 26(2). http: //dusk. geo. orst. edu/mgd 2006_preprint. pdf Rinehart, R. , D. Wright, E. Lundblad, E. Larkin, J. Murphy, and L. Cary. Kothera, 2004. Arc. GIS 8. x Benthic Habitat Extension: Analysis in American Samoa. In Proceedings of the 24 th Annual ESRI User Conference. San Diego, CA, August 9 -13. Paper 1433. http: //dusk. geo. orst. edu/esri 04/p 1433_ron. html Weiss, Andy, 2001. Topographic Positions and Landforms Analysis (Conference Poster). ESRI International User Conference. San Diego, CA, July 9 -13.

Gateway to the Literature Wright, D. J. and Heyman, W. D. , 2008. Marine and coastal GIS for geomorphology, habitat mapping, and marine reserves, Marine Geodesy, 31(4): 1 -8. Sappington, J. M. , Longshore, K. M. , Thompson. D. B. , 2007. Quantifying landscape ruggedness for animal habitat analysis: A case study using bighorn sheep in the Mojave Desert. J. of Wildlife Management, 71(5): 1419 -1427. Dunn, D. C. and Halpin, P. N. , 2009. Rugosity-based regional modeling of hard-bottom habitat. Marine Ecology Progress Series, 377: 1 -11. doi: 10. 3354/meps 07839 Borruso, G. , 2008. Network density estimation: A GIS approach for analysing point patterns in a network space. Transactions in GIS, 12(3): 377 -402.
- Slides: 44