
Temporal and Frequency Variations of Flares observed by
Temporal and Frequency Variations of Flares observed by LYRA onboard of PROBA 2 Joe. Zender@esa. int (1) B. Foing (1), D. Vagg(2), M. Dominique(3), I. Dammasch(3), M. Mierla(3) and the LYRA Team (1) Science and Robotic Exploration Directorate, ESA, ESTEC, Noordwijk, The Netherlands (2) Waterford University, Waterford, Ireland (3) Royal Observatory of Belgium, SIDC, Brussels, Belgium
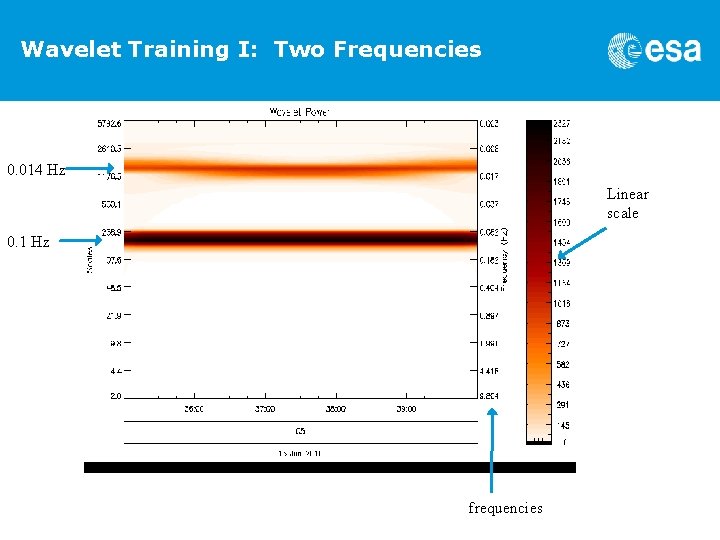
Outline Discussion of Solar activities on 15 June 2010 based on temporal and frequency analysis of Zirconium (1 -20 nm) and Aluminum (17 -80 nm) channels of the LYRA instrument flown on board of PROBA Ø INTRODUCTION TO PROBA 2 Ø INTRODUCTION TO LYRA Ø TEMPORAL ANALYSIS OF CX FLARE ON 2010 -06 -15 T Ø FREQUENCY ANALYSIS OF SAME FLARE • INTRODUCTION TO WAVELET • WAVELET ANALYSIS OF LYRA DATA • FLARE RESULTS Ø CONCLUSION AND DISCUSSION LYRA EUV channels are suitable for flare analysis in time domain. Some flares show oscillations during initial flare phase, e. g. 0. 1 Hz and 0. 014 Hz for the 2010 -06 -15 flare
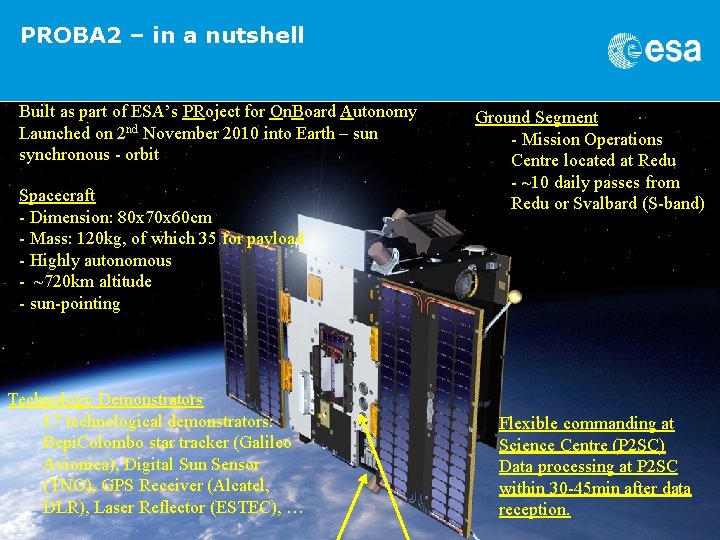
PROBA 2 – in a nutshell Built as part of ESA’s PRoject for On. Board Autonomy Launched on 2 nd November 2010 into Earth – sun synchronous - orbit Spacecraft - Dimension: 80 x 70 x 60 cm - Mass: 120 kg, of which 35 for payload - Highly autonomous - ~720 km altitude - sun-pointing Technology Demonstrators 17 technological demonstrators: Bepi. Colombo star tracker (Galileo Avionica), Digital Sun Sensor (TNO), GPS Receiver (Alcatel, DLR), Laser Reflector (ESTEC), … Ground Segment - Mission Operations Centre located at Redu - ~10 daily passes from Redu or Svalbard (S-band) Flexible commanding at Science Centre (P 2 SC) Data processing at P 2 SC within 30 -45 min after data reception.
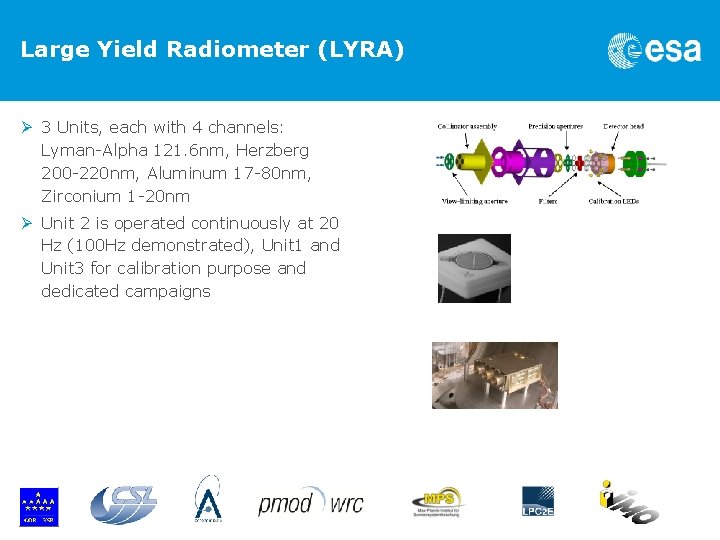
Large Yield Radiometer (LYRA) Ø 3 Units, each with 4 channels: Lyman-Alpha 121. 6 nm, Herzberg 200 -220 nm, Aluminum 17 -80 nm, Zirconium 1 -20 nm Ø Unit 2 is operated continuously at 20 Hz (100 Hz demonstrated), Unit 1 and Unit 3 for calibration purpose and dedicated campaigns
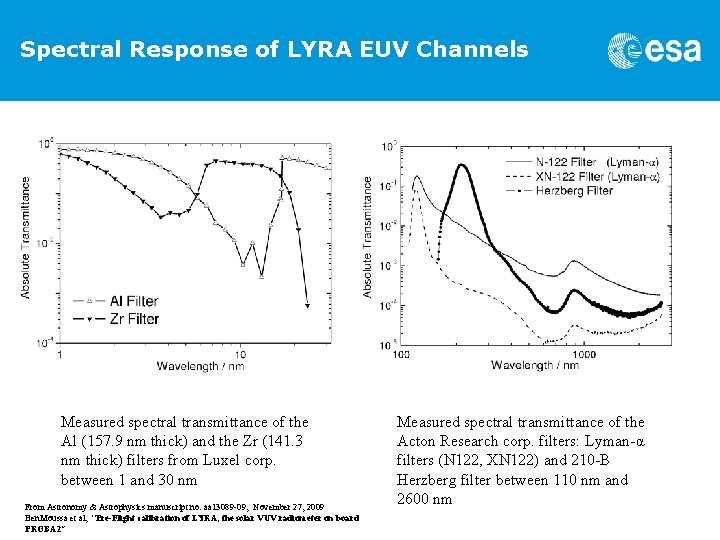
Spectral Response of LYRA EUV Channels Measured spectral transmittance of the Al (157. 9 nm thick) and the Zr (141. 3 nm thick) filters from Luxel corp. between 1 and 30 nm From Astronomy & Astrophysics manuscript no. aa 13089 -09, November 27, 2009 Ben. Moussa et al, “Pre-Flight calibration of LYRA, the solar VUV radiometer on board PROBA 2” Measured spectral transmittance of the Acton Research corp. filters: Lyman-α filters (N 122, XN 122) and 210 -B Herzberg filter between 110 nm and 2600 nm
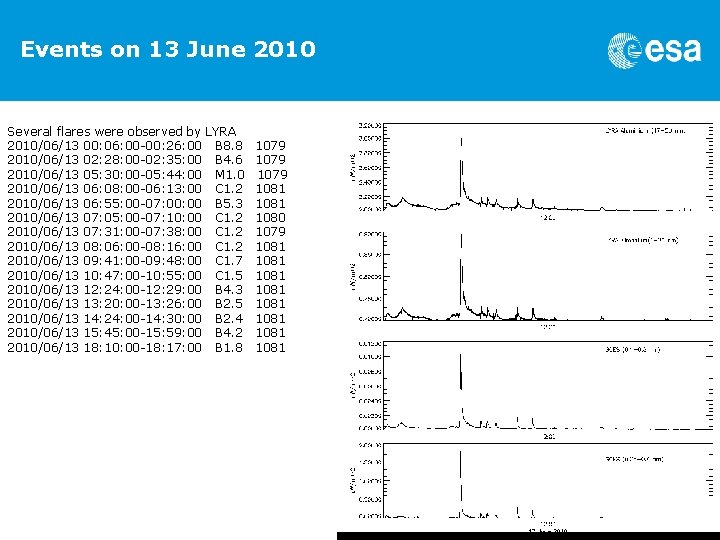
Events on 13 June 2010 Several flares were observed by LYRA 2010/06/13 00: 06: 00 -00: 26: 00 B 8. 8 2010/06/13 02: 28: 00 -02: 35: 00 B 4. 6 2010/06/13 05: 30: 00 -05: 44: 00 M 1. 0 2010/06/13 06: 08: 00 -06: 13: 00 C 1. 2 2010/06/13 06: 55: 00 -07: 00 B 5. 3 2010/06/13 07: 05: 00 -07: 10: 00 C 1. 2 2010/06/13 07: 31: 00 -07: 38: 00 C 1. 2 2010/06/13 08: 06: 00 -08: 16: 00 C 1. 2 2010/06/13 09: 41: 00 -09: 48: 00 C 1. 7 2010/06/13 10: 47: 00 -10: 55: 00 C 1. 5 2010/06/13 12: 24: 00 -12: 29: 00 B 4. 3 2010/06/13 13: 20: 00 -13: 26: 00 B 2. 5 2010/06/13 14: 24: 00 -14: 30: 00 B 2. 4 2010/06/13 15: 45: 00 -15: 59: 00 B 4. 2 2010/06/13 18: 10: 00 -18: 17: 00 B 1. 8 1079 1081 1080 1079 1081 1081
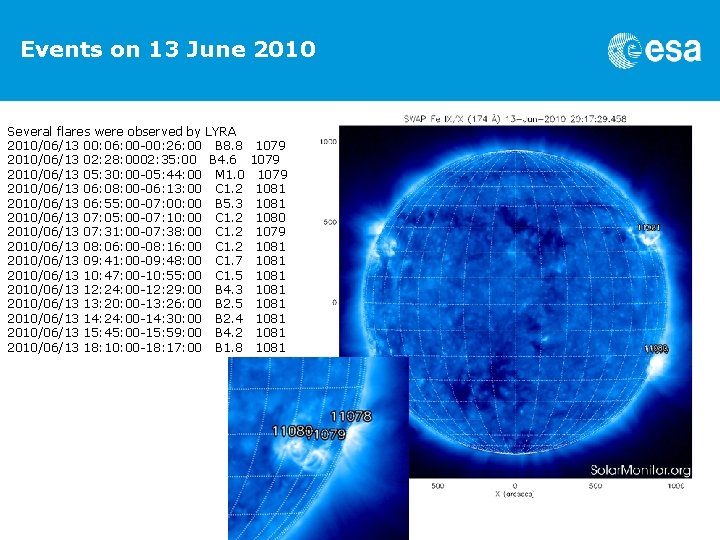
Events on 13 June 2010 Several flares were observed by LYRA 2010/06/13 00: 06: 00 -00: 26: 00 B 8. 8 2010/06/13 02: 28: 0002: 35: 00 B 4. 6 2010/06/13 05: 30: 00 -05: 44: 00 M 1. 0 2010/06/13 06: 08: 00 -06: 13: 00 C 1. 2 2010/06/13 06: 55: 00 -07: 00 B 5. 3 2010/06/13 07: 05: 00 -07: 10: 00 C 1. 2 2010/06/13 07: 31: 00 -07: 38: 00 C 1. 2 2010/06/13 08: 06: 00 -08: 16: 00 C 1. 2 2010/06/13 09: 41: 00 -09: 48: 00 C 1. 7 2010/06/13 10: 47: 00 -10: 55: 00 C 1. 5 2010/06/13 12: 24: 00 -12: 29: 00 B 4. 3 2010/06/13 13: 20: 00 -13: 26: 00 B 2. 5 2010/06/13 14: 24: 00 -14: 30: 00 B 2. 4 2010/06/13 15: 45: 00 -15: 59: 00 B 4. 2 2010/06/13 18: 10: 00 -18: 17: 00 B 1. 8 1079 1081 1080 1079 1081 1081
Events on 13 June 2010 - Movie
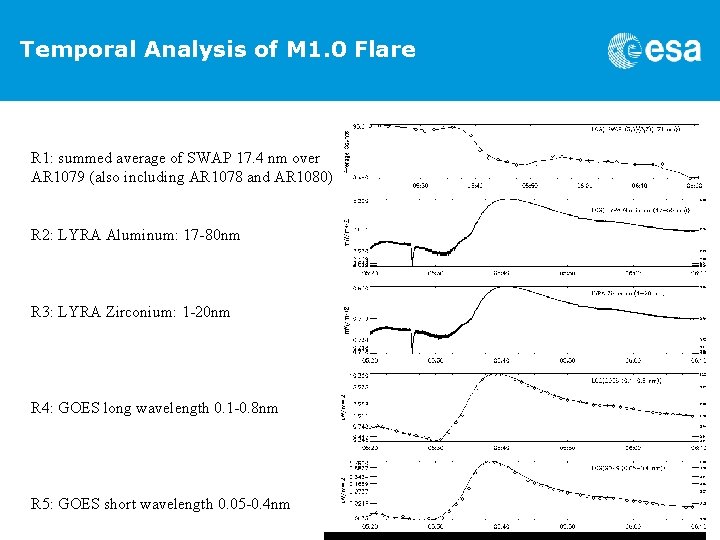
Temporal Analysis of M 1. 0 Flare R 1: summed average of SWAP 17. 4 nm over AR 1079 (also including AR 1078 and AR 1080) R 2: LYRA Aluminum: 17 -80 nm R 3: LYRA Zirconium: 1 -20 nm R 4: GOES long wavelength 0. 1 -0. 8 nm R 5: GOES short wavelength 0. 05 -0. 4 nm
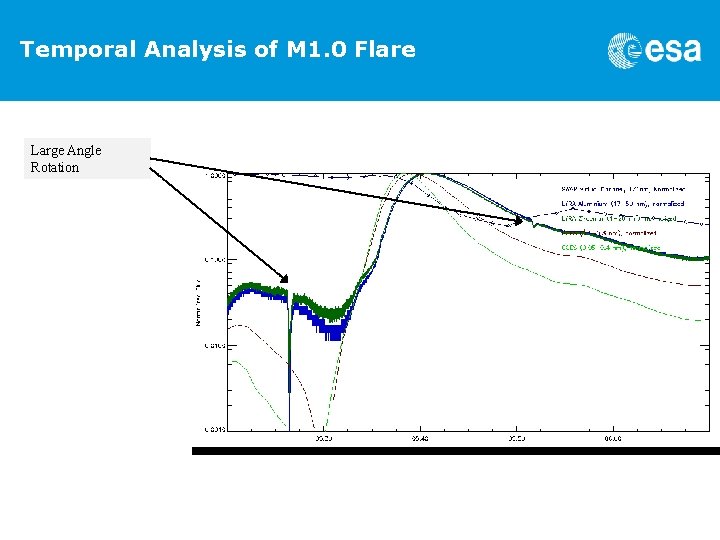
Temporal Analysis of M 1. 0 Flare Large Angle Rotation
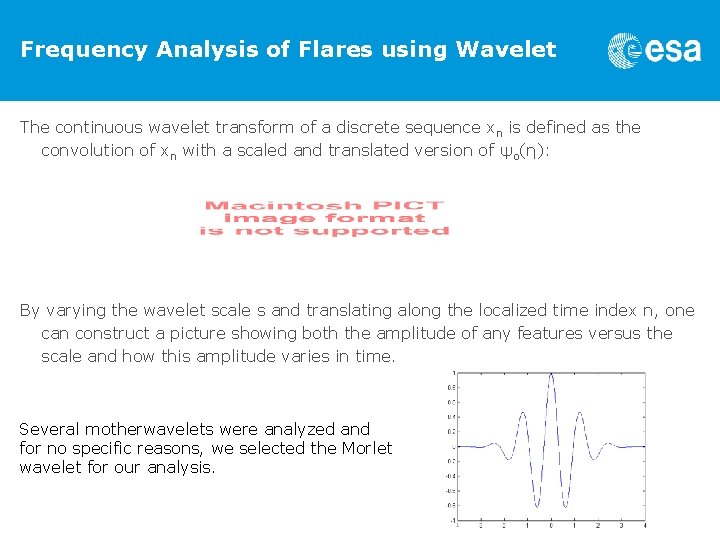
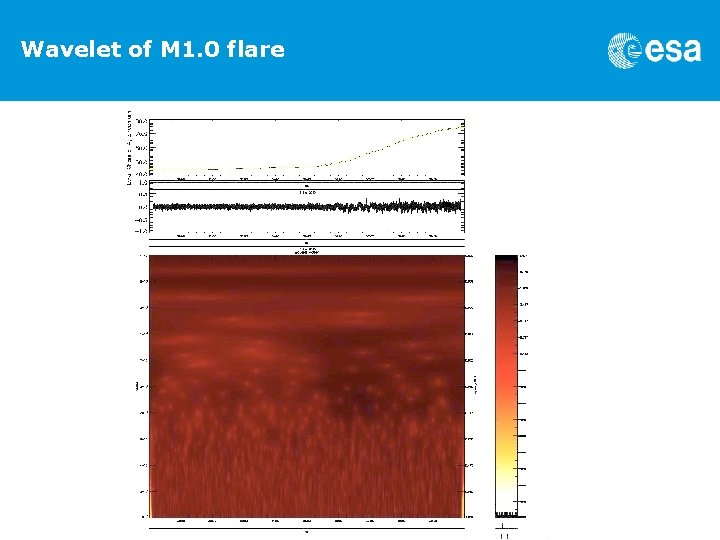
Frequency Analysis of Flares using Wavelet The continuous wavelet transform of a discrete sequence xn is defined as the convolution of xn with a scaled and translated version of ψo(η): By varying the wavelet scale s and translating along the localized time index n, one can construct a picture showing both the amplitude of any features versus the scale and how this amplitude varies in time. Several motherwavelets were analyzed and for no specific reasons, we selected the Morlet wavelet for our analysis.
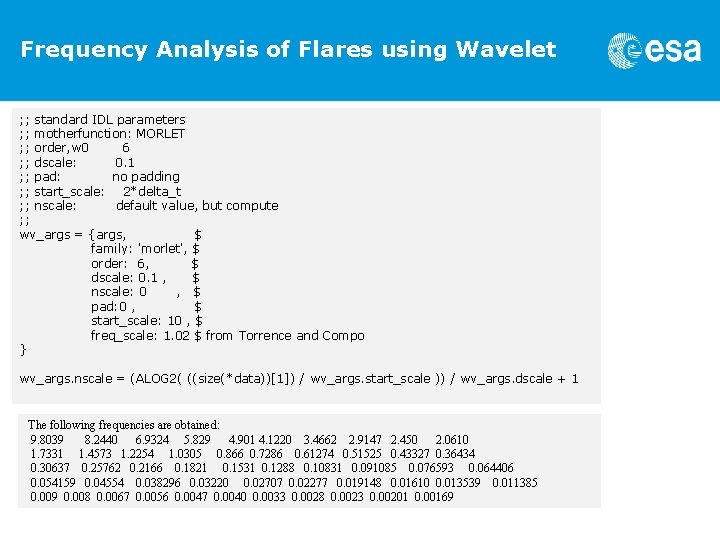
Frequency Analysis of Flares using Wavelet ; ; standard IDL parameters ; ; motherfunction: MORLET ; ; order, w 0 6 ; ; dscale: 0. 1 ; ; pad: no padding ; ; start_scale: 2*delta_t ; ; nscale: default value, but compute ; ; wv_args = {args, $ family: 'morlet', $ order: 6, $ dscale: 0. 1 , $ nscale: 0 , $ pad: 0 , $ start_scale: 10 , $ freq_scale: 1. 02 $ from Torrence and Compo } wv_args. nscale = (ALOG 2( ((size(*data))[1]) / wv_args. start_scale )) / wv_args. dscale + 1 The following frequencies are obtained: 9. 8039 8. 2440 6. 9324 5. 829 4. 901 4. 1220 3. 4662 2. 9147 2. 450 2. 0610 1. 7331 1. 4573 1. 2254 1. 0305 0. 866 0. 7286 0. 61274 0. 51525 0. 43327 0. 36434 0. 30637 0. 25762 0. 2166 0. 1821 0. 1531 0. 1288 0. 10831 0. 091085 0. 076593 0. 064406 0. 054159 0. 04554 0. 038296 0. 03220 0. 02707 0. 02277 0. 019148 0. 01610 0. 013539 0. 011385 0. 009 0. 008 0. 0067 0. 0056 0. 0047 0. 0040 0. 0033 0. 0028 0. 0023 0. 00201 0. 00169
Frequency Analysis of Flares using Wavelet Ø Processing time is long. All the following plots have been based on 10 minutes intervals. Ø Scales on all following plots are all identical: xrange=10 minutes Ø Uncertainty area not yet determined
Wavelet of M 1. 0 flare
Wavelet Training I: Two Frequencies 0. 014 Hz Linear scale 0. 1 Hz frequencies
Wavelet Training II: noise Z-axis plotted in linear scale Z-axis plotted in log 10 scale
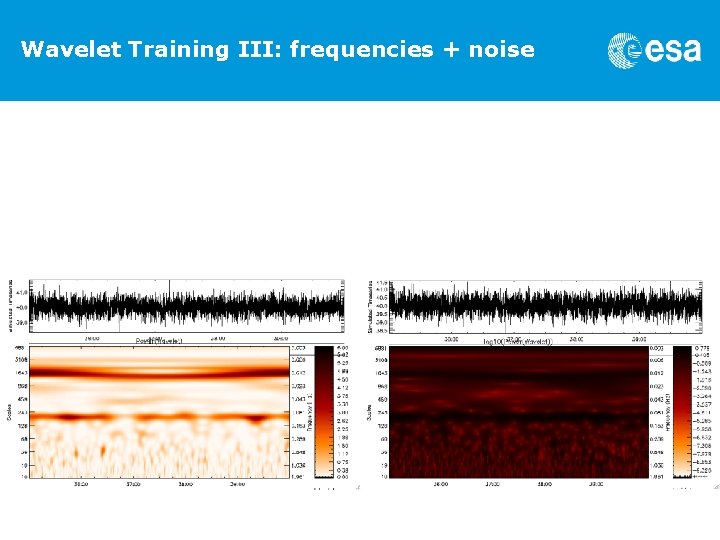
Wavelet Training III: frequencies + noise
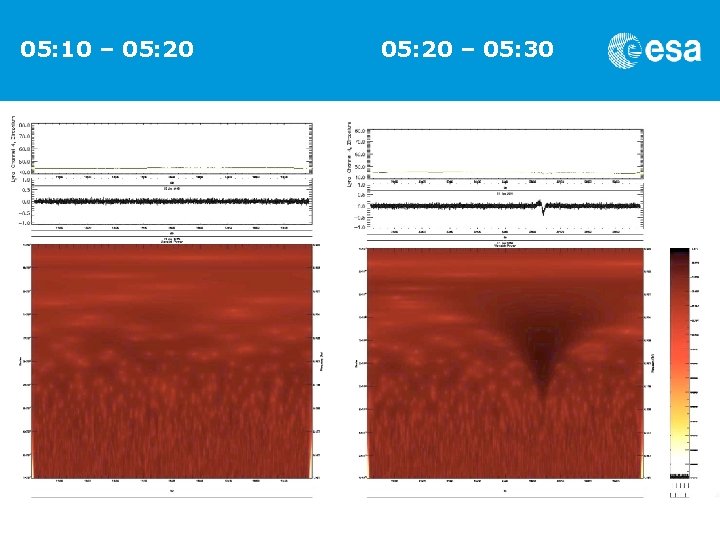
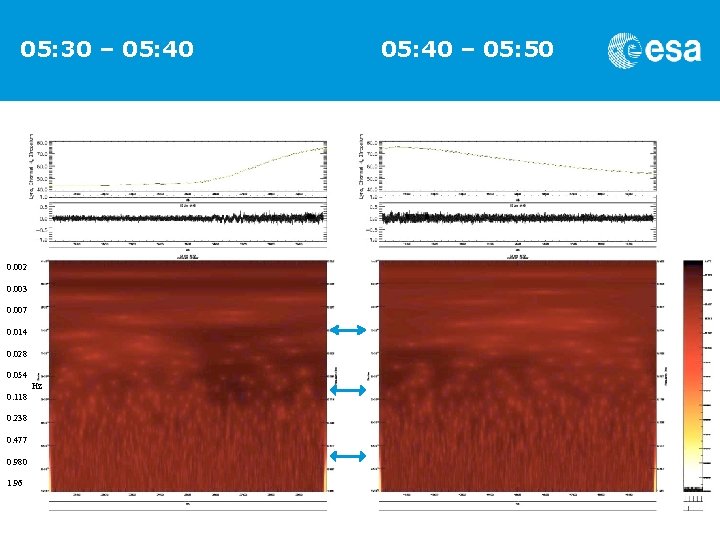
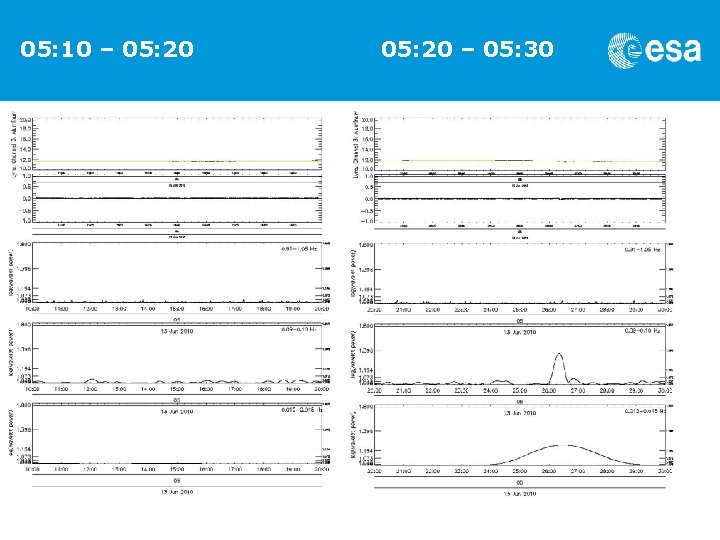
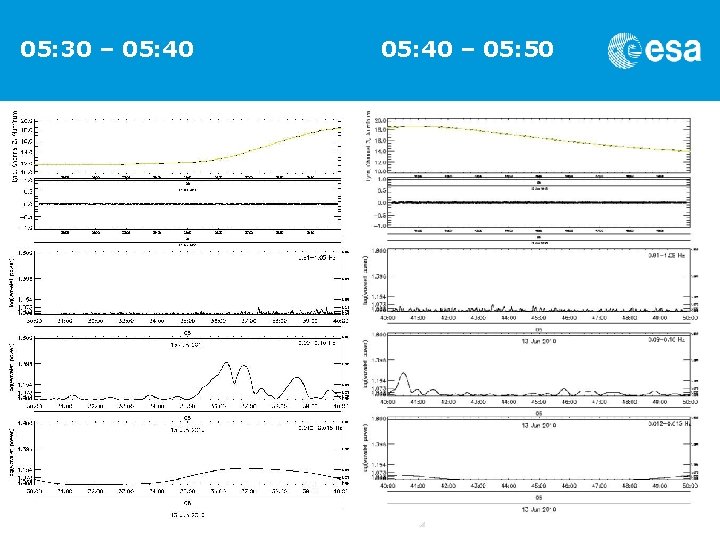
Frequency Analysis of M 1. 0 Flare using Wavelet Analysis Plots in 10 minutes interval 05: 10 – 05: 20 – 05: 30 – 05: 40 – 05: 50 All x-scales and y-scales and z-scales are identical over the plots.
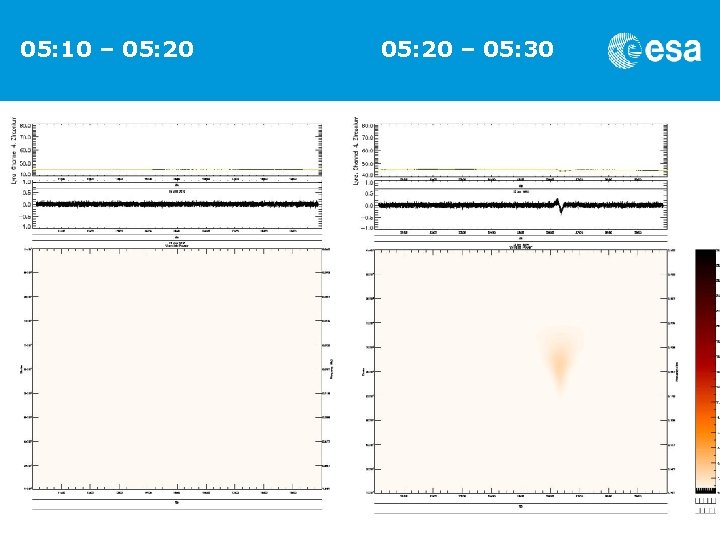
05: 10 – 05: 20 – 05: 30
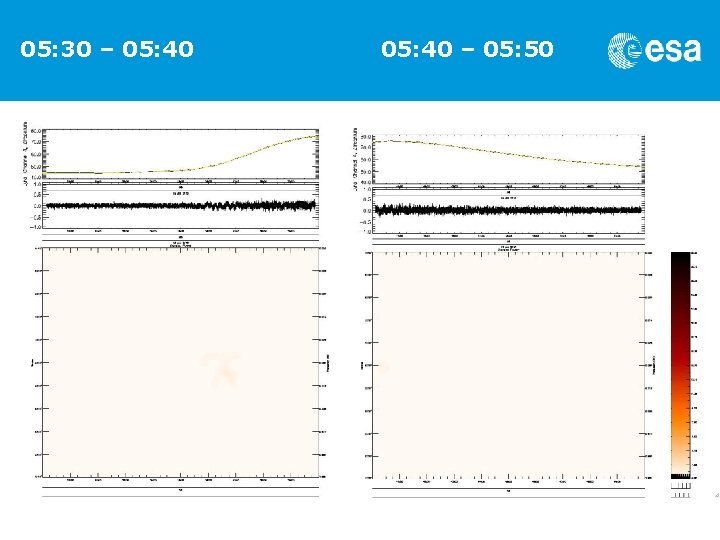
05: 30 – 05: 40 – 05: 50
05: 10 – 05: 20 – 05: 30
05: 30 – 05: 40 0. 002 0. 003 0. 007 0. 014 0. 028 0. 054 Hz 0. 118 0. 238 0. 477 0. 980 1. 96 05: 40 – 05: 50
05: 10 – 05: 20 – 05: 30
05: 30 – 05: 40 – 05: 50
Conclusion Ø LYRA EUV channel time series (Zirconium, Aluminum) suitable for analysis of solar events Ø Frequency analysis • No frequencies components/oscillations higher than 0. 1/0. 2 Hz found so far, but can not be excluded -> more analysis needed • Oscillations found at 0. 1 Hz and 0. 014 Hz – No indication that these components could be caused by instrumental or spacecraft effects – Components detected for other flares, but are very seldom – For the observed flare, there were 3 active regions near the limb, so it can not be excluded that the oscillations are caused by superposition of several events – It’s likely however that the observed oscillations are caused by – Geometry: e. g. energy released in different directions and these are seen as oscillations – Energy: e. g. physical processes at chromosphere – Energy: e. g. energy loss during electron and ion evolution through corona
Next Steps Ø More systematic analysis • Production of wavelet space as data product • Processing using grid technology • Further development of analysis tools Ø Combine with modeling efforts Any comments, suggestions and discussions are welcome. I am happy to share results and software with you.
- Slides: 26