TEF Lessons for Members and Citizens Lesson 3

TEF Lessons for Members and Citizens Lesson 3 The American Dream vs. The American Reality 3– 1

Objective: Participants examine who benefits and who loses from the current economic structure and how these unequal benefits impact education funding. 3– 2
 Respect and value differences")
As a group can we agree that we will: 1) Respect and value differences of opinions and varying levels of knowledge. 2) Be fully attentive. 3– 3

The American Dream vs. The Reality • Work hard • Many people who work hard are still poor and get ahead 3 -4

In today’s economy, when educators are experiencing: • • Cut backs on education funding, Combined with growing class sizes, A high-stakes testing environment, And an increasing number of lowersocioeconomic students, It’s time to ask the WHY and HOW Questions. 3 -5

With America’s Resources: • WHY are we in this mess? • HOW did we get here? • HOW does it impact education funding and student achievement? • HOW can we get out of this mess A quick history lesson will aid our thinking…. 3 -6

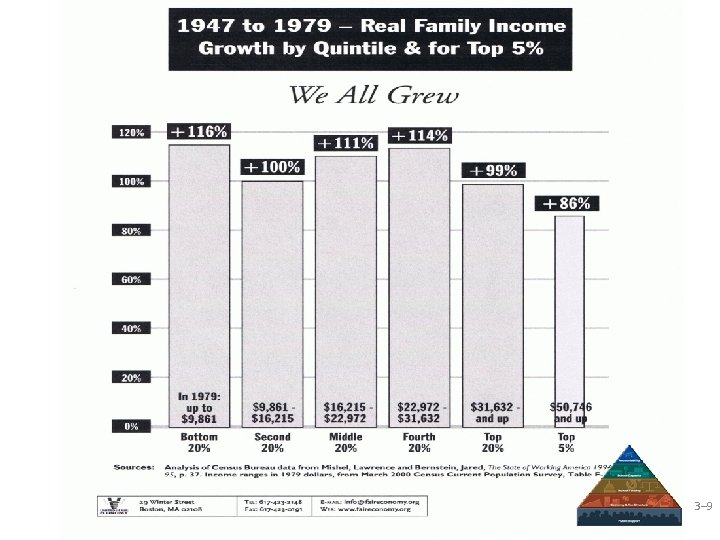
Let’s examine income growth for different income groups over 2 time periods of U. S. economic prosperity. 3– 7

THE HUMAN BAR GRAPH 1947 -1979 3 -8

THE HUMAN BAR GRAPH 1979 -2005 3 -8

3– 11

1979 to 2009 – Real Family Income Growth by Quintile & for Top 5% Up to $26, 934 to $47, 914 to $73, 338 to $112, 540 and up $200, 000 and up Source: U. S. Census Bureau, Historical Income Tables, Table F-3, incomes in 2009 dollars adjusted for inflation; income ranges from Table FINC-06. 12

Q&A On the Income Growth Activity 3– 13

Question: Why did all income groups experience relatively equal income growth from 1949 -1979? Answer: • Union membership was on the rise, resulting in higher salaries and benefits for many Americans. • The government’s goal was to build and educate the middle class. The wealthy were taxed equitably with the working and the poor and the money was invested in public education. 3 -14

Examples of policies designed to grow the middle class: • The G. I. Bill • The National Defense Education Act • The Elementary & Secondary Education Act 3 -14 15

It Paid Off – in $ and Increased Educational Attainment Example: Martin Feldstein, Reagan’s chief economic advisor, estimated that taxpayers received back $7 in additional revenue for each $1 they had invested in the G. I. Bill. Example: Literacy Achievement Gap cut nearly in ½ in approximately 15 years. Example: 1947 4% of the US population held a college degree 1980 24% of the US population held a college degree 3 -16

Question: What happened from 1979– 2009 to cause some income groups to experience huge growth, while others had modest or no income growth? Answer: * Assault on unions resulting in membership declines * Since the 1980 s government’s goal has been to: § Cut taxes for the wealthy and corporate special interests § Deregulate § Privatize 3– 17

Question: What are signs that the policies of the 1980 s – present haven’t worked? Answer: § 1980 s – present, educational attainment has been unchanged, and in some cases become worse compared to other developed nations § Job growth is stagnant § The rate of income growth has declined for all income groups (even the wealthy) as we just saw in the human bar graph § Millions more people have fallen into poverty § College tuition, gasoline, health care costs are rising 3 -18

3– 19
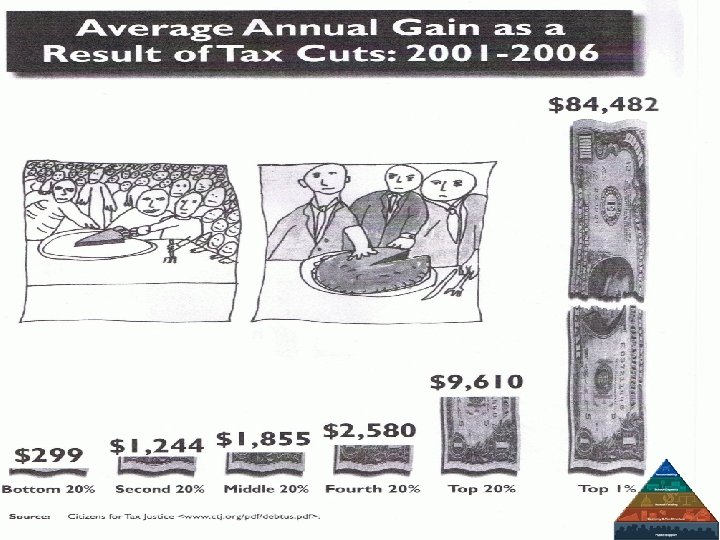

Average Annual Gain as a Result of Extending the Bush Tax Cuts through 2013 $68, 079 $7, 869 $125 $516 $819 $1, 540 Source: Citizens for Tax Justice, http: //www. ctj. org/bushtaxcuts 10 yrs/us. pdf

Review From the 1940 s – 1970 s 1. The wealthy were taxed equitably with the working and the poor, and the money was invested in public education. 2. Union membership was on the rise. 3. Educational attainment went up. 4. The American economy grew rapidly and prosperity was widely shared among all income groups (economic inequality was reduced). 3 -22

Review From the 1980 s – present 1. Taxes were cut for the wealthy and corporate special interests. 2. Taxes were increased on the rest of Americans. 3. Public education investments decreased. 4. Educational attainment is stagnant (still at 24% college educated) 5. Economic inequality increased. Top income earners increased their wealth and others saw their income decline or experienced very little income growth. 6. Increase in the number of poor students has increased the need for public education funding. 3 -23

Discussion Questions Question: Are these tax policies working to foster or hinder the achievement of the AMERICAN DREAM? Question: How do these tax policies impact our students and their parents? Our own colleagues? Many of our ESPs often have to work two jobs to make ends meet. And how many classroom teachers still keep their summer job to help pay for their children’s college tuition? Question: How might you act on this knowledge/awareness? 3– 24

Through TEF, the NEA is advocating: Tax structures that are fair and broad-based to create the conditions for student success! 3– 25

Through TEF, the NEA is advocating: A level economic development playing field with increased investment in public education for greater economic returns. Request TEF Lesson 6 to find ou more about this topic! 3– 26

Through TEF, the NEA is advocating: Adequate and equitable funding for all students. 3– 27

MAKE THE TEF CONNECTION When they lack the capacity to deliver those results… When tax structures are out of sync with the economy… Schools are being held accountable for results… Accountability School Capacity When funding is inadequate and inequitable… School Funding Economy & Tax Structure And not everyone is aware. Public Support 28 3 -26

TEF Tools and Resources TEF Website: http: //www. nea. org/tef 1 Publications Studies supporting TEF concepts: • The Effects of State Public K-12 Expenditures on Income Distribution • K-12 Education in the U. S. Economy • Protecting Public Education from Tax Giveaways to Corporations. • School Funding, Taxes and Economic Growth • TEF Series Why invest in education makes sense: Enriching Children, Enriching the Nation Corporate abuse: The Great American Job Scam - corporate tax dodging and the myth of job creation. Your Tax Dollars At Work…Offshore - foreign outsourcing firms are capturing state government contract. No More Secret Candy Store - A grassroots guide into investigating corporate subsidies. 2 State-Specific Data Sources States Facing Budget Shortfall – Center for Policy and Budget Priorities (CBPP) reports state fiscal profiles. State-by-state tax news and policy analysis provided by the Institute of Economics and Policy Analysis (ITEP). Economic Policy Institute’s (EPI) new report analysis rank states by overall unemployment as well as the change seen since the start of the recession in December 2007. Enriching Children, Enriching the Nation show state returns in budget, salary, crime reduction by investing in Pre-K thru 12. Find out how much Wal-Mart is costing your state in subsidy deals, healthcare cost, and property tax appeals. Combined Reporting, How Does Your State Stack. Up? Institute on Taxation and Economic Policy (ITEP) This reporting requires multi-state corporations to report the income earned by both the parent corporation and all of its subsidiaries and to determine their income tax liabilities on that basis. Good Jobs First state-by-state corporate subsidy websites. 3 State affiliates in TEF Action A few examples… This video address from Alabama EA President, John Wright. Alabama EA sheds light on corporate tax avoidance in Alabama Detroit News, Friday, July 25, 2008 MEA Press Release: Drop-outs One Too Many, April. 4, 2008 Honolulu Advertiser, Dec, 2006 Honolulu Advertiser, Feb. 2007 Iowa State EA News Article Kentucky EA - School Funding Statement. Michigan’s Business Tax Incentives: A study commissioned by MEA and NEA to improve the quality of the debate on business tax incentives. Mississippi EA op-ed piece. State Affiliate TEF Websites: Colorado, Illinois, Michigan, Mississippi, New Jersey, Oklahoma 3 -27

TEF Tools and Resources TEF Website: http: //www. nea. org/tef 4 Customizable Tools Community Organizing • Business Outreach Sample Political Action Tools • • 5 Other Useful Links 6 Introducing a New TEF Interactive Tool NEA Information on establishing a social networking site to use as an organizing tool. Others are: (http: //www. ning. com/ ) and Corporate Legislation TEF Model Legislation (http: //www. groupsite. com/) http: //www. faireconomy. org/tfoc to locate your state’s tax fairness organizing collaborative. These groups are located in 21 states. www. nea. org/tef 3 -30
 Wal-Mart")
Other Resources 7 On Taxes… Videos PBS Now, "Taxing the Poor" ((26. 03) Wal-Mart Subsidies (7: 48) Warren Buffett's Tax Rate is Lower than His Secretary's (4: 39) TAXES: Warren Buffett - Rich Taxed Too Little, Poor Too Much (5: 17) Eye To Eye With Katie Couric: Buffett's Tax Code (CBS News) (1: 40) 8 On Economic Policies Videos U. S. PIRG on Countdown. Olbermann talks about U. S. PIRG's report "Tax Shell Game. ” Free Lunch, Corp Welfare, Bill Moyers and David Cay Johnston (9: 49) David Cay Johnston - A History of Government Subsidies (3: 08) 9 Funding for Schools Access Quality Education: School Funding Litigation A National Network of Advocates Involved in Education Finance Litigation, Abbott vs. Burke is the New Jersey Supreme Court ordered a set of education programs and reforms widely recognized to be the most fair and just in the nation. David Cay Johnston - Are Government Subsidies Unfair? (4: 43) David Cay Johnston - A Moral Argument for Progressive Taxes (3: 04) 3 -31

“Our lives begin to end the day we become silent about things that matter. ” — Martin Luther King, Jr. The Call to Action! 3– 32
- Slides: 32