
Technologies for Big Data and Graph Analytics at
Technologies for Big Data and Graph Analytics at Oracle Labs CERN Open. Lab open day 2017 Davide Basilio Bartolini – <davide. bartolini@oracle. com> Sr. Researcher, Oracle Labs Switzerland Geneva, September 21, 2017 Copyright © 2017, Oracle and/or its affiliates. All rights reserved. |
Oracle Labs Mission “Identify, explore, and transfer new technologies that have the potential to substantially advance Oracle’s business. ” • With a global research team – 220+ Ph. D’s, MS, BS • Wide range or research topics – Graph analytics – Machine learning and AI – More at labs. oracle. com Copyright © 2017, Oracle and/or its affiliates. All rights reserved. | 3
Safe Harbor Statement The following is intended to outline our general product direction. It is intended for information purposes only, and may not be incorporated into any contract. It is not a commitment to deliver any material, code, or functionality, and should not be relied upon in making purchasing decisions. The development, release, and timing of any features or functionality described for Oracle’s products remains at the sole discretion of Oracle. Copyright © 2017, Oracle and/or its affiliates. All rights reserved. | 4
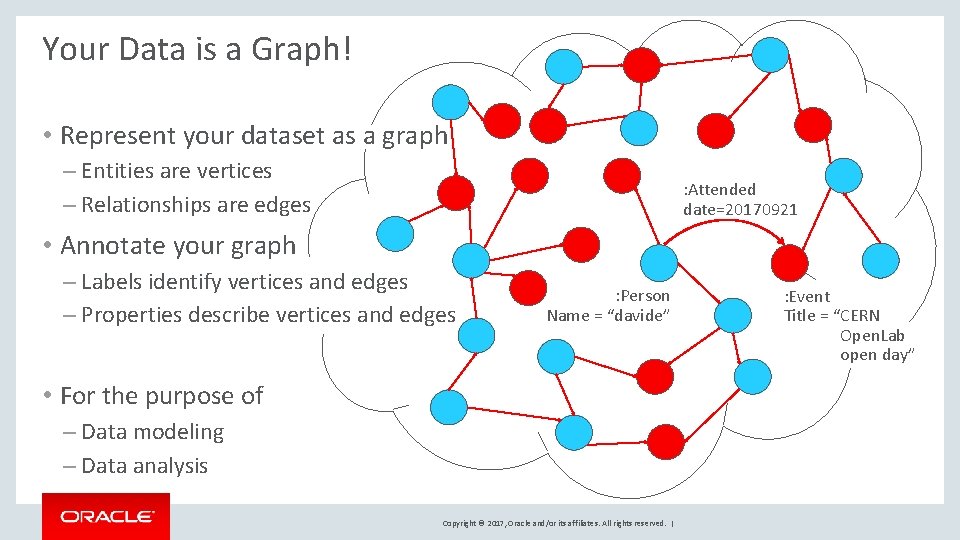
Your Data is a Graph! • Represent your dataset as a graph – Entities are vertices – Relationships are edges : Attended date=20170921 • Annotate your graph – Labels identify vertices and edges – Properties describe vertices and edges : Person Name = “davide” • For the purpose of – Data modeling – Data analysis Copyright © 2017, Oracle and/or its affiliates. All rights reserved. | : Event Title = “CERN Open. Lab open day”
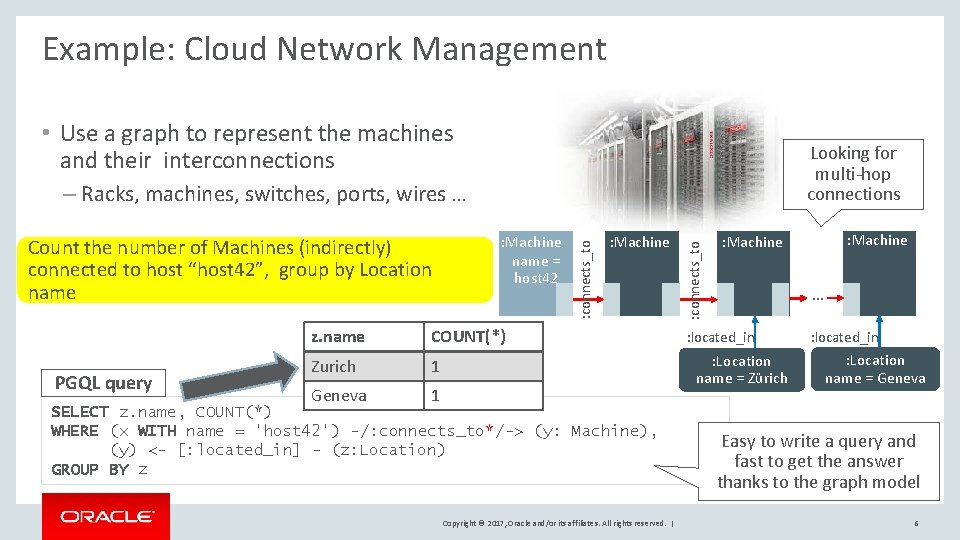
Example: Cloud Network Management • Use a graph to represent the machines and their interconnections Looking for multi-hop connections PGQL query : Machine name = host 42 z. name COUNT(*) Zurich 1 Geneva 1 : Machine : connects_to Count the number of Machines (indirectly) connected to host “host 42”, group by Location name : connects_to – Racks, machines, switches, ports, wires … … : located_in : Location name = Zürich SELECT z. name, COUNT(*) WHERE (x WITH name = 'host 42') -/: connects_to*/-> (y: Machine), (y) <- [: located_in] - (z: Location) GROUP BY z Copyright © 2017, Oracle and/or its affiliates. All rights reserved. | : Machine : located_in : Location name = Geneva Easy to write a query and fast to get the answer thanks to the graph model 6
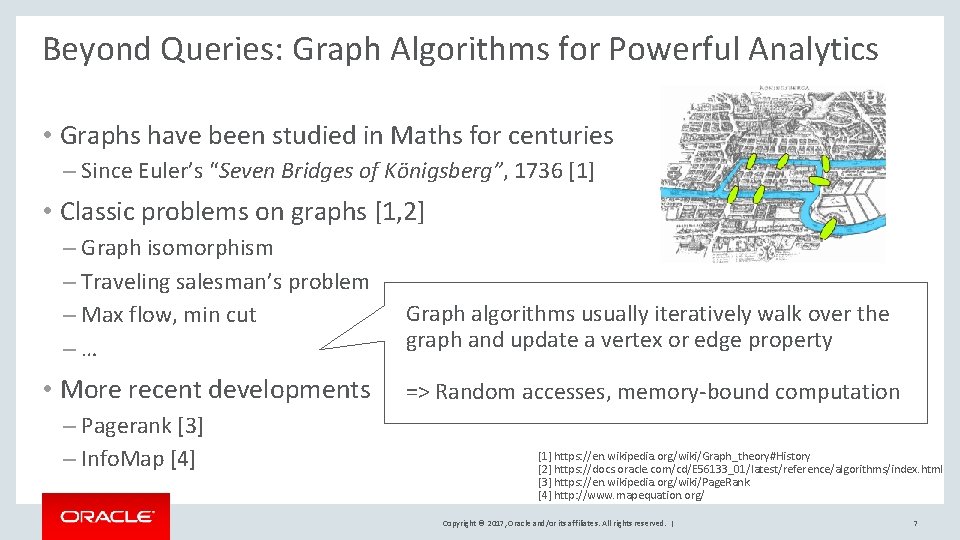
Beyond Queries: Graph Algorithms for Powerful Analytics • Graphs have been studied in Maths for centuries – Since Euler’s “Seven Bridges of Königsberg”, 1736 [1] • Classic problems on graphs [1, 2] – Graph isomorphism – Traveling salesman’s problem – Max flow, min cut –… • More recent developments – Pagerank [3] – Info. Map [4] Graph algorithms usually iteratively walk over the graph and update a vertex or edge property => Random accesses, memory-bound computation [1] https: //en. wikipedia. org/wiki/Graph_theory#History [2] https: //docs. oracle. com/cd/E 56133_01/latest/reference/algorithms/index. html [3] https: //en. wikipedia. org/wiki/Page. Rank [4] http: //www. mapequation. org/ Copyright © 2017, Oracle and/or its affiliates. All rights reserved. | 7
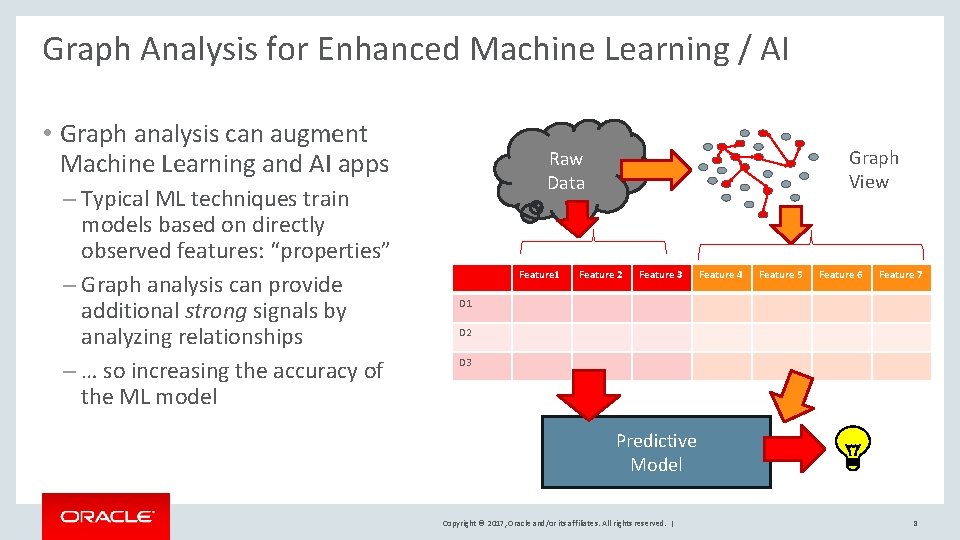
Graph Analysis for Enhanced Machine Learning / AI • Graph analysis can augment Machine Learning and AI apps – Typical ML techniques train models based on directly observed features: “properties” – Graph analysis can provide additional strong signals by analyzing relationships – … so increasing the accuracy of the ML model Graph View Raw Data Feature 1 Feature 2 Feature 3 Feature 4 Feature 5 Feature 6 Feature 7 D 1 D 2 D 3 Predictive Model Copyright © 2017, Oracle and/or its affiliates. All rights reserved. | 8
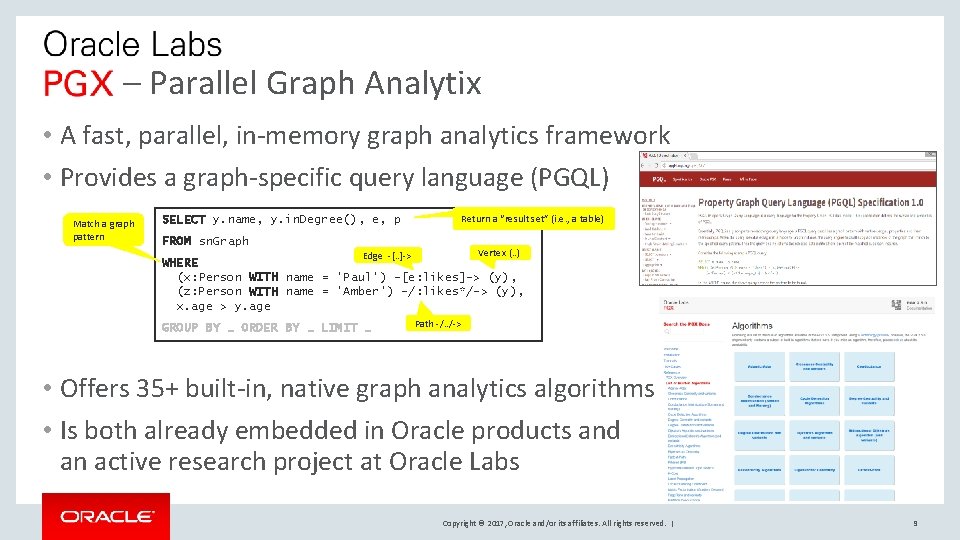
– Parallel Graph Analytix • A fast, parallel, in-memory graph analytics framework • Provides a graph-specific query language (PGQL) Match a graph pattern SELECT y. name, y. in. Degree(), e, p Return a “result set” (i. e. , a table) FROM sn. Graph Vertex (. . ) Edge -[. . ]-> WHERE (x: Person WITH name = 'Paul') –[e: likes]-> (y), (z: Person WITH name = 'Amber') -/: likes*/-> (y), x. age > y. age GROUP BY … ORDER BY … LIMIT … Path -/. . /-> • Offers 35+ built-in, native graph analytics algorithms • Is both already embedded in Oracle products and an active research project at Oracle Labs Copyright © 2017, Oracle and/or its affiliates. All rights reserved. | 9
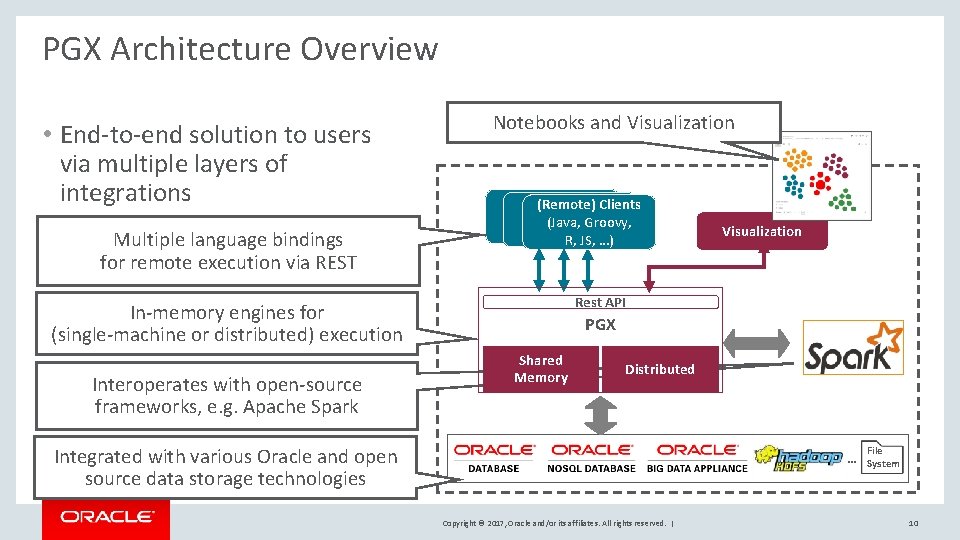
PGX Architecture Overview • End-to-end solution to users via multiple layers of integrations Multiple language bindings for remote execution via REST Notebooks and Visualization (Remote) Clients (Java, Groovy, R, JS, …) Rest API In-memory engines for (single-machine or distributed) execution Interoperates with open-source frameworks, e. g. Apache Spark Visualization PGX Shared Memory Distributed Integrated with various Oracle and open source data storage technologies … Copyright © 2017, Oracle and/or its affiliates. All rights reserved. | File System 10
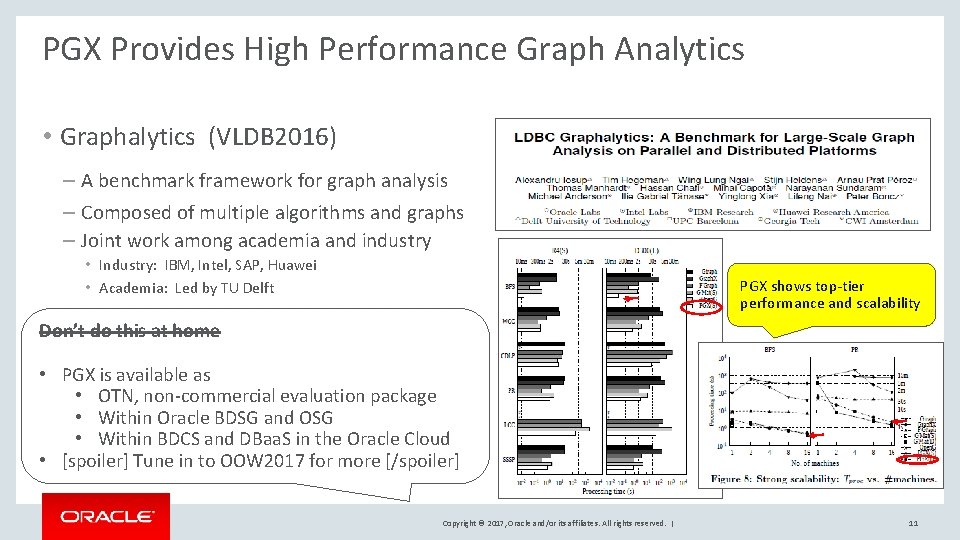
PGX Provides High Performance Graph Analytics • Graphalytics (VLDB 2016) – A benchmark framework for graph analysis – Composed of multiple algorithms and graphs – Joint work among academia and industry • Industry: IBM, Intel, SAP, Huawei • Academia: Led by TU Delft PGX shows top-tier performance and scalability Don’t do this at home • PGX is available as • OTN, non-commercial evaluation package • Within Oracle BDSG and OSG • Within BDCS and DBaa. S in the Oracle Cloud • [spoiler] Tune in to OOW 2017 for more [/spoiler] Copyright © 2017, Oracle and/or its affiliates. All rights reserved. | 11

Don’t miss the demo in the exhibition area PGX on the OTN Davide Basilio Bartolini — <davide. bartolini@oracle. com> Copyright © 2017, Oracle and/or its affiliates. All rights reserved. | labs. oracle. com 12
- Slides: 12