Techniques for Improving Quantitative Analysis of Mineral Glasses

 • Coordination Peak shifts? •")


- Slides: 17
Techniques for Improving Quantitative Analysis of Mineral Glasses John Donovan Micro Analytical Facility CAMCOR University of Oregon Eugene, OR Michael Rowe Dept. of Geosciences Oregon State University Corvallis, OR (541)-346 -4632 donovan@uoregon. edu epmalab. uoregon. edu
Points of Discussion Standards for Si (silicate vs. glass) • Coordination Peak shifts? • Beam damage? • Charging Effects Water by difference • Matrix correction effects Sulfur Peak Shift Mechanisms • Peak Shape Changes? • Peak Position Changes? • Variables (time, current) Volatilization effects • Na, K • Si, Al Instrument drift • Beam drift corrections • Intensity drift corrections • Spectrometer drift Recipes for Accuracy • Standards • Acquisition Parameters • Re-Peaking • Time vs. intensity • MAN Backgrounds
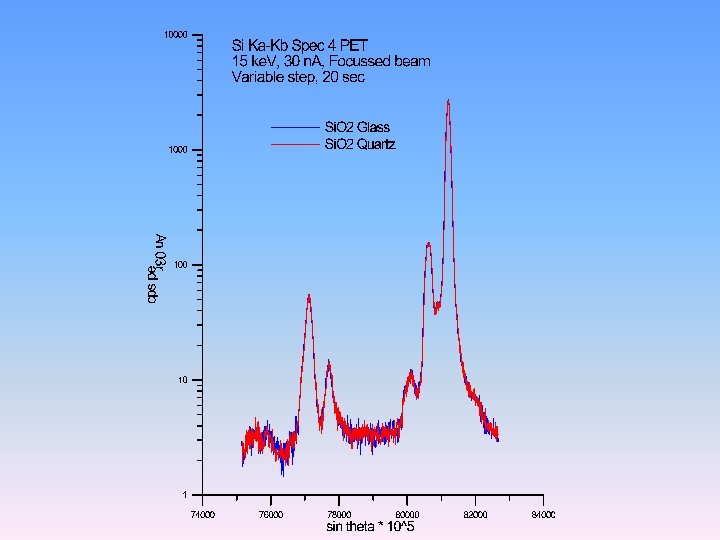
Standards for Glass Analysis “Use Glass for Glass” -but why?
Something Is Going On!
Standards for Glass Analysis Satellite Lines? Beta Lines?
Standards and Coordination Effects Subtle peak shift effects for different silicate minerals Fournelle, 2004, 2005
Standards and Beam Damage?
Standards and Beam Damage?
Or Maybe Charging? Sub surface Charging Effects Cazaux, 2004
“Volatile” or Migrating Elements Correct for Na, K loss and Si and Al gain
Change in Intensity Over Time 36% loss 0. 6% gain
John Donovan: Note: Si. O 2 and Al 2 O 3 values as a function of the corrections Matrix Effects Note: changes in 24 H-1 -1 matrix corrections and P/B (MAN) No Volatile Correction, No Water By Difference Results in Oxide Weight Percents ELEM: 58 59 60 61 62 Ca. O. 411. 437. 423. 435 K 2 O 4. 900 4. 624 4. 998 4. 853 4. 847 Fe. O. 537. 612. 526. 637. 677 Si. O 2 74. 603 75. 386 74. 715 75. 000 74. 613 Mg. O. 036. 033. 023. 047. 048 Na 2 O 2. 644 1. 841 2. 765 2. 137 2. 561 Al 2 O 3 11. 975 12. 024 12. 113 12. 089 Ti. O 2. 073. 113. 065. 055. 036 P 2 O 5. 000. 011 O. 000 H 2 O. 000 SUM 95. 180 95. 070 95. 628 95. 240 95. 317 AVER: SDEV: SERR: %RSD: . 426. 011. 005 2. 5 4. 844. 137. 061 2. 8 . 598. 065. 029 10. 8 74. 863. 333. 149. 4 . 037. 010. 005 27. 9 2. 390. 387. 173 16. 2 12. 058. 057. 025. 5 . 068. 028. 013 41. 5 . 002. 005. 002 223. 6 . 000 418. 3 . 000. 0 95. 287 ZCOR: KRAW: PKBG: 1. 1202. 0161 4. 96 1. 1536. 3080 59. 36 1. 1987. 0057 4. 84 1. 2061 1. 0344 370. 59 1. 4303. 0003 1. 42 1. 8227. 1323 30. 93 1. 2568. 7242 77. 40 1. 1983. 0006 1. 4641 -. 0004. 87 . 0000. 00 Gives ~ 4. 7% H 2 O
Volatile Correction Matrix Effects 24 H-1 -1 With Volatile Correction, No Water By Difference Results in Oxide Weight Percents ELEM: 58 59 60 61 62 Ca. O. 411. 437. 423. 435 K 2 O 4. 867 4. 740 4. 933 5. 220 4. 715 Fe. O. 537. 612. 526. 636. 677 Si. O 2 74. 378 75. 016 74. 057 74. 552 74. 794 Mg. O. 037. 034. 024. 048. 049 Na 2 O 3. 626 2. 426 3. 805 3. 025 3. 503 Al 2 O 3 12. 035 12. 063 12. 178 12. 147 12. 146 Ti. O 2. 030. 194. 076. 077. 048 P 2 O 5. 000. 011 O. 000 H 2 O. 000 SUM 95. 921 95. 521 96. 022 96. 128 96. 378 AVER: SDEV: SERR: %RSD: . 426. 011. 005 2. 5 4. 895. 203. 091 4. 1 . 598. 065. 029 10. 8 74. 559. 370. 166. 5 . 038. 010. 005 27. 3 3. 277. 557. 249 17. 0 12. 114. 062. 028. 5 . 085. 064. 029 75. 6 . 002. 005. 002 223. 6 . 000. 0 95. 994 ZCOR: KRAW: PKBG: INT%: VOL%: DEV%: 1. 1198. 0161 4. 97. 000. 0 1. 1530. 3114 60. 00 1. 135. 2 1. 1983. 0057 4. 84. 000. 0 1. 2092 1. 0276 369. 28. 00 -. 658. 0 1. 4391. 0003 1. 43. 000. 0 1. 8180. 1819 42. 09. 00 36. 111. 4 1. 2625. 7242 77. 00. 0 1. 1979. 0008 1. 58. 00 20. 283 20. 3 1. 4627 -. 0004. 87. 00. 000. 0 . 0000. 00. 000. 0 Gives ~ 4% H 2 O
Water By Difference Matrix Effects 24 H-1 -1 With Volatile Correction, Water By Difference Results in Oxide Weight Percents ELEM: 58 59 60 61 62 Ca. O. 414. 441. 426. 438 K 2 O 4. 885 4. 759 4. 951 5. 239 4. 730 Fe. O. 542. 618. 531. 641. 682 Si. O 2 74. 776 75. 464 74. 441 74. 934 75. 149 Mg. O. 039. 036. 026. 050. 051 Na 2 O 3. 668 2. 457 3. 848 3. 058 3. 539 Al 2 O 3 12. 139 12. 181 12. 249 12. 240 Ti. O 2. 030. 195. 076. 077. 048 P 2 O 5. 000. 011 O. 000 AVER: SDEV: SERR: %RSD: . 429. 011. 005 2. 5 4. 913. 203. 091 4. 1 . 603. 065. 029 10. 8 74. 953. 385. 172. 5 . 041. 010. 005 25. 7 3. 314. 562. 251 16. 9 12. 218. 057. 025. 5 . 085. 065. 029 75. 6 . 002. 005. 002 223. 6 . 000 -104. 6 ZCOR: KRAW: PKBG: INT%: VOL%: DEV%: 1. 1241. 0161 5. 03. 000. 0 1. 1571. 3114 60. 00 1. 135. 2 1. 2053. 0057 4. 89. 000. 0 1. 2156 1. 0276 372. 20. 00 -. 658. 0 1. 4515. 0004 1. 46. 000. 0 1. 8372. 1821 43. 35. 00 36. 111. 4 1. 2731. 7244 78. 99. 000. 0 1. 2037. 0008 1. 58. 00 20. 283 20. 3 1. 4591 -. 0004. 87. 000. 0 . 0000. 00. 000. 0 H 2 O 3. 506 3. 849 3. 420 3. 327 3. 112 SUM 100. 000 3. 443 100. 000. 270. 121 7. 9. 0000. 00. 000. 0 Gives 3. 4% H 2 O
Instrument Effects • Beam Drift Corrections • Standard Drift Corrections • Sample Tilt (melt inclusions) • Spectrometer Reproducibility
Trace Sulfur Accuracy Issues