
Technical analysis What is technical analysis Involves the




- Slides: 31
Technical analysis
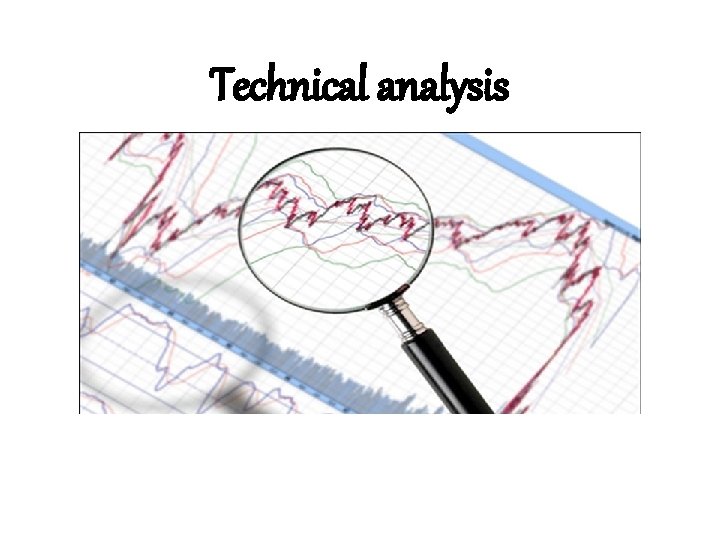
What is technical analysis? • Involves the examination of past market data such as prices and the volume of trading, which leads to an estimate of future prices trends and therefore an investment decision. • It believes that using data from the market itself is a good idea because the market is its own best predictor.
Definition of technical analysis • Technical analysis is a method of evaluating securities by analyzing statistics generated by market activity, past prices and volume. • Technical analysis is a methodology that makes buy and sell decisions using market statistics. It primarily involves studying charts showing the trading history and statistics for whatever security is being analyzed. • Technical analysis is a security analysis methodology forecasting the direction of prices through the study of past market data, primarily price and volume.
Underlying assumptions of technical analysis • The market value of any good and service is determined solely by the interaction of supply and demand. • Supply and demand are governed by numerous factors both rational and irrational. • Disregarding minor fluctuations, the prices for individual securities and overall value of the market tend to move in trends which persist for appreciable lengths of time. • Prevailing trends change in reaction to shifts in demand supply relationships and these shifts can be detected in the action of market.
The Importance of volume • What is volume? Volume is simply the number of shares or contracts that trade over a given period of time, usually a day. The higher the volume, the more active the security. Any price movement up or down relatively high volume is seen as a stronger, more relevant move than a similar move with weak volume.
Advantages of technical analysis • Not heavily dependent on financial statements - Problems with accounting statements: 1. Lack information needed by security analysts 2. Accounting standards allows firms to select reporting procedures, resulting in difficulty comparing the statements from two firms. 3. Non- quantifiable factors do not show up in financial statements. • Fundamental analyst must process new information and quickly determine a new intrinsic value, but technical analyst merely has to recognize a movement to a new equilibrium.
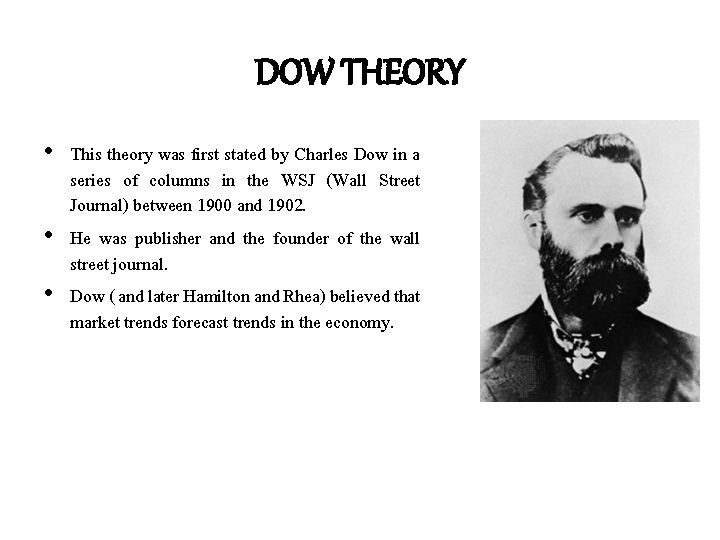
DOW THEORY • This theory was first stated by Charles Dow in a series of columns in the WSJ (Wall Street Journal) between 1900 and 1902. • He was publisher and the founder of the wall street journal. • Dow ( and later Hamilton and Rhea) believed that market trends forecast trends in the economy.
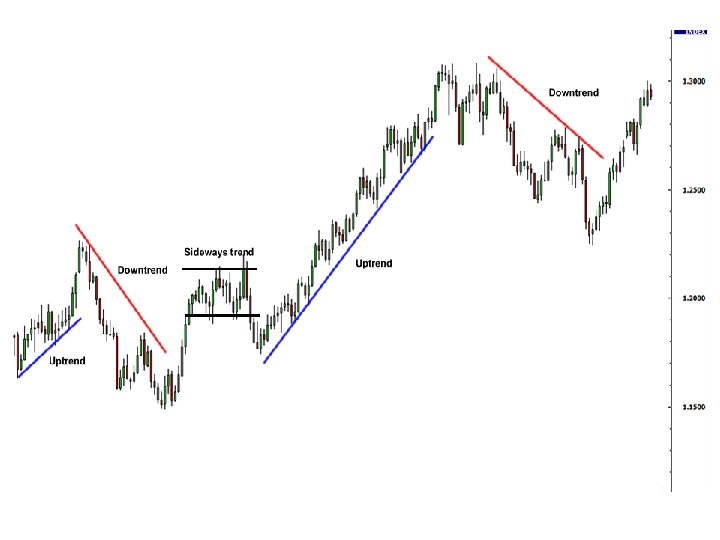
Important tenets of Dow theory • MARKET DISCOUNTS EVERYTHING : All information-past, current or even future is discounted into the markets and this is reflected in the prices of stocks and indexes. • TRENDS LINES: is a straight line that connects two or more price points and then extends into future to act as a line of support and resistance.
• Upward line: has a positive slope and is formed by connecting two or more low points. The second low must be higher than the first for the line to have a positive slope. Uptrend lines act as support and indicate that net-demand (demand less supply) is increasing even as the price rises. A rising price combined with increasing demand is very bullish, and shows a strong determination on the part of the buyers. As long as prices remain above the trend line, the uptrend is considered solid and intact. • Downtrend line: A downtrend line has a negative slope and is formed by connecting two or more high points. The second high must be lower than the first for the line to have a negative slope. Downtrend lines act as resistance, and indicate that net-supply (supply less demand) is increasing even as the price declines. A declining price combined with increasing supply is very bearish, and shows the strong resolve of the sellers. • Sideways trend: The sideways trend describes the horizontal price movement that occurs when forces of supply and demand are nearly equal. A sideways trend is often regarded as a period of consolidation before the price continues in the direction of the previous move.
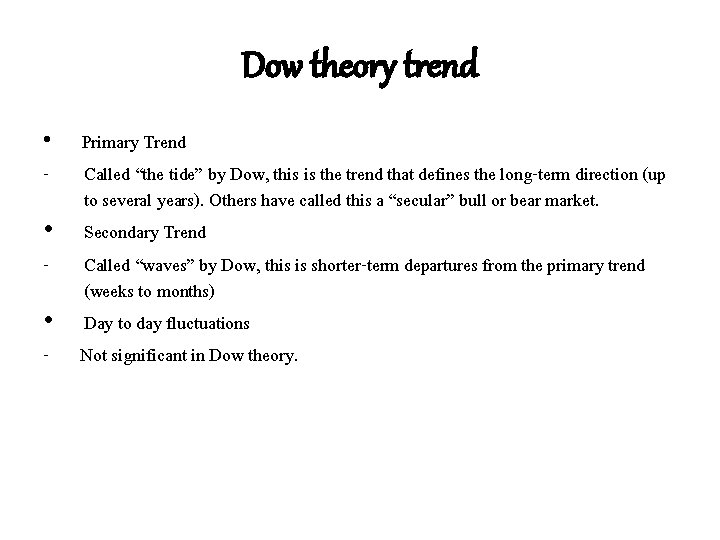
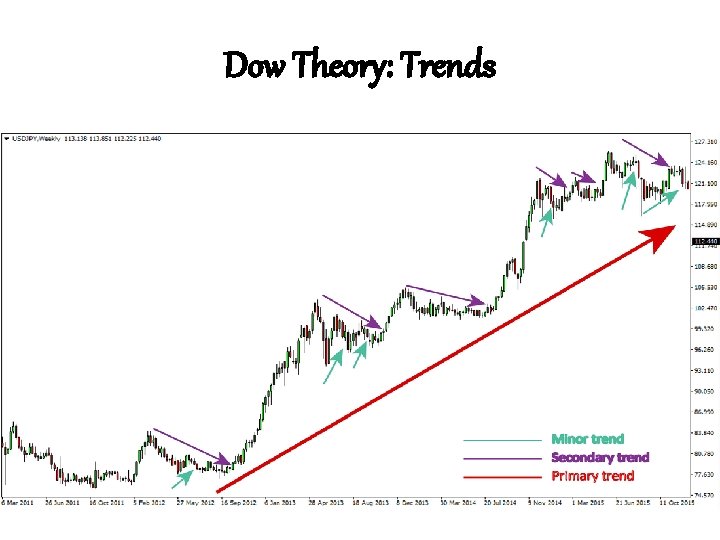
Dow theory trend Primary Trend - Called “the tide” by Dow, this is the trend that defines the long-term direction (up to several years). Others have called this a “secular” bull or bear market. • Secondary Trend - Called “waves” by Dow, this is shorter-term departures from the primary trend (weeks to months) • Day to day fluctuations - Not significant in Dow theory. •
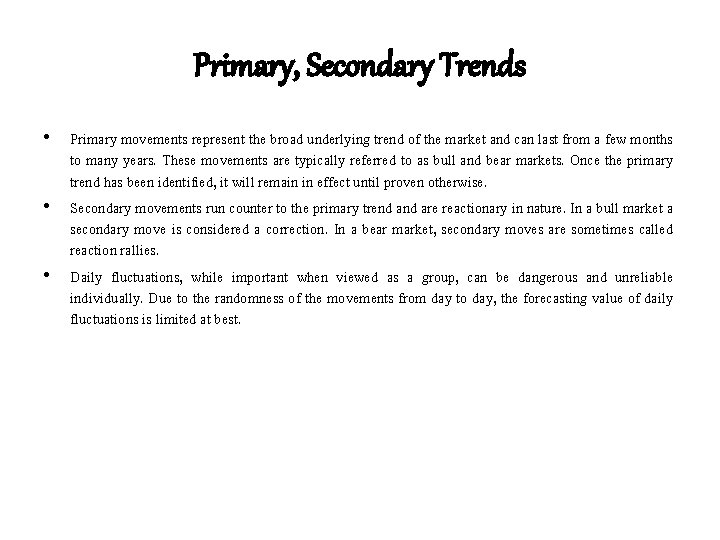
Primary, Secondary Trends • Primary movements represent the broad underlying trend of the market and can last from a few months to many years. These movements are typically referred to as bull and bear markets. Once the primary trend has been identified, it will remain in effect until proven otherwise. • Secondary movements run counter to the primary trend are reactionary in nature. In a bull market a secondary move is considered a correction. In a bear market, secondary moves are sometimes called reaction rallies. • Daily fluctuations, while important when viewed as a group, can be dangerous and unreliable individually. Due to the randomness of the movements from day to day, the forecasting value of daily fluctuations is limited at best.
Dow Theory: Trends
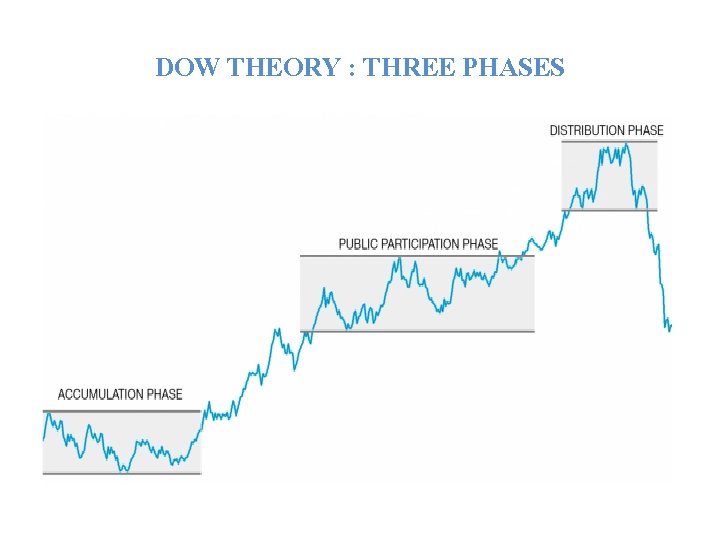
DOW THEORY : THREE PHASES
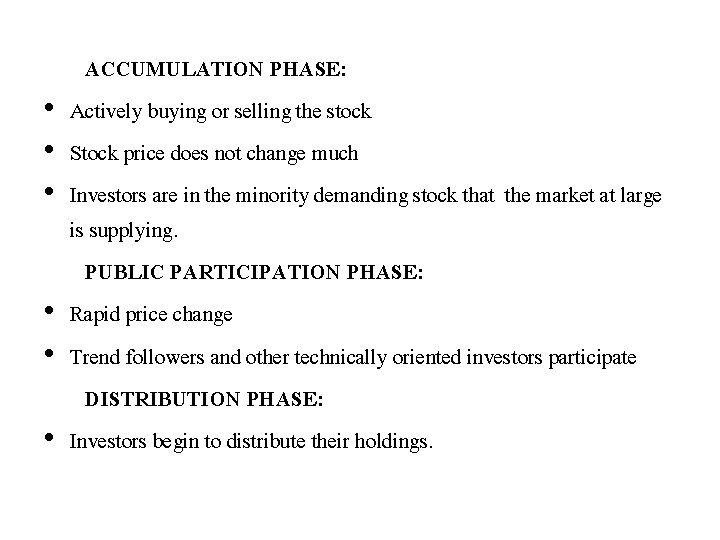
• • • ACCUMULATION PHASE: Actively buying or selling the stock Stock price does not change much Investors are in the minority demanding stock that the market at large is supplying. PUBLIC PARTICIPATION PHASE: Rapid price change Trend followers and other technically oriented investors participate DISTRIBUTION PHASE: Investors begin to distribute their holdings.
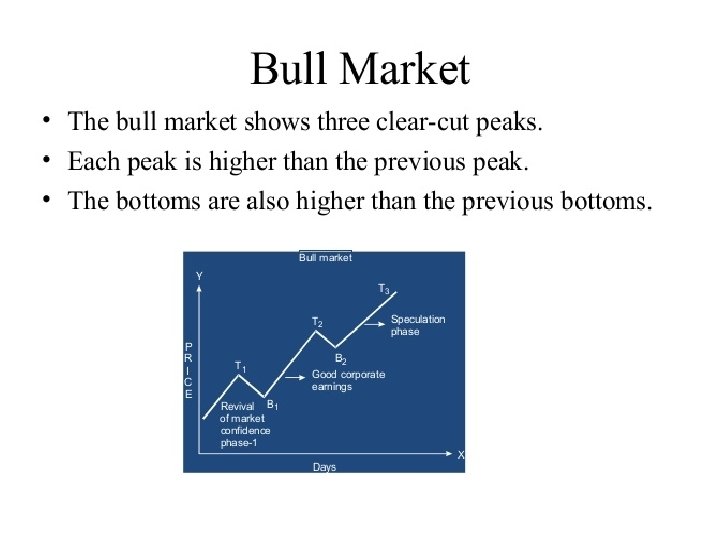
BULLISH TREND ( BULL MARKET) During a bull market (upward moving market), in the first phase the prices would advance with the revival of confidence in the future of business. The future prospects of business would be perceived to be promising. This will prompt the investors to buy shares of companies. During second phase, prices would advance due to improvements in corporate earnings. In the third phase, prices advance due to inflation and speculation.
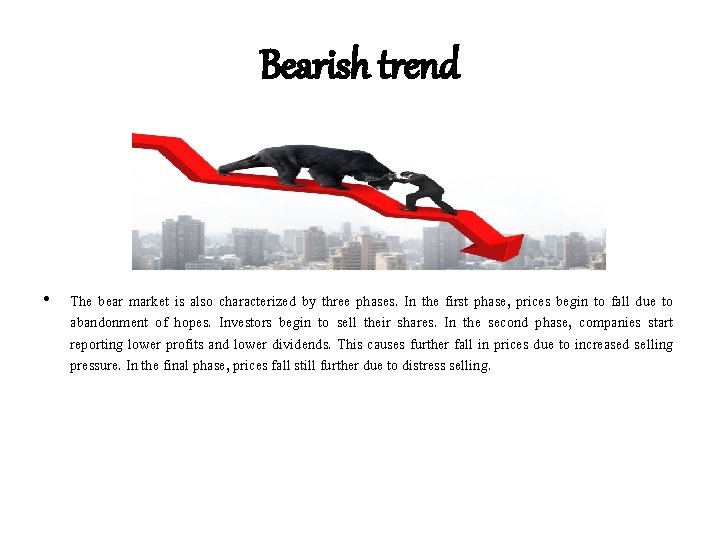
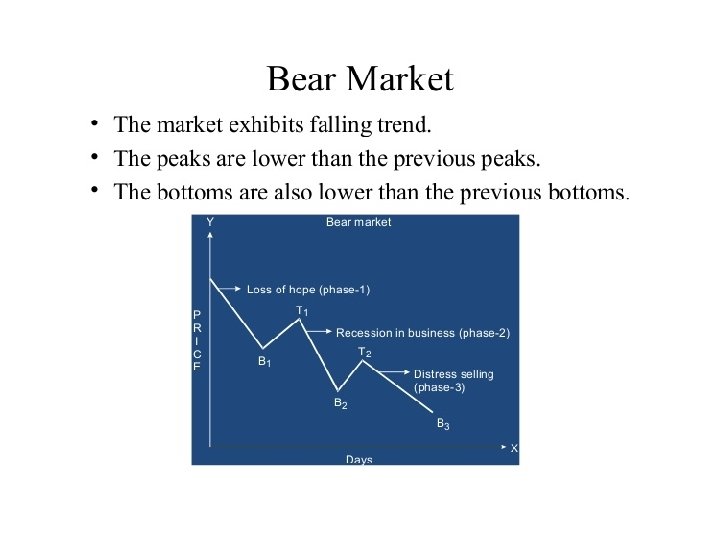
Bearish trend • The bear market is also characterized by three phases. In the first phase, prices begin to fall due to abandonment of hopes. Investors begin to sell their shares. In the second phase, companies start reporting lower profits and lower dividends. This causes further fall in prices due to increased selling pressure. In the final phase, prices fall still further due to distress selling.
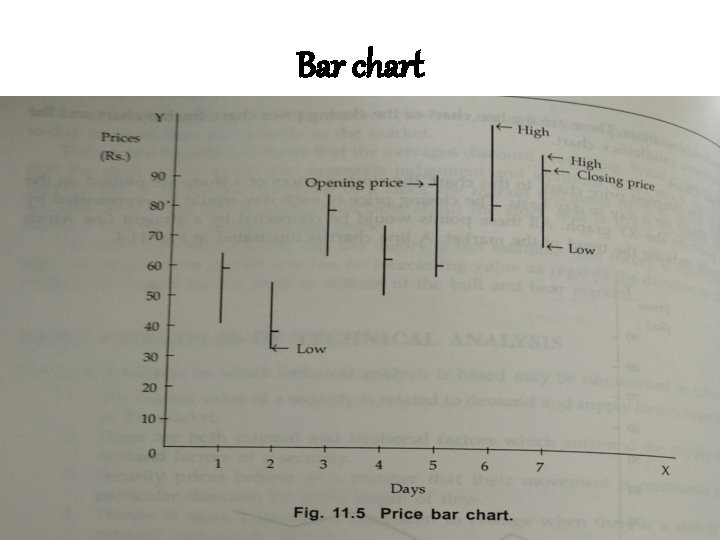
Bar chart
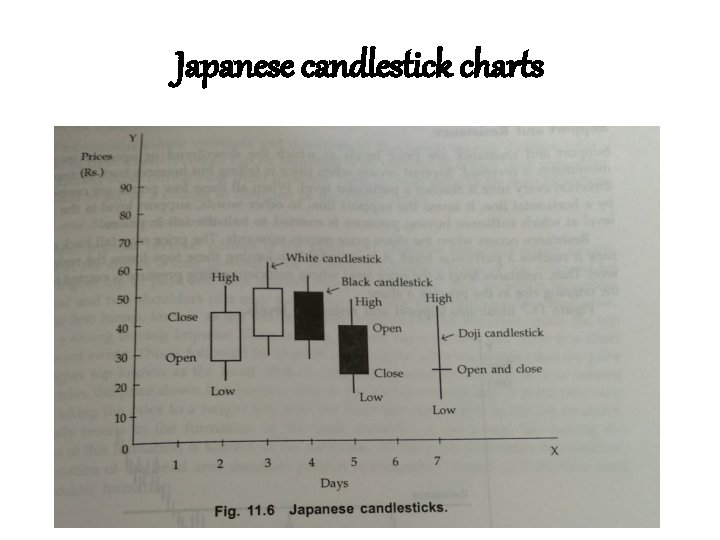
Japanese candlestick charts
Chart patterns • The chart patterns may be classified as support and resistance patterns, reversal patterns and continuation patterns.
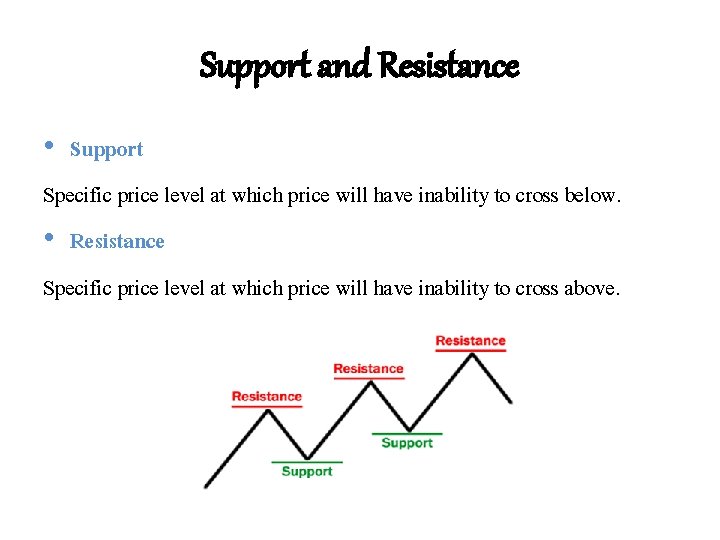
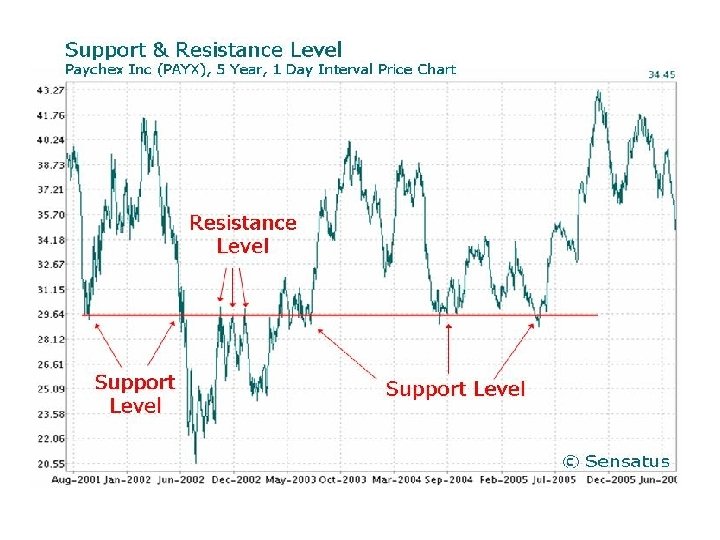
Support and Resistance • Support Specific price level at which price will have inability to cross below. • Resistance Specific price level at which price will have inability to cross above.
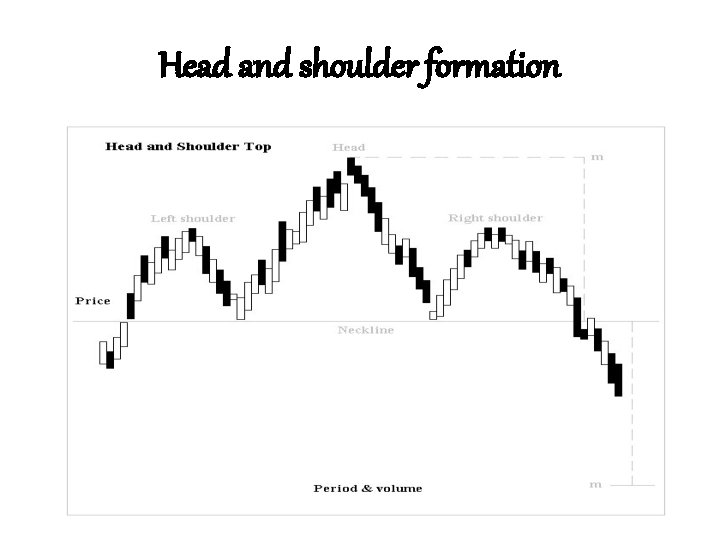
Head and shoulder formation
This pattern is comprised of three component parts: • After a long bullish trends, the price rises to a peak and subsequently declines to form a trough. • The price rises again to form a second high substantially above the initial peak and declines again. • The price rises a third time, but only to the level of the first peak, before declining once more. The first and third peaks are shoulders, and the second peak forms the head. The line connecting the first and second troughs is called the neckline.
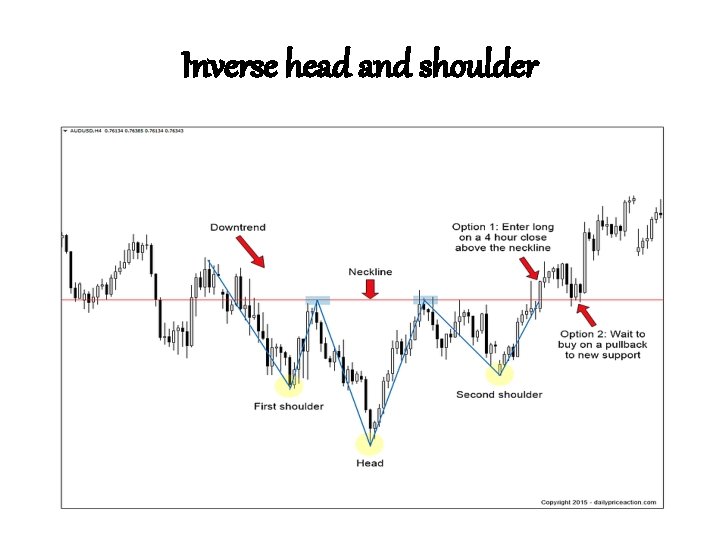
Inverse head and shoulder
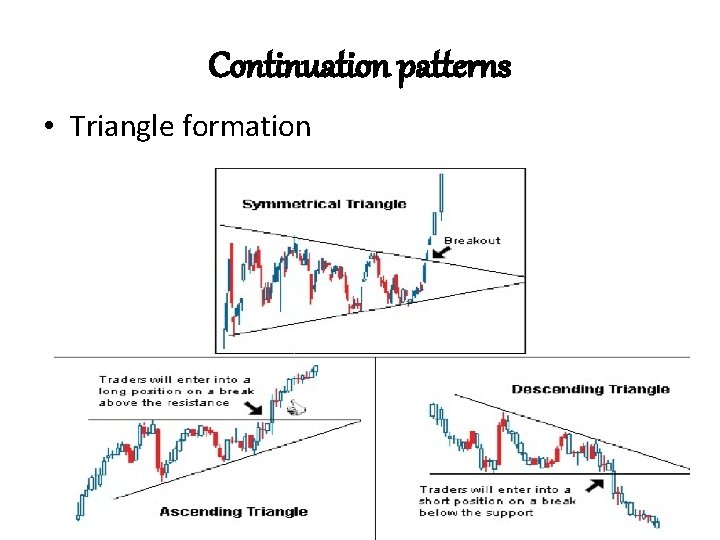
Continuation patterns • Triangle formation
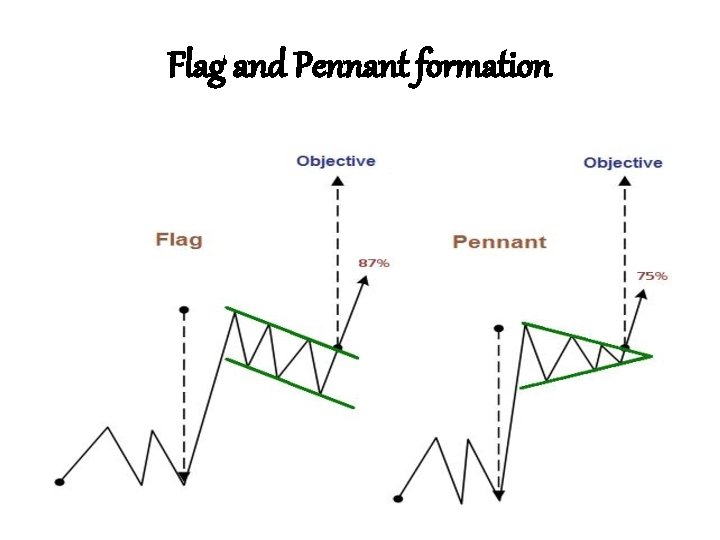
Flag and Pennant formation
REFERENCES • S. Kevin • https: //www. youtube. com/watch? v=ab. Hv. Vse h 7 e. A • https: //www. youtube. com/watch? v=0 LZg. VDN v. Lx. E