Teaming for Success Going from ALL to EACH


 Matter School A Student weekly growth: . 5 cwpm Instructional Group")


- Slides: 15
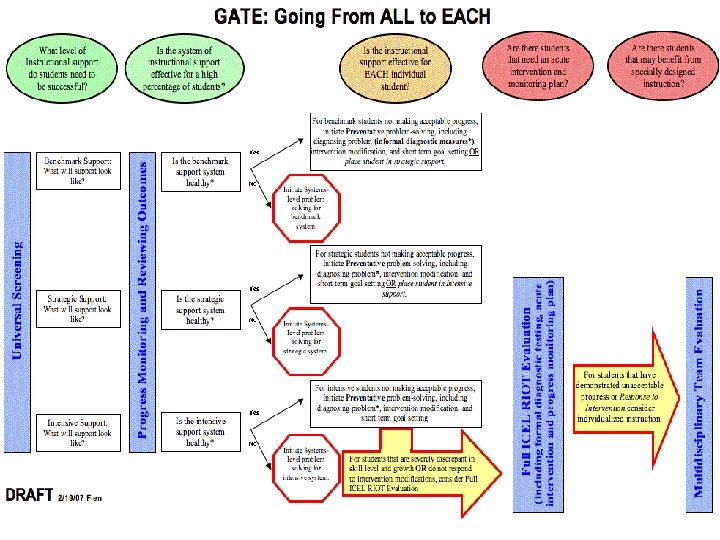
Teaming for Success: Going from ALL to EACH
Option #2: Oregon Reading First’s PD series • Training series is optional, if interested submit application – Application due by November 22 nd • Content: – – Systems-level problem solving Systems level and individual growth and goal setting RTI in a Three-tiered model (Tigard-Tualatin Series) District and School Literacy planning (Sustainability) • PD mechanism – Statewide, Regional, school-based • Funding: – February, 2007 ODE will fund – 2007 -2008 school year either RF funding or alternative ODE funds
Objectives Part 1 • New section 3 reports • Developing school goals K-3 • Student goals and zones of growth Part 2 • Systems level problem solving Part 3 • Sustainability • Literacy planning
Healthy Systems (Tiers) Matter School A Student weekly growth: . 5 cwpm Instructional Group Average weekly growth: . 5 cwpm School B Student weekly growth: . 5 cwpm Instructional Group Average weekly growth: 1. 75 cwpm
Dual Discrepancy: Severely discrepant in initial skill level and growth
Section 3 Reports and School Level Goals
Oregon Reading First Section 3 Report
Oregon Reading First Section 3 Report - Charts
Oregon Reading First Section 3 Report - Text
Kindergarten Students across 12 states in Western Region *High performing = 85 th percentile % Intensive K High Performing* Students Entering % of Students Fall Benchmark at EOY 60% or more 50 – 59% 40 – 49% 30 – 39% 20 – 29% 0 – 19% 95. 9% 93. 8% 95. 7% 93. 9% 93. 8% 100% Average % of Students Benchmark at EOY 83. 4% 74. 5% 79. 7% 78. 8% 77. 4% 84. 2%
Grade 1 Students across 12 states in Western Region *High performing = 85 th percentile % Intensive K High Performing Students Entering % of Students Fall Benchmark at EOY 60% or more 50 – 59% 40 – 49% 30 – 39% 20 – 29% 0 – 19% 71. 4% 77. 8% 73. 7% 80. 3% 81% 89. 7% Average % of Students Benchmark at EOY 57. 9% 53. 6% 59. 2% 63. 2% 64. 1% 70. 7%
Grade 2 Students across 12 states in Western Region *High performing = 85 th percentile % Intensive K High Performing Students Entering % of Students Fall Benchmark at EOY 60% or more 50 – 59% 40 – 49% 30 – 39% 20 – 29% 0 – 19% 63. 2% 63. 8% 71. 1% 66. 2% 68. 6% 87. 7% Average % of Students Benchmark at EOY 48% 45% 52. 8% 51. 3% 54. 8% 65. 1%
Grade 3 Students across 12 states in Western Region *High performing = 85 th percentile % Intensive K High Performing Students Entering % of Students Fall Benchmark at EOY 60% or more 50 – 59% 40 – 49% 30 – 39% 20 – 29% 0 – 19% 63. 3% 64. 1% 63. 9% 62. 5% 71% 75% Average % of Students Benchmark at EOY 47. 6% 45. 9% 50% 44. 9% 51. 8% 58. 3%