Teaching TOS charts new tricks 71809 San Diego


 defaults vary based on Color Scheme choiceing when logging")


- Slides: 25
Teaching TOS charts new tricks 7/18/09 San Diego - Marc Covitt
Topics Ø What we won’t be covering l l l Items for which TOS provides Resources and training THAT you should know about Not a TA explanantion; Not active trader TOS vs. Prophet Charts Ø Key things you should know Ø Shortcuts (DEMO) Ø Misc recommendations ØQ & A (Goal is to learn something new)
Resources you should know about…
1. Think. Desktop’s Learning Center Note: Don Kaufman claims to be an “anti-chartite”
2. Do a Keyword search. 3. “Charts” or “Prophet” https: //www. thinkorswim. com/tos/display. Page. tos; jsessionid=3 E 255 B 79 C 64782 A 3 DBA 3 D 57 D 58 B 00 B 97. v 08? webpage=software. Support&display. Format=hide
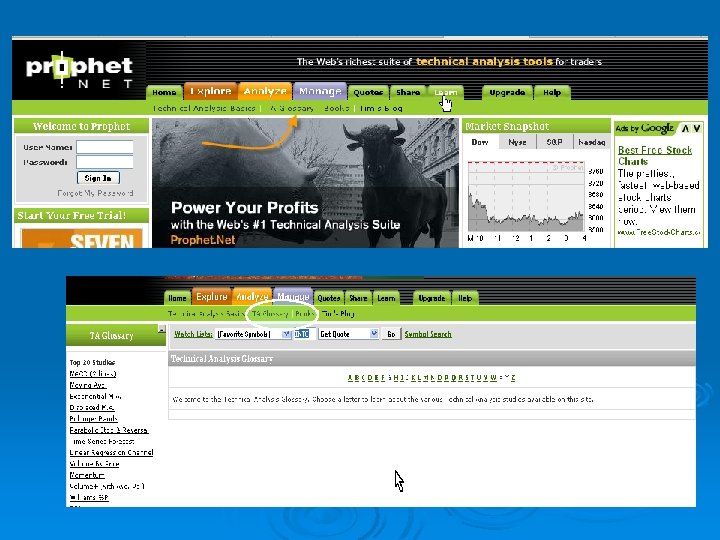
Some other Resources Ø Prophet. net l Describes technical studies Ø Investopedia. com Ø And of course, just Google (or BING? )
TOS Charts vs Prophet Ø Early TOS platform included Prophet Ø Thinkorswim was unable to get some features included and in ~2003 decided to develop their own TOS Charts, but kept Prophet charting Ø Investools bought Prophet (Tim Knight) in ~2005, and with the 2006 merger with TOS he ended up reporting to Tom Sosnoff… Ø (Rumor has it that the AMTD merger will add another package to platform, eventually)
TOS Charts vs More flexible formats Ø Supports thinkscript and strategies Ø Integration w trading platform and WL’s Ø Drawing tools “sticky” Ø Can be confused Ø Prophet Visually cleaner Ø Some things are just easier to do/change Ø Pattern recognition + Ø Ø Different data feed, but index/future don’t share symbol set w trading
Where do you want to go?
Maybe this?
Or this?
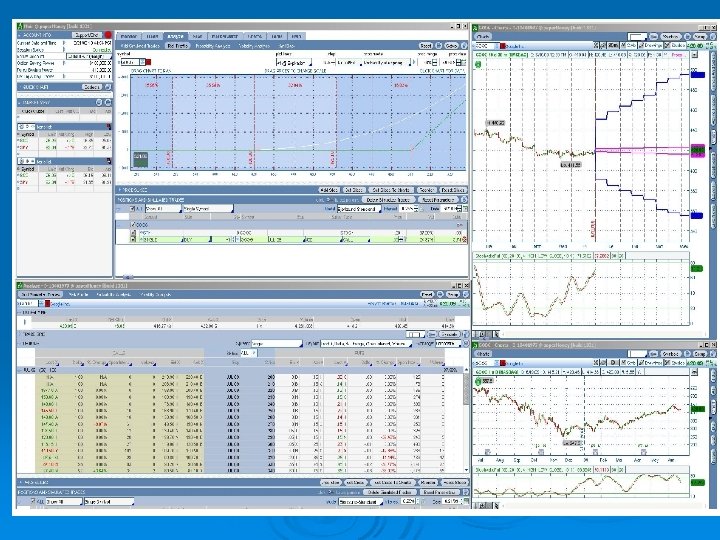
Or this? 2 min, 5 min, 15 min, & Daily compared with another stock/index
Or this?
TOS Charts Ø Powerful Ø Flexible Ø Confusing Ø Frustrating Ø But let’s try to see how to improve the situation.
Key Concepts Ø Basechart Ø Studies, Styles, Grids Ø Defaults Ø Links Ø Shortcuts Ø Watch Lists (for charts)
Demo Ø Create a simple chart Ø Show Edit Studies Shortcut Ø Create a new default l l Set a link pattern save as a style Ø Create a grid pattern (naming. . ) Ø Show multiple layouts
Some suggestions Create your OWN default chart Ø Save your default (in case of a reset) as a named Style. (then you can recover) Ø Use the shortcuts Ø l Especially for volume, ext hours, corp actions Use the edit studies button and search to load up studies Ø Use linking, & Watch lists for quick charts Ø Use a standard naming pattern for grids. Ø
Naming grids – a suggestion Ø XXa YYY NNNNN Ø xx = number (i. e. 01 – 99) Ø a = (optional) alpha Ø yyy = Color (linking) code Ø NNNN = descriptive name
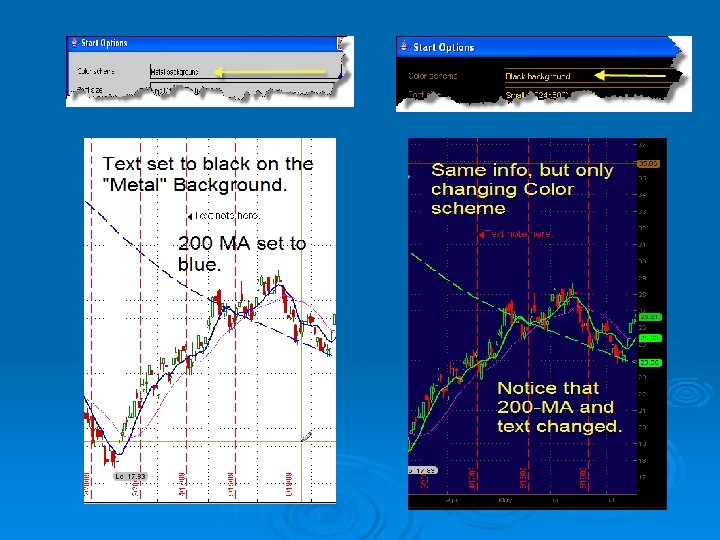
Color Schemes Ø Color (factory) defaults vary based on Color Scheme choiceing when logging in. Ø Color choices may not look good, or even be visible if you change Color Schemes.
No change in screen design or color palette, but look what happens when TOS background screen is changed.
Final thoughts Ø Multiple ways to get there. l But learning quick steps will save you time. Flexible grids allows for more customized grids Ø USE link color in Market View (lower) list for fastest chart Ø Create specialized grids with different link colors. Ø Spend some time “playing” with it. Ø