TEACHING STATISTICS ONLINE Dr Alison Bentley Research Coordinator

TEACHING STATISTICS ONLINE Dr Alison Bentley Research Coordinator School of Clinical Medicine Faculty of Health Sciences

Rationale • Most of the postgraduate students in Faculty of Health Sciences are doing an MSc by coursework and Research report • Most are not at Medical school (international and off-site e. g. Chris Hani Baragwanath or Sterkfontein Hospital) • Research report counts for 30 -50% of total. • 600 students are doctors training to be specialists registered for a MMED with a 30% RR • Employed by Department of Health to manage the wards in the academic hospitals • Therefore employed full-time including one or two nights per week saving lives

Suitability to conduct research • Most never done any research • Those who last did it at least 4 years ago • 5 th year medicine – ½ years intern, 1 years community service and then to registrar • Problem areas • Protocol development • Data analysis • Writing skills • Computer skills

The problem • Up until 2011 the MMED degree was optional – graduated 20 -30 per year. • From this year completion of the degree is obligatory – need to graduate 150 per year in four years time • Legacy of 15 years without MMEDs • Very few supervisors • Lack of research culture • Lack of all types of research skills

Toxic combination • Research report is a problem • No skills • No time to attend courses to learn skills • Very few good supervisors from which to learn skills (apprentice model) – usually overloaded with students • Result – medical graduates who are the best of the bunch feel incompetent and so Try to avoid research thus 20 graduates per year Now all have to complete

Proposal • Make projects very simple thus only requiring simple statistics – descriptive and two way comparison • Make training relatively simple and secret and very time flexible • Present as many courses as possible as web-based curriculum • Don’t assume any knowledge • Small modules thus allowing for 15 minutes on a Sunday afternoon and another 15 minutes on Tuesday night • Always present for revision • Some assessment – gives sense of competence

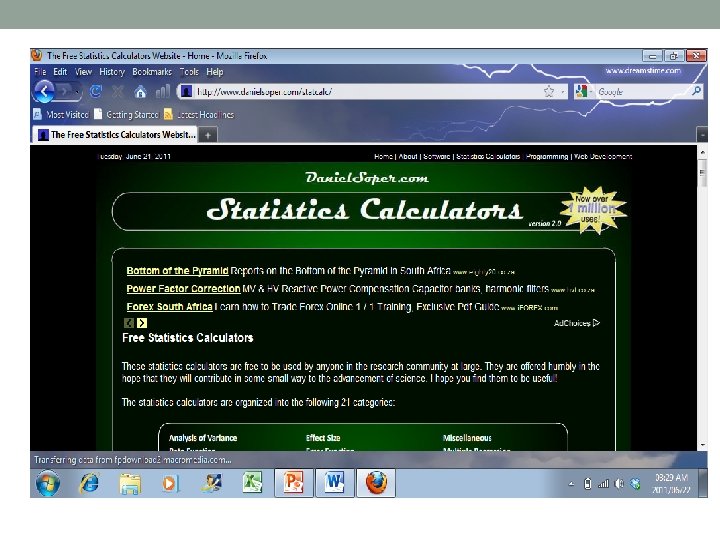
Statistics course • Provide • Logic of data analysis • basic stats training • Excel training • To use free statistical software if possible • And as little as possible – you don’t have to learn a whole stats package to do one or two statistical tests • To allow for frequent self-assessment – no shame • Medical science based • (Staff could also log on to course in order to upskill without students knowing)

Basic process • 2 components • Statistics for protocols • How to analyze data • Not just about the statistics • Need to understand what you need to do before that • There is some logic to the choice of test

Statistics for protocols

Listing and classifying variables As background reading, please see Basic Statistical language – then: 1. Create a list of all the variables that you plan to collect during your research in a table with three columns (as indicated below). As an example, if we use the data from the data collection sheet 2 we will get a list as follows: Variable Data obtained Type of variable Para / non-para Numbers / categories / ordinal Age Gender Weight Height Loves dogs 2. Then decide for each variable collected what data you will obtain (or how you will measure the variable) and what type of variable it is. For the

Statistics for protocols

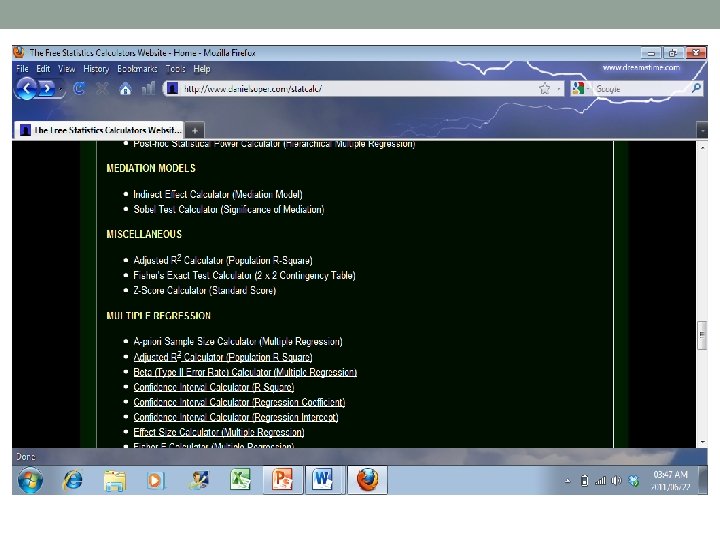
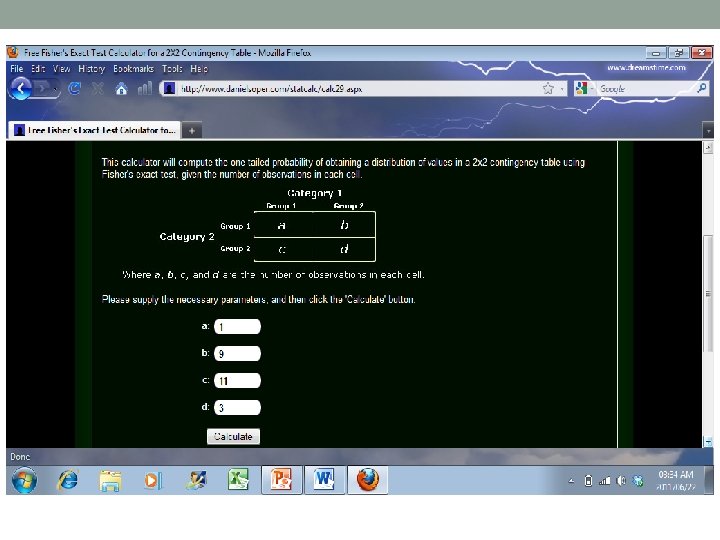
Objectives Num / ord / cat Test To describe: Numbers Descriptive statistics defined Paired/unpaired Numbers Non or Parametric test Parametric Mean and standard deviation Non- parametric Median and confidence intervals Ccategories To compare: Numbers Percentages / ratios Compare groups Unpaired Parametric Unpaired t-test Numbers Paired Parametric Paired t-test Numbers Unpaired nonparametric Mann-Whitney Numbers Unpaired Parametric diff SDs Welchs corrected t-test Numbers Paired nonparametric Wilcoxon matched pairs Unpaired Parametric One-way ANOVA Numbers Paired Parametric Repeated measures ANOVA Numbers Unpaired nonparametric Kruskal-Wallis Numbers Paired nonparametric Friedman test Numbers Categories 3 -26 groups Contingency table Ordinals / categories To correlate: Numbers 2 group Correlation 2 x 2 Fishers exact (small numbers) or Chi 2 for bigger samples. Larger table Chi Square X and Y Numbers Regression parametric Pearson correlation nonparametric Spearman Correlation X and Y Linear Regression Y plus 2 or more X Multiple regression

Can then practice Descriptive statistics section Mean Theory Standard deviation etc How to calculate Practice Self-assessment At the end of each section have more comprehensive assessment

Statistics after collecting data

Enter the data • Excel workshop • Basic features of Excel • Cell formats • Freeze panes • Rename sheets • Adjusting column width • How to enter data • Rows and columns • Numbers and categories Similar to Help function in Excel but more focussed

Statistics after collecting data

Conclusion • No excuse not to learn the skills required to predict and analyze data for simple projects • Short modules in “non-stats speak” • Very time flexible • Can’t forget what they learnt on a fixed course because of revision potential • Can study in secret • Practice sessions will often be similar to real data • Plan to also develop protocol development skills and writing skills course Thank you
- Slides: 20