Teaching resources Tectonic activity and hazards Thoku Japan
 and Haiti (2010) compared Library")


 Japan has a very high HDI, and Haiti a very")


 rank high at 21 st")


 Visit our website: www. msf. org. uk")
- Slides: 49
Teaching resources Tectonic activity and hazards Tōhoku, Japan (2011) and Haiti (2010) compared Library of slides and activities for MEDC and LEDC case studies Part I: Disaster hotspots, World Risk Report, urban risk, perception, approach, preparedness, and insurance compared Guided by 2016 A level Geography specifications
Contents Part I • Natural hazards and disaster hotspots Japan and Haiti • Level of development: MEDC and LEDC • Where and who is most at risk of seismic activity? Disaster risk: risk, exposure, vulnerability, coping capacity • World risk report and urban risk • Awareness, perception and approach • Mitigation and preparedness • Insurance
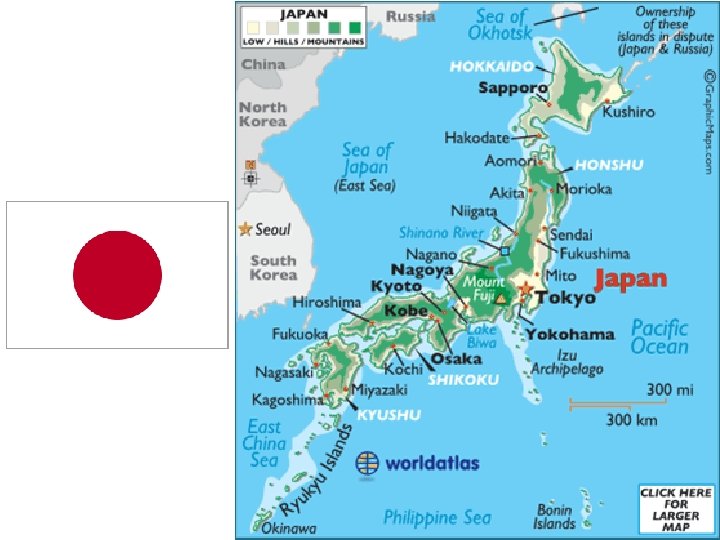
Geography: Japan • An archipelago in East Asia between the Pacific Ocean and the Sea of Japan, east of the Korean peninsula, Japan consists of 6, 852 islands. It is 70% covered in mountains, reforested and heavily wooded. • Main islands are Hokkaido, Shikoku, Kyushu, and Honshu. • The largest, Honshu, is referred to as Japanese mainland. • None of the populated plains or mountain basins are extensive in area. Kanto Plain, the largest, covers only 13, 000 sq. km (8, 125 sq. miles) and includes Tokyo. • Owing to limited habitable terrain, it has been significantly modified, including land reclamation, artificial islands, and razing of hills and mountains. • Climate varies from tropical in south to cool temperate in north.
Label the map to show main islands, major towns and bodies of water. Source: http: //www. worldatlas. com/webimage/countrys/namerica/caribb/special/caribout. htm
Geography: Hispaniola • Haiti shares the island Hispaniola with the Dominican Republic in greater Antilles archipelago of the Caribbean sea. Haiti occupies western 3/8 th of the island. • Located between the Caribbean Sea and the North Atlantic Ocean, Haiti has a population of around 10. 6 million, and is more densely populated than its neighbour. • Mountains lie across the island can cut off Haiti's rainfall. The northeast trade winds and rain blow in the Dominican Republic's favour. • Environmental degradation and severe deforestation (2% forest coverage) are a major problem in Haiti, but not in its neighbour.
Geography: Haiti • Made worse by climate change, environmental degradation and severe deforestation include accelerated erosion, reduced fertility, decreased water retention, and silting of waterways. • Semiarid climate makes cultivation more challenging. • April–June and October– November are the two rainy seasons. ©Andrew Mc. Connell/Panos Pictures
Label the map to show Haiti, Dominican Republic, major towns and bodies of water. Source: http: //www. worldatlas. com/webimage/countrys/namerica/caribb/special/caribout. htm
Republic of Haiti Map
Disaster hotspots • Almost all of the people in Japan and Haiti are at risk of two or more hazards, so they can be defined as disaster hotspots or multiple hazard zones (MHZs). • An MHZ can expose people to greater risk than elsewhere. • Degg’s model illustrates the disaster interface between hazard, vulnerability and risk: if a vulnerable population is exposed to a hazard where human and natural systems overlap, a disaster can occur. • The greater the scale of an earth process or event and the more vulnerable and exposed the people, the greater the scale of the natural hazard or disaster.
Global Risk Data Platform • Which locations are exposed to more than one hazard? Which regions are most exposed to tectonic events? • Compare and contrast Japan and Haiti. Which hazards is each exposed to? Access the main map of the Global Risk Data Platform: http: //preview. grid. unep. ch/index. php? preview=home&lang=eng • Zoom into Japan and go to layers in the column to the left and select past event, and then earthquakes in that folder. Start adding layers of other natural hazards to visualise the multiple hazards affecting Japan. • Add a screenshot including the legend to a flipboard app or notes. • Now do this again for Haiti. • You may also want to explore the Smithsonian Institute’s This Dynamic Planet Map and the World Risk Index.
• According to the Emergency Events Database EM-DAT, there were three times as many natural disasters between 2000 and 2009 as between 1980 and 1989. • Climate related events account for nearly 80% of the increase. • Both Japan and Haiti have been impacted by the growth of climate-related events. • Tectonic activity is far more frequent in Japan than in Haiti.
Japan: Ring of Fire, typhoons, and snowfall • One of the world’s most exposed countries to natural disasters, and one of world’s most financially exposed to them in absolute terms. • Ring of Fire: major area in the basin of Pacific Ocean where many earthquakes and volcanic eruptions occur. • One of the most tectonically active regions of the world: 20% of the world’s earthquakes, and 10% of the world’s active volcanoes. • A number of typhoons reach Japan from the Pacific every year, and heavy snowfall during winter can cause landslides, flooding and avalanches in snow country regions.
©USGS
Haiti MHZ • In a seismically active area and on the hurricane track, Haiti had not yet recovered from the storms and hurricanes in 2008 when the earthquake struck in 2010. • People are exposed to regular flooding and of periodic droughts. These are made worse by deforestation. • Tectonic plates in Haiti are moving horizontally past one another. Faults run below the most urbanised areas. ©Jeffrey Monnier/MSF
Recent disasters in Japan and Haiti activity • List recent natural disasters in Japan and Haiti. • For recent natural disasters, you can access EMDAT, the international disasters database: http: //www. emdat. be/ • For recent earthquakes within the region, you can access http: //earthquake. usgs. gov/ • Discuss each country’s capacity to deal with them. What were the number of casualties and reasons for them? • Consider location, tectonics, tropical storms, tsunamis, population, economic development, and the natural and built environment.
Recent natural hazards and disasters in Japan 1993 Jul 1995 Jan 2002 Jun 2004 Oct 2006 Jun 2011 Mar 2012 Aug 2014 Sep Earthquake Hokkaido, 230 dead Earthquake Kobe (Great Hanshin), 6, 434 dead Typhoon Chataan, 54 dead Chuetsu earthquake, 40 dead Typhoon Ewinar, 141 dead Earthquake and tsunami Tōhoku (Great East Japan), 15, 893 dead Typhoon Haikui, 105 dead Typhoon Bolaven, 59 dead Volcanic eruption Mount Ontake, 56 dead
Recent natural hazard events in Haiti 2004 May Severe floods, 2, 000 dead 2005 July Hurricane Dennis, 45 dead 2008 Aug/Sep Storms / hurricanes, 800 dead 2010 Jan Earthquake, 200, 000 dead 2012 Nov Hurricane Sandy, 20, 000 homeless 2016 Oct Hurricane Matthew, hundreds dead and thousands homeless
Impacts of climate related and geophysical hazards compared
Human Development Index (HDI) Japan has a very high HDI, and Haiti a very low HDI. Haiti illustrates how natural disasters can make poverty worse, and poverty can make disasters worse. ©UNDP
Population pyramids ©www. populattionpyramid. net
Elements of development Japan Haiti ©MSF Economic High HDI, third largest economy in the world High level of wealth relatively equitably distributed High standard of living High level of insurance Low HDI, one of the world’s smallest economies focused around the capital High social and economic inequality Most living below the poverty line Low level of insurance Chronic lack of funding to certain areas Social Efficient public sector Social protection High-quality, secure housing Enforced earthquake-resistant building codes Population drilled for natural response Very high life expectancy at birth Ageing population Low social cohesion Almost no social protection Unplanned or badly managed urban development Informal settlements and slums in high-risk areas, buildings resilience to hazards Very high population density High rate of literacy, low level of healthcare access Young population Environmental World leader Drought Deforestation and environmental degradation Political Effective government Fragile state: government and institutional systems that do not have the capacity to manage or deliver Flawed and contested elections Risk of political unrest and opportunism. Political corruption NGOs essentially acting as parallel bureaucracies
Why do people live in tectonically active areas? • There are many more people living in potentially hazardous areas than you might expect. Reflect your ideas why people might live in tectonically active areas, jot down your ideas. • Give examples: why do people continue to live in California, Japan or Haiti? • Consider: level of development, awareness of risks, risks versus benefits, history of tectonic activity. • Discuss with a classmate their reasons and yours. • Join with another pair, discuss and record all the ideas why people live in tectonically active areas.
Acceptance approach Roots / inertia: family, friends, history, always lived there. Cost-benefit. Advantages seem to outweigh the risks. Faustian Pact. Resources / landscape: 3, 000 year-old Bam, Iran rebuilt on fault lines five or six times, because fault gives ready access to water in otherwise dry region. People also stayed after the Philippines 2013 Bohol earthquake because of fertile soils. Economic / climate reasons: existing or better livelihoods and economic resources great weather than elsewhere (e. g. , California, USA). Why do people live in areas at risk of natural hazards? Adaptation approach Modify human vulnerability: disaster risk reduction such as earthquake resilient buildings and infrastructure; training; early warning systems (e. g. , Japan, Chile, New Zealand). Fatalistic approach Accept that will be, will be. God’s will. Or that “it won’t happen to me. ” Lack of awareness of risk: volcanic eruptions and earthquakes are unpredictable and infrequent, so risk can be underestimated. Many will not have experienced one in their lifetime (e. g. , Haiti 2010). Lack of choice / inability to move to a safer location; nowhere to go; old age; lack of finances, health issues.
Awareness, perception and approach • Meteorological hazards regularly feature in Japan and Haiti, so people are very aware, affected and adapt as resources allow in both settings. • Japan: people tend to be aware of all types of hazards, accept the risk, and have the resources to adapt. It takes an adaptation approach. • Haiti: before 2010, more aware of hazards that were frequent such as hydro-meteorological than rare events such as earthquakes. Haiti takes a fatalistic approach.
©UN-Spider
Risk • Unlike in Japan, people in Haiti were mostly not aware of their risk of earthquakes before the earthquake struck in 2010. They probably had neither experienced one in their lifetimes, nor been taught about them in school. Without living memory, people may underestimate the risk. • In both Japan and Haiti, people might choose the benefits over the risks. The main draw to cities in seismically active and coastal areas are economic and other opportunities concentrated there. • Risk varies by setting: • more versus less developed countries. • rural versus urban. • urban planning versus slums.
Where are most people at risk of dangerous seismic activity? ©Benjamin Henning’s Population at Risk cartogram: highly populated areas along all plate margins stand out in bright red: • Clusters in of earthquakes in bands around the Pacific Ocean; along the west coast of North and South America – includes Japan • A prominent hot-spot in the Caribbean – includes Haiti • A cluster in Southern Europe and a line running across southern Europe, the Middle East and Central Asia
Exposure • Risk of hazards is greater in Japan than in Haiti. • Japan is the only developed country with a disaster risk of more than 10% due to its extreme exposure to natural hazards. • Markedly higher than Haiti’s exposure, Japan’s exposure is 4 th highest in the world.
Vulnerability • Vulnerability is determined by processes in the natural environment and by places, people and power. Power relations and inequalities are central to the concept. • Japan is a world leader not only in risk, but also in economic output and disaster preparedness, and it draws on resources of all kinds to reduce the vulnerability of its population. But it has many elderly, who like disabled, are more vulnerable than others. • Haiti illustrates how vulnerability tends to increase the lower the country’s economic development and socio-political stability.
Disaster risk equation • The risk of disaster grows as global hazards and people’s vulnerability increases, while its capacity to cope decreases. • Japan has increased its capacity to cope by learning from disasters such as the Kobe earthquake in January 1995 and others. • Haiti has the most dangerous combination: high exposure to hazards and climate change coincides with significant vulnerability within its society.
Capacity to cope • Capacity to cope depends on level of development and commitment to preparedness. • It can determine whether a high-magnitude earthquake will cause hundreds of deaths, such as in Chile in 2010, or hundreds of thousands such as in Haiti in the same year. • Japan is resilient, able to flourish in the face of disaster risk. It minimises vulnerabilities and disaster risks throughout society. • It draws on capacity, strengths and resources available to anticipate, cope with, resist and recover from disasters. • Its coping capacity positions the country well to face and manage disasters and to continue to thrive.
“The disaster potential we see in Haiti…is not only driven by the strength of the hazard, which is very strong of course, but also by the real lack of coping capacity and the very high fragility and susceptibility within society. ” – Dr Matthias Garschagen, World Risk Report ©Andrew Mc. Connell/Panos Pictures
Disaster risk: Japan and Haiti
World Risk Index: Japan’s exposure to natural hazards is so high that its disaster risk is still high even though its vulnerability is relatively low. Haiti’s risk of natural hazards is not as high as Japan’s, but its vulnerability is so high and its coping capacity so low that its disaster risk is still very high.
World Risk Report: Japan • Extreme exposure is mitigated, but not fully compensated by low vulnerability. • Japan ranks 17 th for overall risk (mainly due to earthquakes and floods). It ranks highest of all developed nations in World Risk Index (2016), because of its high exposure. • Exposure much higher in Japan than Haiti: 45. 91% compared to 16. 25% respectively. • Heavy investment in preparedness reduces loss of life, supports affected communities, and makes economy more resilient. • Aging population, physically less able to evacuate to seek higher ground.
World Risk Report: Haiti • World Risk Index (2016) rank high at 21 st even though exposure markedly lower than Japan. This is because of high rank for: – – lack of coping capacity: 3 rd highest for vulnerability: 5 th susceptibility: 7 th; lack of adaptive capacities: 13 th • Failures of development, rapid increase of population, urbanisation, poverty, poor governance, deforestation, lack of preparedness drive up risk. • Every factor considered to assess vulnerability worst it can be.
Urban risk: Japan • Urbanisation is a critical factor in disaster risk, affecting susceptibility, coping capacity and adaptive capacity. • Urbanised, Tokyo is the largest city in the world. • Three-quarters of 126 million people live in sprawling, coastal cities. • Good economic provision, services and infrastructure mitigate urban risk. • Urban areas and strong growth of cities are prioritised in risk assessment and risk reduction.
Urban risk: Haiti • Uncoordinated and high urban growth and unplanned development compound urban poverty and sprawling informal settlements and slums in hazard-exposed areas and urban wastelands. • High-density urban centres, high-risk building structures, limited investment in social and physical infrastructure, healthcare, water and sanitation, power supplies, and education also drive up disaster risk, especially in the capital Port-au-Prince. ©UN Habitat
Compared to Japan, Haiti’s urban areas are much more vulnerable and at higher risk, because many Haitians are living in very high-risk geographical areas and conditions.
Disaster management cycle Designed to reduce the impacts of natural hazards through preparedness, mitigation, prevention, and adaptation ©FAO
Mitigation • The best way of dealing with a natural hazards is before they occur. • Mitigation measures especially long-term management of economic and urban development in seismic areas were highly developed in Japan and largely absent in Haiti. • Mitigation is about preventing hazards from becoming disasters or lessening their effects primarily through reducing vulnerability, as the hazards themselves largely cannot prevented or predicted.
Minimising the effects of disaster: Japan Modify Earthquakes Event Not possible Human vulnerability Aseismic buildings Ground shaking and liquefaction mapping Earthquake education and drills Fire protection Emergency services But prediction not possible Tsunami Coastal defences Coastal zone and land-use planning Sea walls and water discharge tunnel Hazard maps Safety guidelines Evacuation procedures Emergency kits, food supplies and shelters Warning and prediction systems Engineering Loss © MSF Includes immediate rescue efforts followed by relief efforts (food, water, sanitation) Insurance, which people are urged to take out in MEDCs, while expensive, can support recovery Long-term reconstruction
Preparedness: Japan • Japan has a long history of preparedness, including collecting historic records of earthquakes and using geological and soil maps to identify past tectonic activity. • Japan mapped areas of high risk. It has developed a comprehensive plan for preparing against disasters, which includes the Central Council for Accident Prevention chaired by prime minister, a set of cohesive rules for immediate response, an advanced research system, and extensive public training in disaster response.
Tokyo: very exposed and prepared • Even though it is the second most exposed city to natural disasters in the world, Tokyo is well prepared. Eightyseven percent of buildings, including skyscrapers, are reportedly built to withstand earthquakes. • Two examples to highlight the level of resources an MEDC like Japan can devote to disaster preparedness: • Tokyo Skytree, a towering 634 m structure. • innovative, cavernous water discharge tunnel on the outskirts of Tokyo. ©Kakidai
Preparedness: Haiti • Level of development and governance are important in understanding disaster impact, vulnerability, and resilience. • Resources are limited to reduce vulnerability. People may consider preparing and planning less of a priority, especially for a high-impact and lowprobability event such as an earthquake. • Institutional disaster preparedness is poor: small, hurricane-focused disaster bureau and a couple of fire stations. • It relies on aid to boost its resilience and capacity to cope with natural hazards.
Insurance: Japan and Haiti • Japan and Haiti differ not only in vulnerability, but also in insurance cover. • Even in MEDC with relatively high insurance penetration such as Japan, households and businesses rely heavily on public assistance after disasters. • Haiti took out an earthquake policy as part of the Caribbean Catastrophe Risk Insurance Facility (CCRIF), the world’s first multicountry catastrophe insurance pool.
Médecins Sans Frontières Doctors Without Borders (MSF) Visit our website: www. msf. org. uk About MSF: http: //www. msf. org. uk/about. aspx Email us: schools@london. msf. org Find us on facebook: www. facebook. com/MSF. english Follow us on Twitter: www. twitter. com/MSF_UK Follow us on Youtube: www. youtube. com/user/MSFUK 49