Teaching Mathematical Modeling with the Suez Canal Problem

Teaching Mathematical Modeling with the Suez Canal Problem CHRISTINE BELLEDIN TEACHING CONTEMPORARY MATHEMATICS JANUARY 2017

What is mathematical modeling? Mathematical Modeling is when you use mathematics to understand a situation in the real world, and perhaps use it to take action or even predict the future, and where both the real world situation and the ensuing mathematics are taken seriously. “What is Mathematical Modeling” H. Pollak, Teachers College, Columbia University

What is mathematical modeling? According to the Common Core Standards for High School: Modeling is the process of choosing and using appropriate mathematics and statistics to analyze empirical situations, to understand them better, and to improve decisions.

The Modeling Process Identify and specify the problem to be solved Make assumptions and define essential variables Create and solve the mathematical model Implement the model and report the results Iterate as needed to refine and extend the model Analyze and assess the model and the solutions

The Modeling Process Identify the Problem – We identify something in the real world we want to know, do, or understand. Make Assumptions and Identify Variables – We select ‘objects’ that seem important in the real world question and identify relations between them. We decide what we will keep and what we will ignore about the objects and their interrelations, resulting in an idealized version of the original question. Create the Model –We translate the idealized version into mathematical terms and obtain a mathematical formulation of the idealized question: this is the mathematical model.

The Modeling Process Solve the Model – We do the math to see what insights and results we get. Analyze and Assess Solution – Does it address the problem? Does it make sense when translated back into the real world? Are the results practical, the answers reasonable, the consequences acceptable? Iterate – We iterate the process as needed to refine and extend our model. Implement the Model – For real world practical applications we then need to report our results to others and implement the solution.

Keys to Modeling Create the simplest form of the problem that contains the essence of the problem. Use your basic solution and the iterative process to add more reality to your initial solution. Pay close attention to errors. Try to understand why, how, and by how much they are wrong.

Modeling Traffic Flow in the Suez Canal Jeff Griffiths Cardiff University, Wales BS, Mathematics MS, Statistics Ph. D, Stochastic Processes

After the Six-Days War in 1967 The Suez Canal was heavily mined and was closed to all traffic for 10 years. The British eventually cleared the canal of all mines and the Egyptian government and the Suez Canal Authority hired mathematician Jeff Griffiths and his group from Cardiff University to explore the optimal organization for traffic in the canal.

Crucial to the Egyptian Economy At the time of its closure, the canal contributed more than 50% of the funds to the treasury of Egypt. Each ship paid an average of $100, 000 for transit through the canal. At the time, on average, 67 ships transited the canal each day taking 10 14 hours for passage.

NORTH Mediterranean Sea Port Said Ballah Bypass Capacity: 17 ships Bitter Lakes Capacity: 36 ships SOUTH Red Sea Port Tewfik
 21 meters")
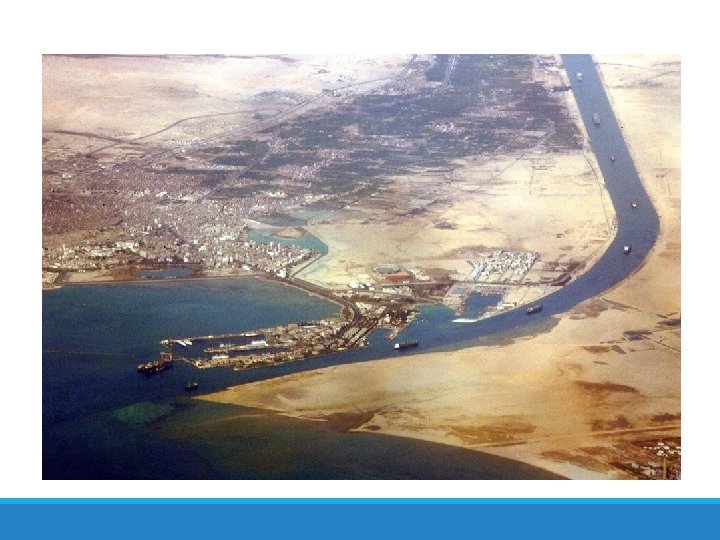
The Suez Canal 163 kilometers long 169 meters wide (for ship travel) 21 meters deep The distance between Jeddah (Saudi Arabia) and the port of Constanza (Black Sea) is 11, 771 miles via the Cape of Good Hope, but only 1, 698 miles via the Suez canal, a saving of 86% in distance. Almost 7% of sea transported world trade passes through the Suez canal each year.

Convoy System The width of 169 meters in width is not enough to allow passage in both directions. As a result, the ships must travel, in convoys either North‑South or South‑North and pass each other at anchorage. Gen erally, the demand for passage is the same in both directions.

Two Convoys going North South Convoy B NORTH Mediterranean Sea Port Said Ballah Bypass Capacity: 17 ships Convoy A Bitter Lakes Capacity: 36 ships One Convoy going South North Convoy C SOUTH Red Sea Port Tewfik

No Passing in the Canal The N S Convoy and the S N Convoy can pass each other only in the Bitter Lakes and the Ballah Bypass. The N S Convoy must be anchored to buoys in the canal while the S N Convoy passes.

NORTH Mediterranean Sea Port Said Ballah Bypass Capacity: 17 ships Bitter Lakes Capacity: 36 ships SOUTH Red Sea Port Tewfik

NORTH Mediterranean Sea Port Said Ballah Bypass Capacity: 17 ships Bitter Lakes Capacity: 36 ships SOUTH Red Sea Port Tewfik

NORTH Mediterranean Sea Port Said Ballah Bypass Capacity: 17 ships Bitter Lakes Capacity: 36 ships SOUTH Red Sea Port Tewfik New cycle can restart while Convoy B from previous cycle completes passage through the canal

Conditions for the Model 1. At most 36 in 1 st N S Convoy (Convoy A). 2. At most 17 in 2 nd N S Convoy (Convoy B). 3. Same number of ships N S and S N each day. 4. Schedule must repeat every 24 hours.

Jeff Griffith’s Task Build a model to capture the current convoy process. Determine the maximum number of ships that can transit the canal each day. Vary the model to consider a variety of options. Compare the cost and effectiveness of the various modifications.

Keys to Modeling Create the simplest form of the problem that contains the essence of the problem. Use your basic solution and the iterative process to add more reality to your initial solution. Pay close attention to errors. Try to understand why, how, and by how much they are wrong.

Standard Ship Model What assumptions can we make to simplify the problem enough to make it reasonable, but not too much so that we lose important features of the problem? Speed of all ships is constant at 14 km/hr. Separation for all ships is 10 minutes. Ignore (initially) acceleration and deceleration for docking. Zero time docking and undocking.

Modeling a Ship’s Transit The Ballah Bypass is 10 kilometers in length, stretching from the 50 to 60 kilometer mark south of Port Said. The Bitter Lakes extend for 20 kilometers, from 100 to 120 kilometers south of Port Said.

A ship moves to Bitter Lakes

A 10 -ship Convoy A

Why doesn’t this work?

Much better!
. 2. At")
1. At most 36 in 1 st N S Convoy (Convoy A). 2. At most 17 in 2 nd N S Convoy (Convoy B). 3. Same number of ships N S and S N each day. 4. Schedule must repeat every 24 hours. 5. 14 km/hr & 10 minute separation

What is the First Natural Question? 1. At most 36 in 1 st N S Convoy (Convoy A). 2. At most 17 in 2 nd N S Convoy (Convoy B). 3. Same number of ships N S and S N each day. 4. Schedule must repeat every 24 hours. 5. 14 km/hr & 10 minute separation.

Why Not 106 Ships?

It doesn’t work by how much?

We are about 30 ships too long!

First, create a solution, then optimize.

What are the invariants?

What are the Invariants?

Time for Convoy A to reach Bitter Lakes: 100/14 = 7. 14 Length of yellow region (in hours): 24 – 2(7. 14) = 9. 72 Length of yellow region (in minutes): 9. 72(60)/10 = 58. 3 Turn this into number of ships! 59 Ships in Convoys A and C.

A Little Algebra Helps If we let A, B, and C represent the number of ships in Convoy A, Convoy B, and Convoy C, respectively, we require that A + B = C and A + C = 59 with B = 17.

Analytic solution to the $1, 000 system of equations. A + B = C, B = 17, A + C = 59 yields A = 21, B = 17, and C = 38 Total of 76 Standard ships per day.

A = 21 B = 17 C = 38
 Traveling at 16 km/hr, the first")
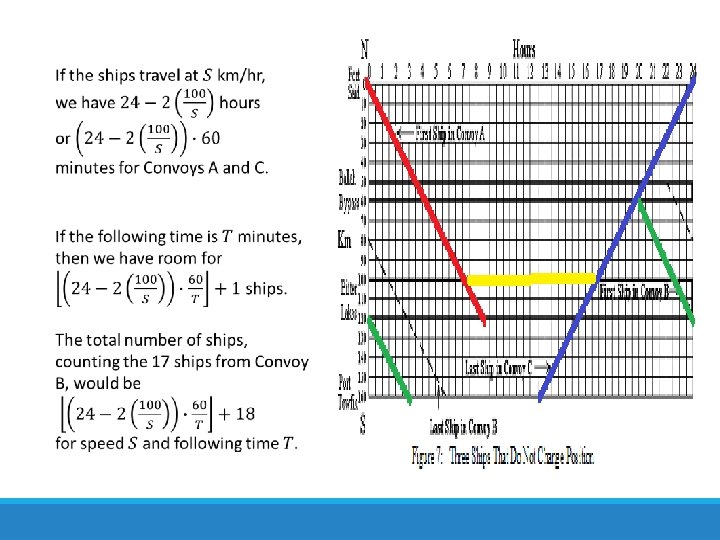
Change Speed? 16 km/hr & 12 min (1) Traveling at 16 km/hr, the first ship in Convoy A must arrive at the 100 km mark at 6. 25 hours. (2) The symmetry of the problem requires the last ship in Convoy C to be at the 100 km mark at 24 – 6. 25 = 17. 75 hours. So, we have 11. 5 hours of transit time to share between Convoys A and C. If the ships are 12 minutes apart, we have room for 58 ships. Then 58 + 17 = 75 ships can make the transit in 24 hours.

The Rest of the Story This is a real problem solved by real people. Mathematics isn’t the final arbiter of what is “best”. People always have to accept the results.

The Rest of the Story Jeff Griffiths presented his results to the head of the Suez Canal Authority, Meseur, comparing a variety of alternative to the standard model. Completing his work, he returned to Wales. But Jeff kept thinking that he had missed something simple.

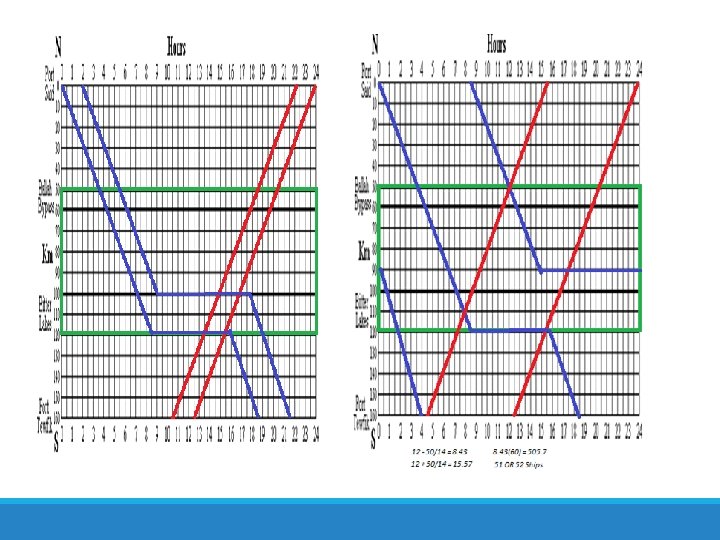
A 48 Hour Schedule

The Rest of the Story Jeff presents his results to Meseur listened carefully and at the end of Jeff’s presentation, said politely…

The Rest of the Story Absolutely Not! The Suez Canal has run on a 24 hour schedule every day since 1869. It is impossible to even think of it. Professor Griffiths returned to Wales in despair.

Misfortune Strikes the Canal
 “We have this")
How to Clear the Backlog? Meseur (Head of Suez Canal Authority) “We have this terrible problem. Ships are stacked up at both ends of the canal and it will take weeks to move them all through. What can we do? ” “…and then I had an idea. ”

“If we ran the canal on a 48 hour schedule, we could significantly increase the number of ships passing through the canal. ” “So, I ordered that we use the 48 hour schedule until the backlog was clear, then return to the 24 hour schedule. ”

What I like about this problem: • This is a real problem. • The problem is complicated enough to be interesting but simple enough for students to grasp the situation quickly. • This problem requires students to apply some of the key mathematical modeling techniques. • The problem can be easily and naturally modified to suit the goals of your class and knowledge and modeling experience of your students.

Questions or Comments?
- Slides: 55