Teacher Evaluation and EVAAS Tomberlin Director School Research

Teacher Evaluation and EVAAS Tomberlin Director, School Research, Data, and Reporting June 13, 2018

Teacher Evaluation in North Carolina

Student and School Growth • STUDENT GROWTH: Teachers contribute to the academic success of students. • The work of the teacher results in acceptable, measurable progress for students based on established performance expectations using appropriate data to demonstrate growth. It is the intent of the State Board of Education to provide educators a state-wide, standardized measure of student growth for the purpose of promoting professional growth for educators, guiding school improvement efforts, and informing educator evaluation processes. • Beginning with the 2016 -2017 school year, Student Growth will no longer be a stand-alone standard in the NC teacher evaluation process. All processes related to the determination of student growth estimates for teachers and schools will continue. • Determining Student Growth with Statewide Method • A teacher’s rating on the student growth measure is determined by a student growth value as calculated by the statewide growth model for educator effectiveness. The measures of student learning - End-of-Course assessments, End-of-Grade assessments, Career and Technical Education Post-Assessments, NC Final Exams, K-3 Checkpoints, and Analysis of Student Work provide the student data used to calculate the growth value or performance rating. • See NCSBE policy EVAL-030 for similar language regarding School Growth North Carolina State Board of Education Policy EVAL-006, Revised 2016 -04 -07

Measuring Teacher Effectiveness • Although student and school growth no longer has a direct impact on a teacher’s or administrator’s evaluation, the state will continue to develop a measure of teacher and administrator effectiveness that incorporates growth. • The state will continue to report to the federal and state governments the percentage of teachers and administrators in the categories of Highly Effective, and In Need of Improvement. • The NC State Board of Education will continue to use the effectiveness status of teachers to populate measures in its strategic plan. • Given that student and school growth is no longer tied to an individual’s evaluation, the state will calculate three year averages for teachers and administrators regardless of whether the employee changes districts. • Student and school growth (both single and three year measures) will continue to be used for research and analytic purposes.

Teacher Effectiveness and Charter Schools • Charter schools are required to administer EOG/EOCs by SBE policy. • Charter schools may administer NCFEs and Reading 3 D at their discretion. If a charter uses these assessments, they also agree to use the results in the state’s growth model for schools and teachers. • Charter schools must complete roster verification for any state assessments that they administer. • Beginning with the 2018 -19 school year, teachers, school administrators, and district administrators will be required to affirm that rosters are accurate to the best of the individual’s knowledge. • Charter school must verify that licensed teachers are “proficient” or better on their summative evaluation in order to renew a continuing license.
")
Growth in Educator Evaluation Student/School Growth Educator Evaluation (Standards 1 -5 or 1 -7) Collected Artifacts Student/Parent/Teacher Surveys Peer Observation/Feedback

Understanding EVAAS Growth

Estimating Student Growth Students’ Observed Scores Student Growth Estimate Students’ Predicted Scores Calculate Standard Error Difference between observed and predicted Differences aggregated to teacher level Divide growth estimate by standard error Student Growth Index

Estimating Student Growth Does Not Meet Expected Growth Meets Expected Growth Exceeds Expected Growth

Proficiency and EVAAS • How can a school increase proficiency rates by X percentage points but not meet growth? Prior Year Score Prior Year NCE Current Year Score Current Year NCE Student A 229 54 231 55 1 Student B 250 62 238 57 -5 Student C 255 64 236 56 -8 Student D 226 53 230 54 1 Student E 228 54 232 55 1 Student F 243 59 235 56 -3 Student G 225 52 230 54 2 Student H 231 55 230 54 -1 Student I 227 53 220 50 -3 Student J 235 56 230 54 -2 Proficiency = 230 Prior Year Current Year % Proficient = 50% %Proficient = 90% Growth Mean -1. 7 Std Dev 3. 2 Std Error 0. 8 Index -2. 1

Does Evaluation Matter?

Does Evaluation Matter?

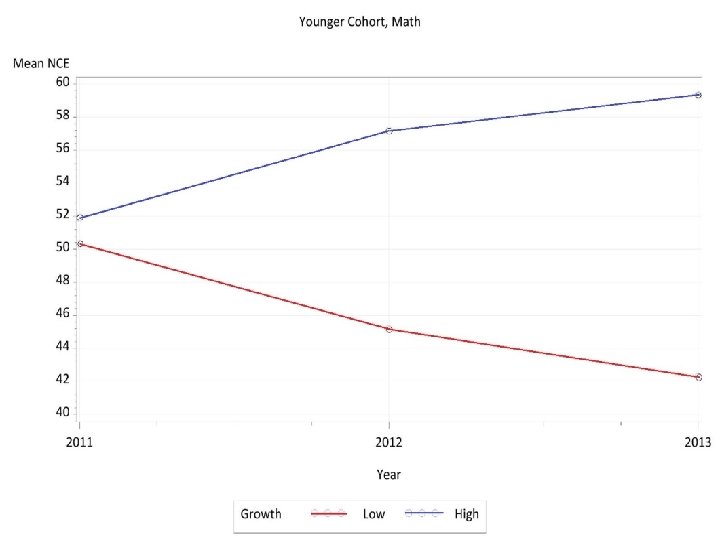
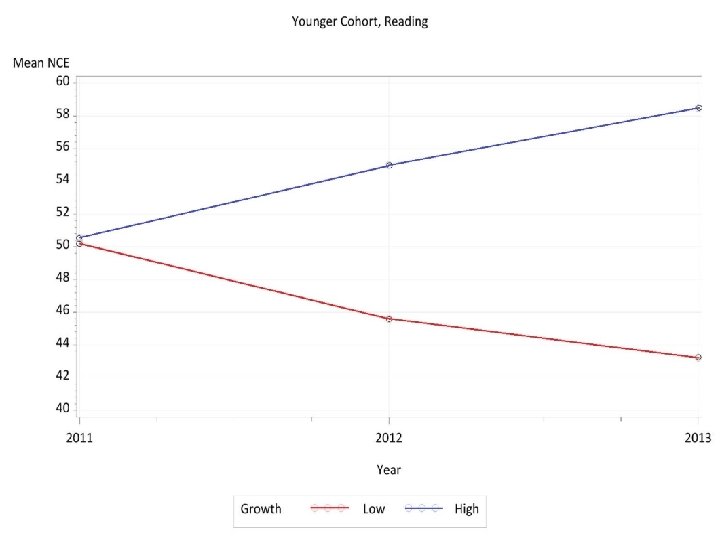
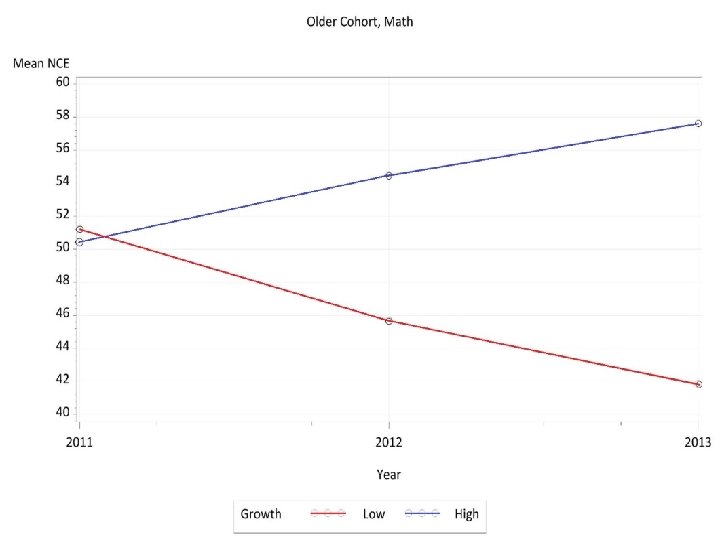
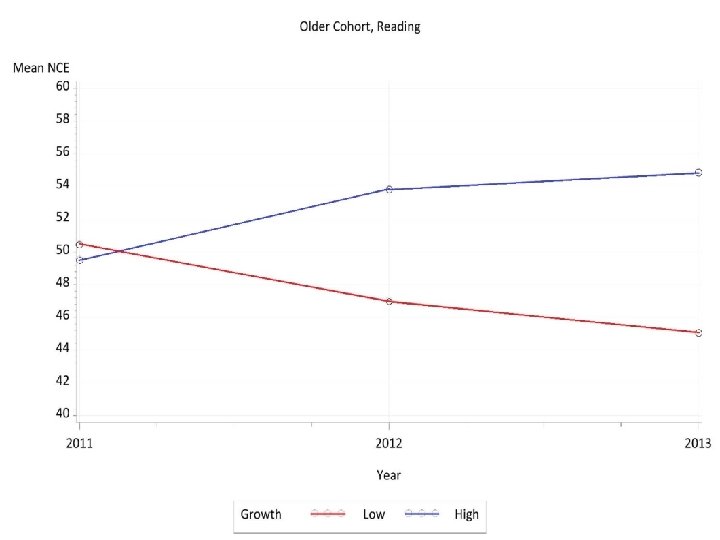
Does Growth Matter? • Two groups of students captured: • Younger Cohort: began Grade 5 in SY 2010 -11 • Older Cohort: began Grade 6 in SY 2010 -11 Low 1 Younger Older 1 Students 2 Students High 2 Math Reading Math 1935 184 1560 1825 221 1547 Reading 183 301 in the “Low Growth” category have consecutive years of teachers in the Does Not Meet Expected Growth category in the “High Growth” category have consecutive years of teachers in the Exceeds Expected Growth category

Evaluation and Change in Growth
![Average Index Score of Teachers 5 4 [VALUE]0 3 [VALUE]*** 2, 51 2 1](http://slidetodoc.com/presentation_image_h2/45919affc5891a7de2e35c1e43bd1da0/image-19.jpg "Average Index Score of Teachers 5 4 [VALUE]0 3 [VALUE]*** 2, 51 2 1")
Average Index Score of Teachers 5 4 [VALUE]0 3 [VALUE]*** 2, 51 2 1 0, 04 [VALUE]*** [VALUE]0*** Does Not Meet Expected Growth (3027) 0 Meets Expected Growth (11990) Exceeds Expected Growth (3858) [VALUE]*** -1 [VALUE]*** -2 -3 -3, 81 -4 -5 Avg 2012 Index Avg 2013 Index Avg 2014 Index

Strengthening the Evaluation System?

Multiple Measures to Ensure Accuracy Principal Observation Content Expert Feedback Principal Feedback Teacher Effectiveness Content Expert Observation Student Growth Data Student Feedback

Questions, Comments, and Feedback Thomas R. Tomberlin Director, District HR Support thomas. tomberlin@dpi. nc. gov 919 -807 -3440
- Slides: 22