
Teach A Level Maths Statistics 1 Spearmans Rank


- Slides: 19
“Teach A Level Maths” Statistics 1 Spearman’s Rank Correlation Coefficient © Christine Crisp
Spearman’s Rank Correlation Coefficient Statistics 1 OCR "Certain images and/or photos on this presentation are the copyrighted property of Jupiter. Images and are being used with permission under license. These images and/or photos may not be copied or downloaded without permission from Jupiter. Images"
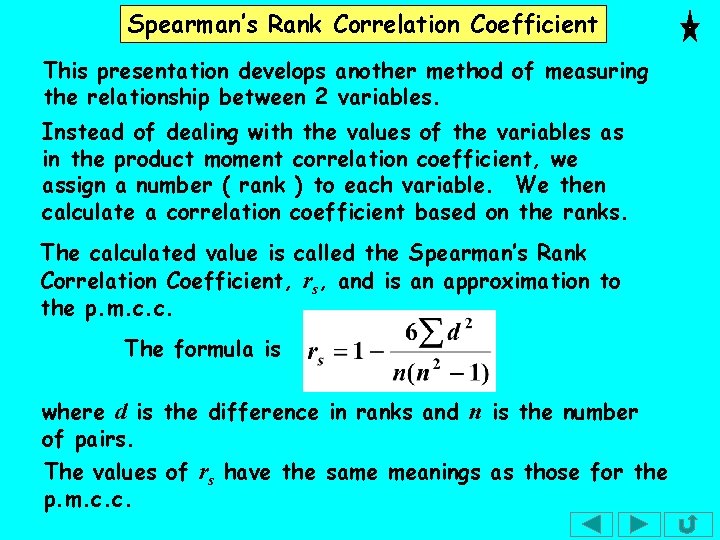
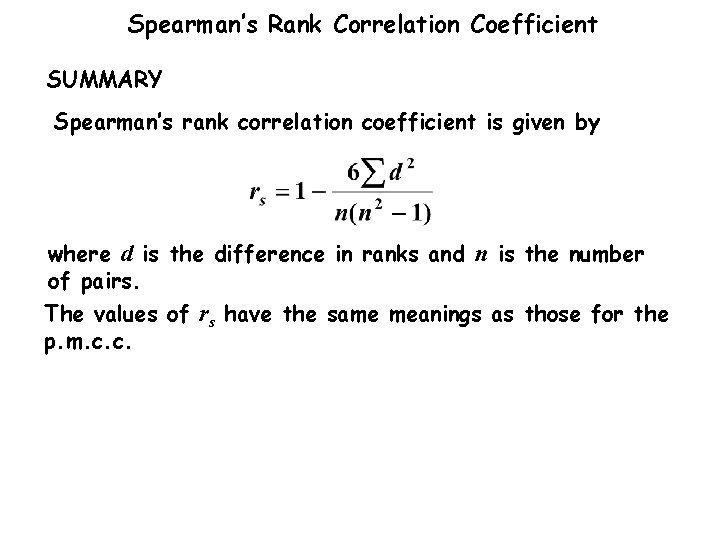
Spearman’s Rank Correlation Coefficient This presentation develops another method of measuring the relationship between 2 variables. Instead of dealing with the values of the variables as in the product moment correlation coefficient, we assign a number ( rank ) to each variable. We then calculate a correlation coefficient based on the ranks. The calculated value is called the Spearman’s Rank Correlation Coefficient, rs, and is an approximation to the p. m. c. c. The formula is where d is the difference in ranks and n is the number of pairs. The values of rs have the same meanings as those for the p. m. c. c.
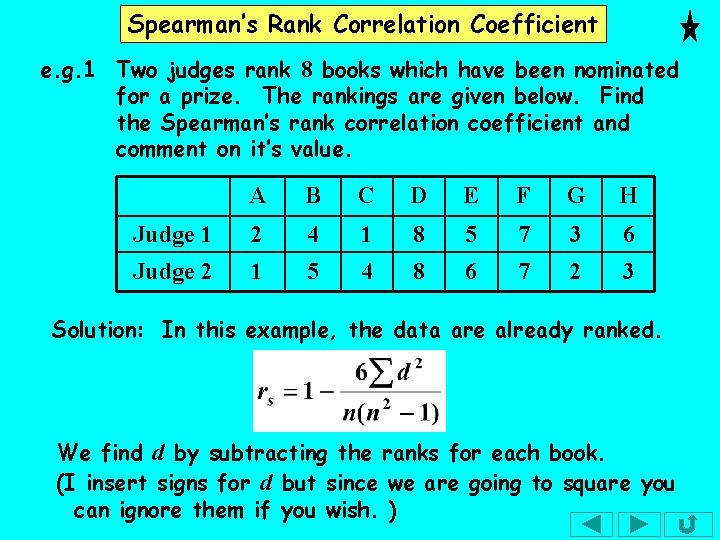
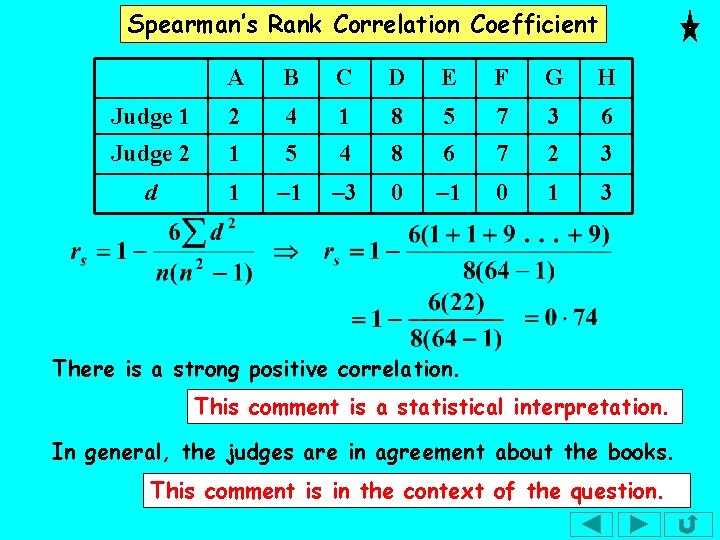
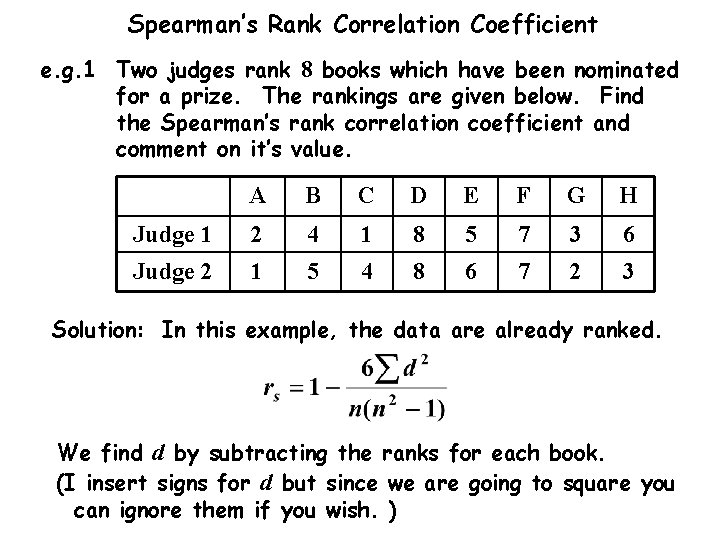
Spearman’s Rank Correlation Coefficient e. g. 1 Two judges rank 8 books which have been nominated for a prize. The rankings are given below. Find the Spearman’s rank correlation coefficient and comment on it’s value. A B C D E F G H Judge 1 2 4 1 8 5 7 3 6 Judge 2 1 5 4 8 6 7 2 3 Solution: In this example, the data are already ranked. We find d by subtracting the ranks for each book. (I insert signs for d but since we are going to square you can ignore them if you wish. )
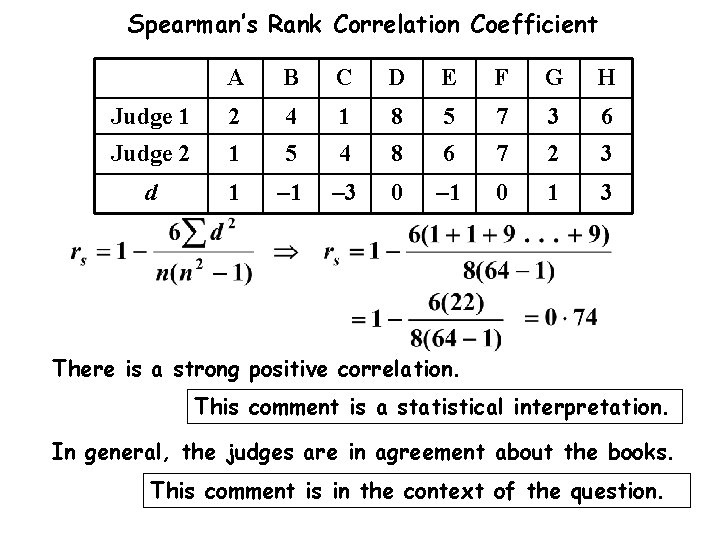
Spearman’s Rank Correlation Coefficient A B C D E F G H Judge 1 2 4 1 8 5 7 3 6 Judge 2 1 5 4 8 6 7 2 3 d 1 -1 -3 0 -1 0 1 3 There is a strong positive correlation. This comment is a statistical interpretation. In general, the judges are in agreement about the books. This comment is in the context of the question.
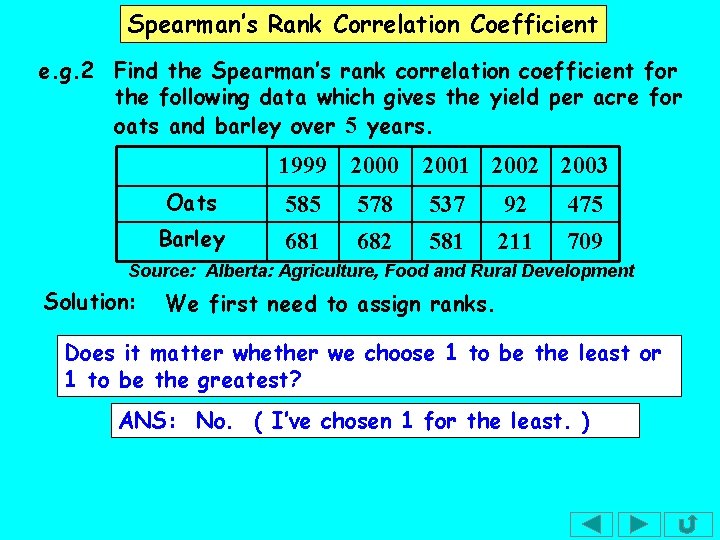
Spearman’s Rank Correlation Coefficient e. g. 2 Find the Spearman’s rank correlation coefficient for the following data which gives the yield per acre for oats and barley over 5 years. 1999 2000 2001 2002 2003 Oats 585 578 537 92 475 Barley 681 682 581 211 709 Source: Alberta: Agriculture, Food and Rural Development Solution: We first need to assign ranks. Does it matter whether we choose 1 to be the least or 1 to be the greatest? ANS: No. ( I’ve chosen 1 for the least. )
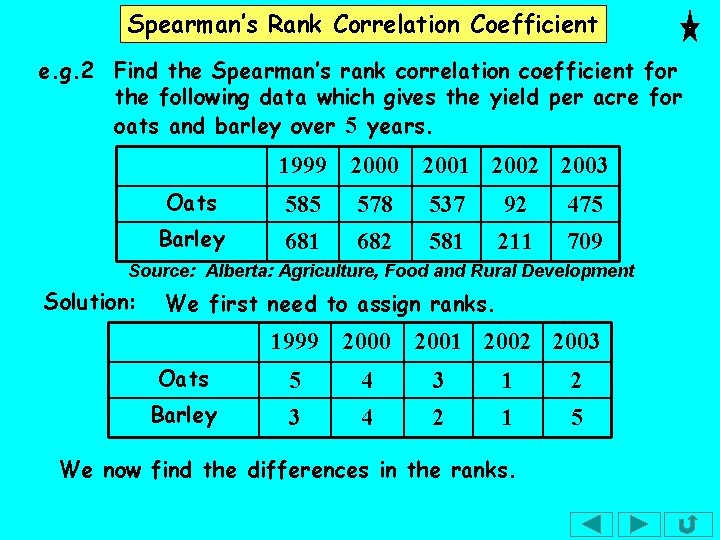
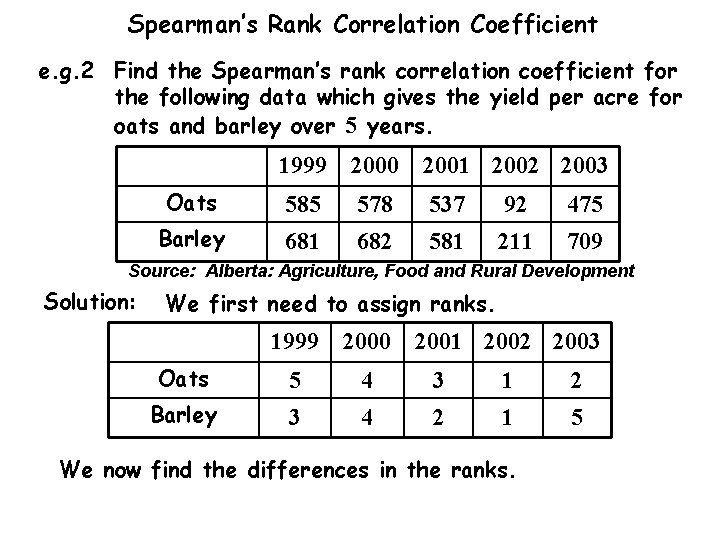
Spearman’s Rank Correlation Coefficient e. g. 2 Find the Spearman’s rank correlation coefficient for the following data which gives the yield per acre for oats and barley over 5 years. 1999 2000 2001 2002 2003 Oats 585 578 537 92 475 Barley 681 682 581 211 709 Source: Alberta: Agriculture, Food and Rural Development Solution: We first need to assign ranks. 1999 2000 2001 2002 2003 Oats 5 4 3 1 2 Barley 3 4 2 1 5 We now find the differences in the ranks.
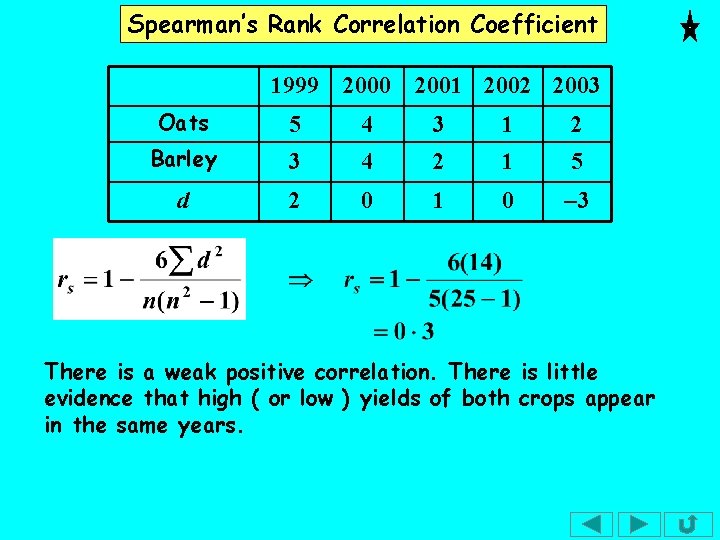
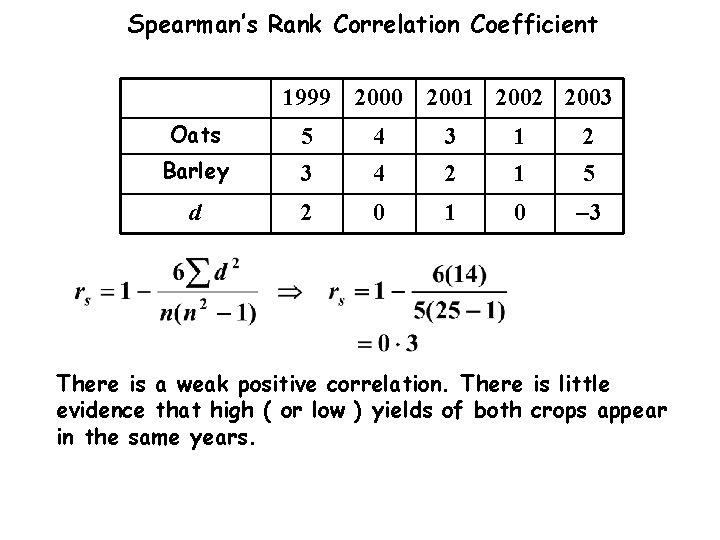
Spearman’s Rank Correlation Coefficient 1999 2000 2001 2002 2003 Oats 5 4 3 1 2 Barley 3 4 2 1 5 d 2 0 1 0 -3 There is a weak positive correlation. There is little evidence that high ( or low ) yields of both crops appear in the same years.
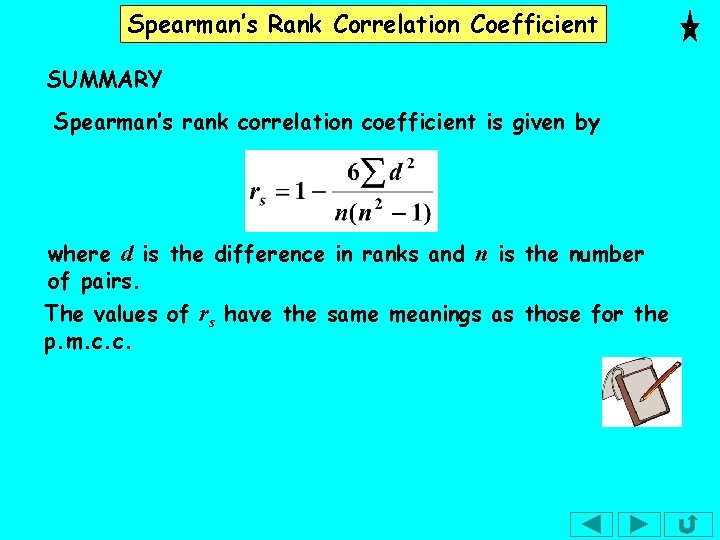
Spearman’s Rank Correlation Coefficient SUMMARY Spearman’s rank correlation coefficient is given by where d is the difference in ranks and n is the number of pairs. The values of rs have the same meanings as those for the p. m. c. c.
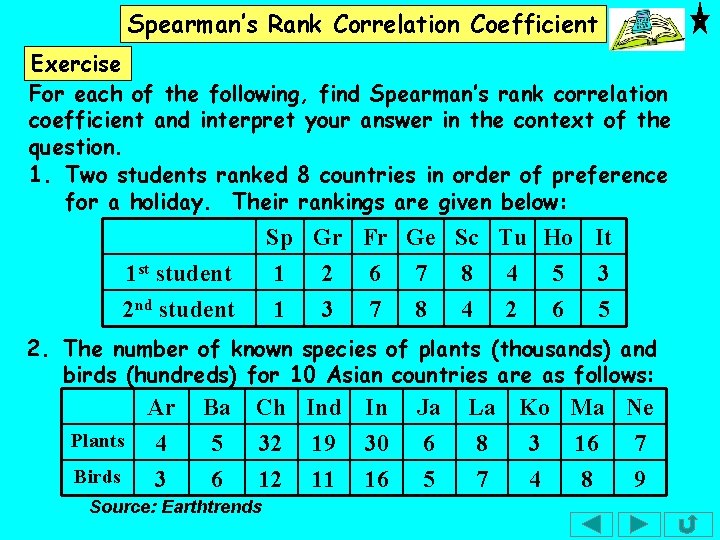
Spearman’s Rank Correlation Coefficient Exercise For each of the following, find Spearman’s rank correlation coefficient and interpret your answer in the context of the question. 1. Two students ranked 8 countries in order of preference for a holiday. Their rankings are given below: Sp Gr Fr Ge Sc Tu Ho It 1 2 6 7 8 4 5 3 1 3 7 8 4 2 6 5 1 st student 2 nd student 2. The number of known species of plants (thousands) and birds (hundreds) for 10 Asian countries are as follows: Ar Plants 4 Birds 3 Ba 5 6 Ch Ind In 32 19 30 12 11 16 Source: Earthtrends Ja 6 5 La Ko Ma Ne 8 3 16 7 7 4 8 9
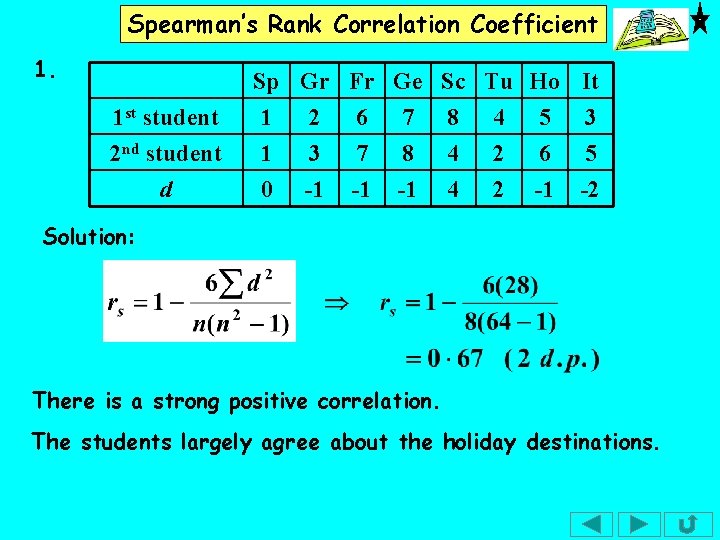
Spearman’s Rank Correlation Coefficient 1. 1 st student 2 nd student d Sp Gr Fr Ge Sc Tu Ho It 1 2 6 7 8 4 5 3 1 3 7 8 4 2 6 5 0 -1 -1 -1 4 2 -1 -2 Solution: There is a strong positive correlation. The students largely agree about the holiday destinations.
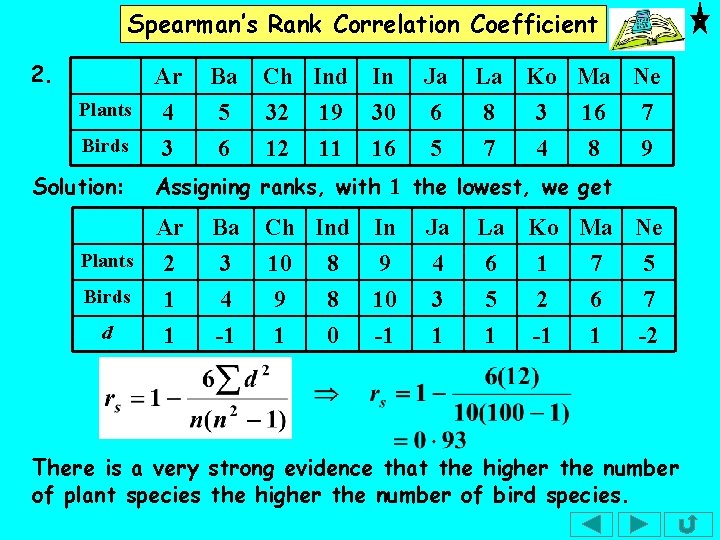
Spearman’s Rank Correlation Coefficient 2. Ar Plants 4 Birds 3 Solution: Ba 5 6 Ch Ind In 32 19 30 12 11 16 Ja 6 5 La Ko Ma Ne 8 3 16 7 7 4 8 9 Assigning ranks, with 1 the lowest, we get Ar Plants 2 Birds 1 d 1 Ba 3 4 -1 Ch Ind In 10 8 9 9 8 10 1 0 -1 Ja 4 3 1 La Ko Ma Ne 6 1 7 5 5 2 6 7 1 -1 1 -2 There is a very strong evidence that the higher the number of plant species the higher the number of bird species.
Spearman’s Rank Correlation Coefficient The following slides contain repeats of information on earlier slides, shown without colour, so that they can be printed and photocopied. For most purposes the slides can be printed as “Handouts” with up to 6 slides per sheet.
Spearman’s Rank Correlation Coefficient SUMMARY Spearman’s rank correlation coefficient is given by where d is the difference in ranks and n is the number of pairs. The values of rs have the same meanings as those for the p. m. c. c.
Spearman’s Rank Correlation Coefficient e. g. 1 Two judges rank 8 books which have been nominated for a prize. The rankings are given below. Find the Spearman’s rank correlation coefficient and comment on it’s value. A B C D E F G H Judge 1 2 4 1 8 5 7 3 6 Judge 2 1 5 4 8 6 7 2 3 Solution: In this example, the data are already ranked. We find d by subtracting the ranks for each book. (I insert signs for d but since we are going to square you can ignore them if you wish. )
Spearman’s Rank Correlation Coefficient A B C D E F G H Judge 1 2 4 1 8 5 7 3 6 Judge 2 1 5 4 8 6 7 2 3 d 1 -1 -3 0 -1 0 1 3 There is a strong positive correlation. This comment is a statistical interpretation. In general, the judges are in agreement about the books. This comment is in the context of the question.
Spearman’s Rank Correlation Coefficient e. g. 2 Find the Spearman’s rank correlation coefficient for the following data which gives the yield per acre for oats and barley over 5 years. 1999 2000 2001 2002 2003 Oats 585 578 537 92 475 Barley 681 682 581 211 709 Source: Alberta: Agriculture, Food and Rural Development Solution: We first need to assign ranks. 1999 2000 2001 2002 2003 Oats 5 4 3 1 2 Barley 3 4 2 1 5 We now find the differences in the ranks.
Spearman’s Rank Correlation Coefficient 1999 2000 2001 2002 2003 Oats 5 4 3 1 2 Barley 3 4 2 1 5 d 2 0 1 0 -3 There is a weak positive correlation. There is little evidence that high ( or low ) yields of both crops appear in the same years.