
Teach A Level Maths Statistics 1 Reversing Normal

- Slides: 28
“Teach A Level Maths” Statistics 1 Reversing Normal Calculations © Christine Crisp
Reversing Normal Calculations Statistics 1 AQA Normal Distribution diagrams in this presentation have been drawn using FX Draw ( available from Efofex at www. efofex. com ) "Certain images and/or photos on this presentation are the copyrighted property of Jupiter. Images and are being used with permission under license. These images and/or photos may not be copied or downloaded without permission from Jupiter. Images"
Reversing Normal Calculations In the previous presentation there was an example where a claim was made that batteries would last 24 hours. However, 20% of them failed in under this time. This manufacturer would get a lot of complaints! However, in many industrial processes times or lengths or weights cannot be exact and some items will fall outside acceptable levels. Suppose the battery manufacturer is prepared to accept that 5% will not last as long as is claimed and so wants to know what length of time should be claimed on the package. As statisticians we are being given the percentage and want to find the corresponding value of x. We need to reverse the process we used before.
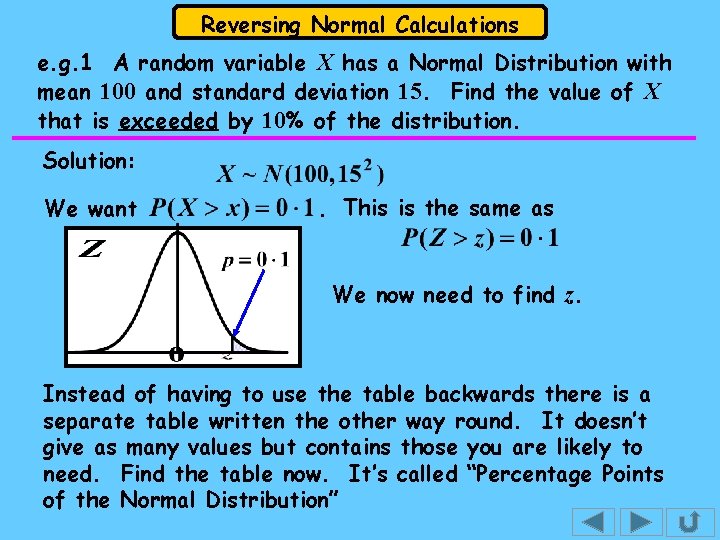
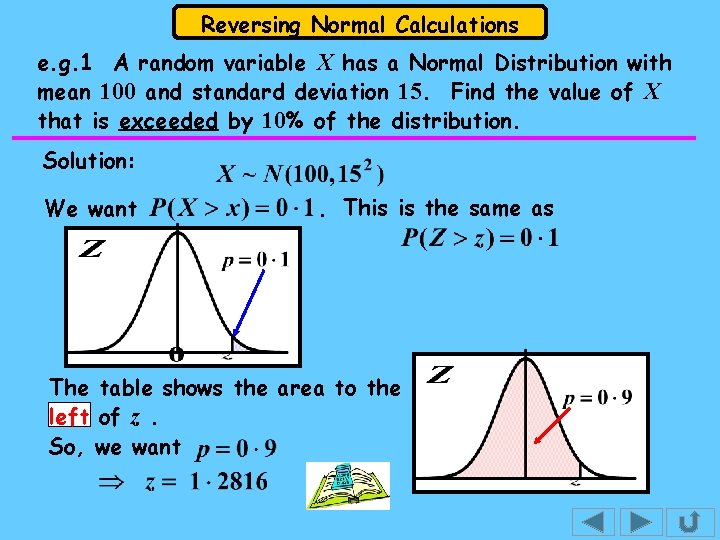
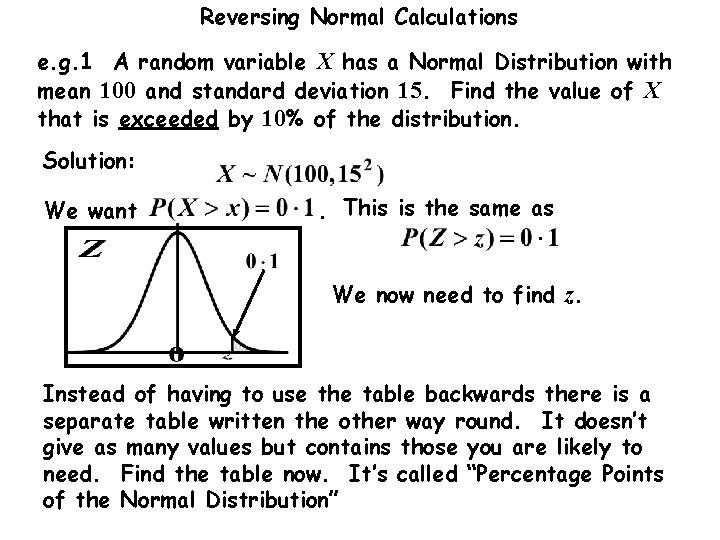
Reversing Normal Calculations e. g. 1 A random variable X has a Normal Distribution with mean 100 and standard deviation 15. Find the value of X that is exceeded by 10% of the distribution. Solution: We want . This is the same as We now need to find z. Instead of having to use the table backwards there is a separate table written the other way round. It doesn’t give as many values but contains those you are likely to need. Find the table now. It’s called “Percentage Points of the Normal Distribution”
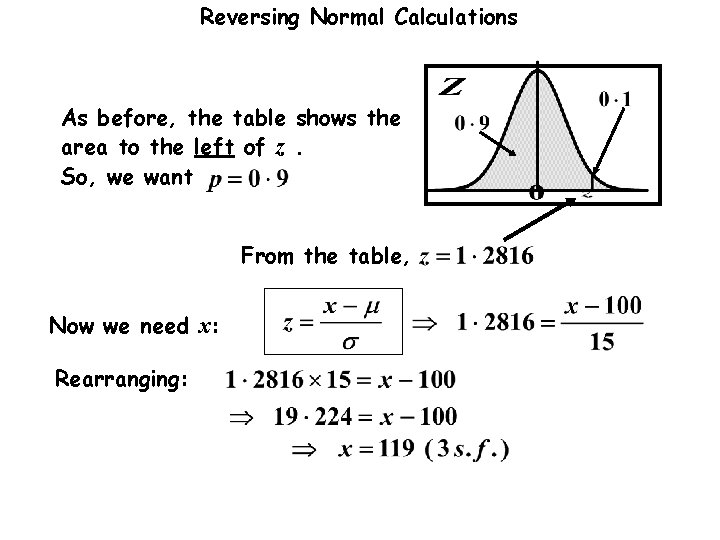
Reversing Normal Calculations e. g. 1 A random variable X has a Normal Distribution with mean 100 and standard deviation 15. Find the value of X that is exceeded by 10% of the distribution. Solution: We want . This is the same as The table shows the area to the left of z. So, we want
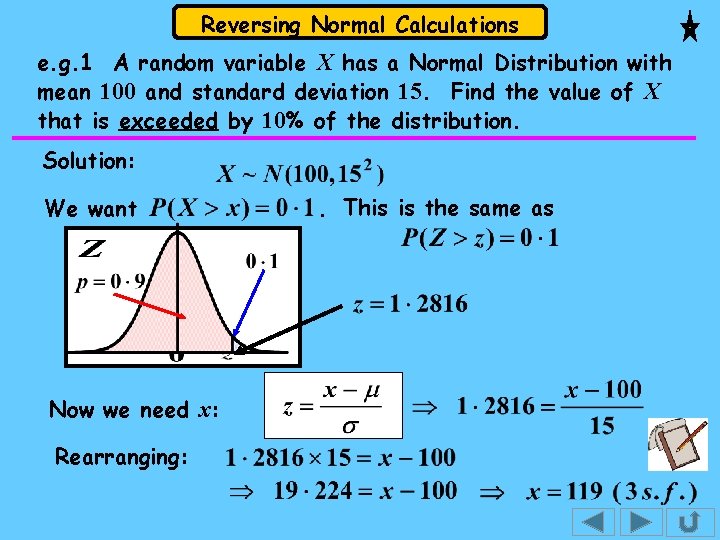
Reversing Normal Calculations e. g. 1 A random variable X has a Normal Distribution with mean 100 and standard deviation 15. Find the value of X that is exceeded by 10% of the distribution. Solution: We want Now we need x: Rearranging: . This is the same as
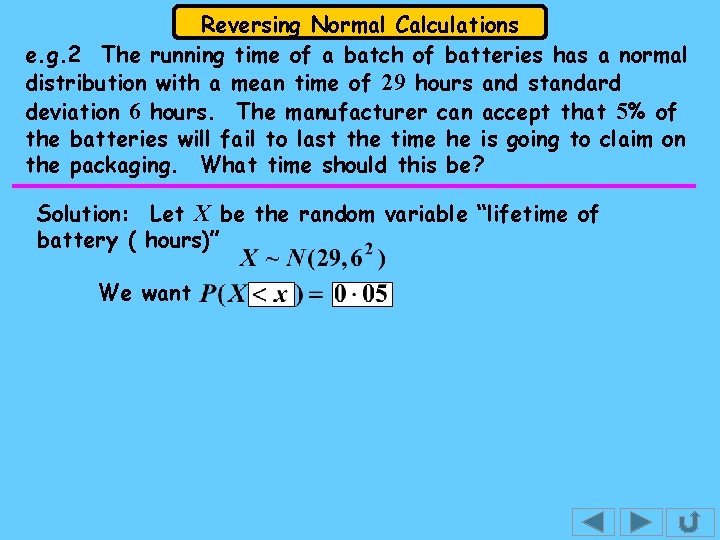
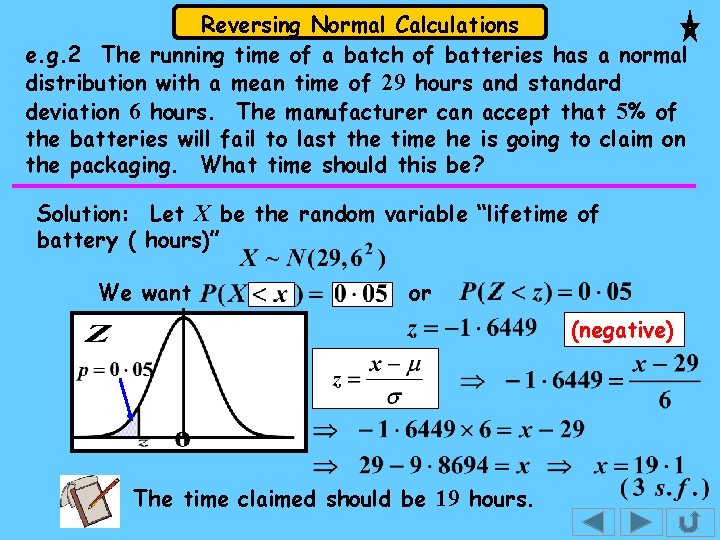
Reversing Normal Calculations e. g. 2 The running time of a batch of batteries has a normal distribution with a mean time of 29 hours and standard deviation 6 hours. The manufacturer can accept that 5% of the batteries will fail to last the time he is going to claim on the packaging. What time should this be? Solution: Let X be the random variable “lifetime of battery ( hours)” We want
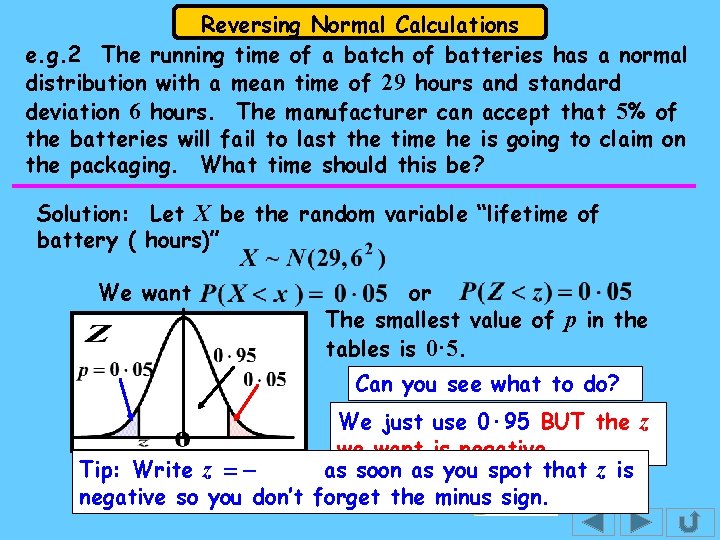
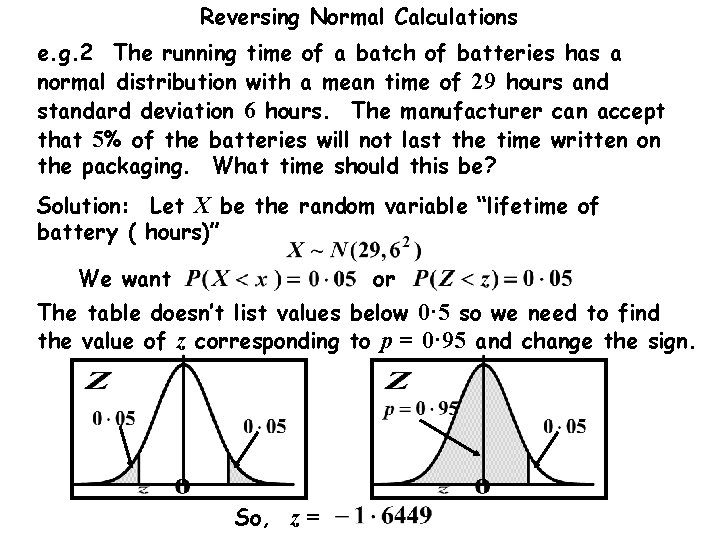
Reversing Normal Calculations e. g. 2 The running time of a batch of batteries has a normal distribution with a mean time of 29 hours and standard deviation 6 hours. The manufacturer can accept that 5% of the batteries will fail to last the time he is going to claim on the packaging. What time should this be? Solution: Let X be the random variable “lifetime of battery ( hours)” We want or The smallest value of p in the tables is 0· 5. Can you see what to do? We just use 0· 95 BUT the z we want is negative. Tip: Write z = as soon as you spot that z is z =forget negative so you. So, don’t the minus sign.
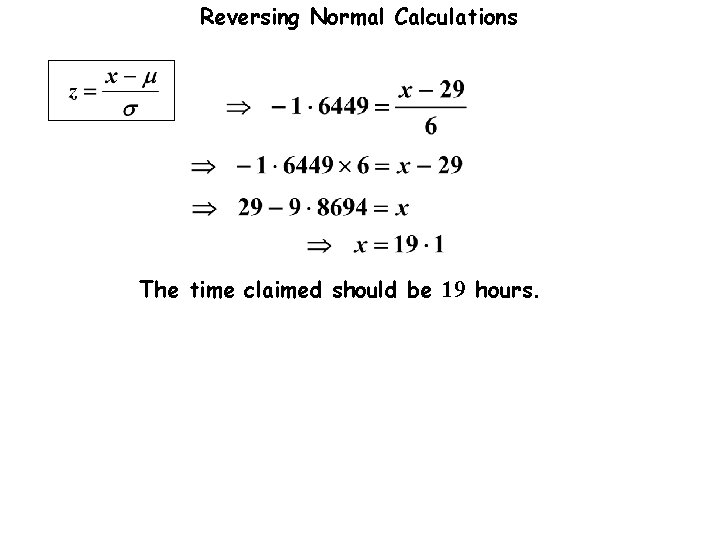
Reversing Normal Calculations e. g. 2 The running time of a batch of batteries has a normal distribution with a mean time of 29 hours and standard deviation 6 hours. The manufacturer can accept that 5% of the batteries will fail to last the time he is going to claim on the packaging. What time should this be? Solution: Let X be the random variable “lifetime of battery ( hours)” We want or (negative) The time claimed should be 19 hours.
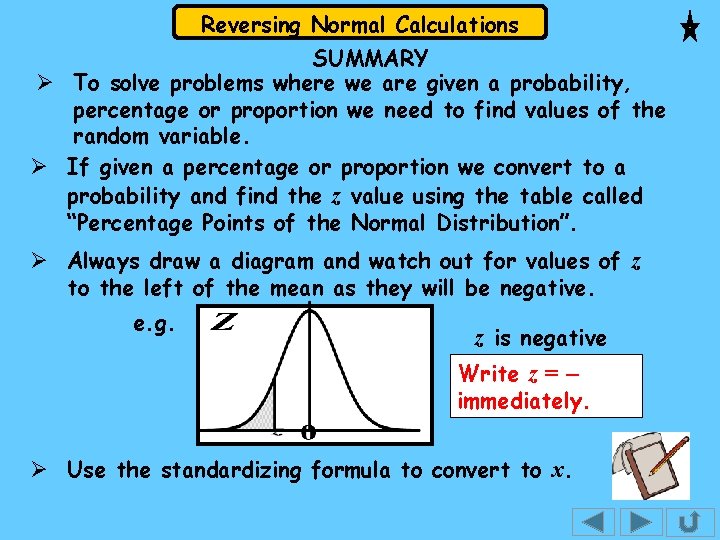
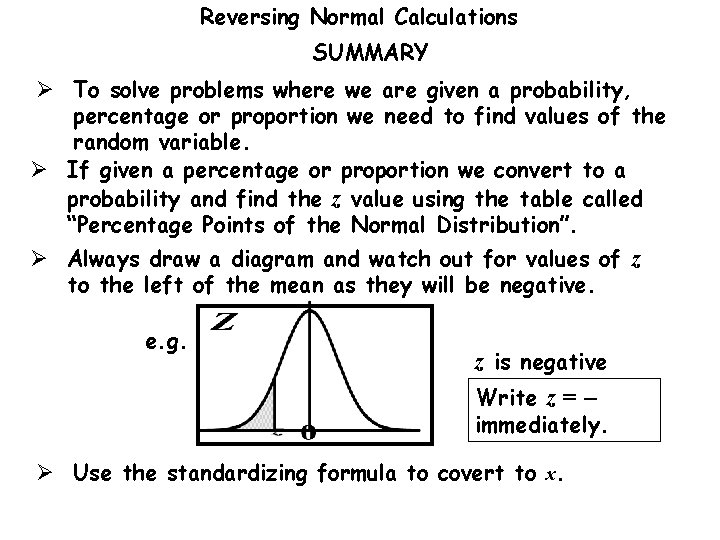
Reversing Normal Calculations SUMMARY Ø To solve problems where we are given a probability, percentage or proportion we need to find values of the random variable. Ø If given a percentage or proportion we convert to a probability and find the z value using the table called “Percentage Points of the Normal Distribution”. Ø Always draw a diagram and watch out for values of z to the left of the mean as they will be negative. e. g. z is negative Write z = immediately. Ø Use the standardizing formula to convert to x.
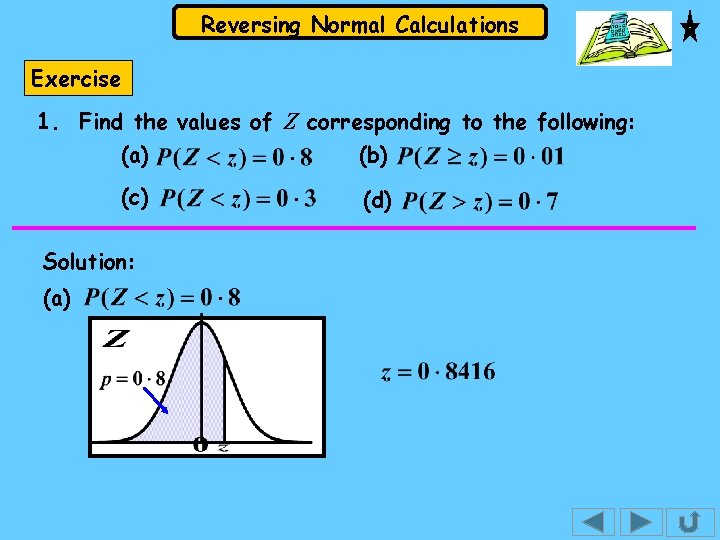
Reversing Normal Calculations Exercise 1. Find the values of Z corresponding to the following: (a) (b) (c) (d) Solution: (a)
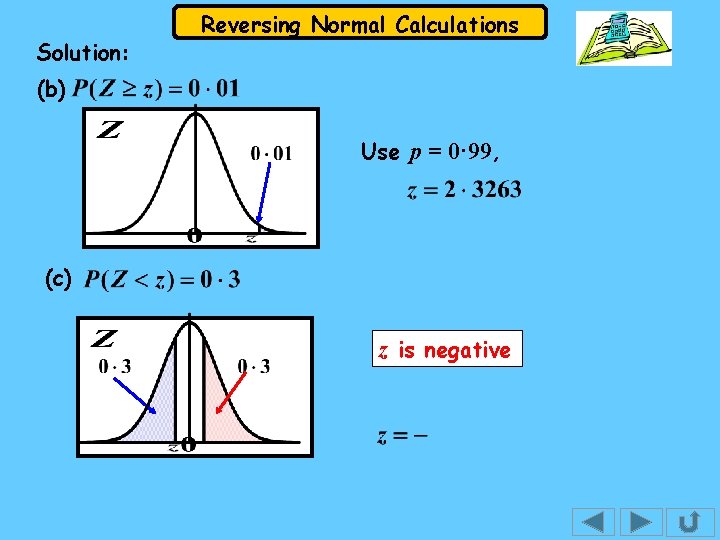
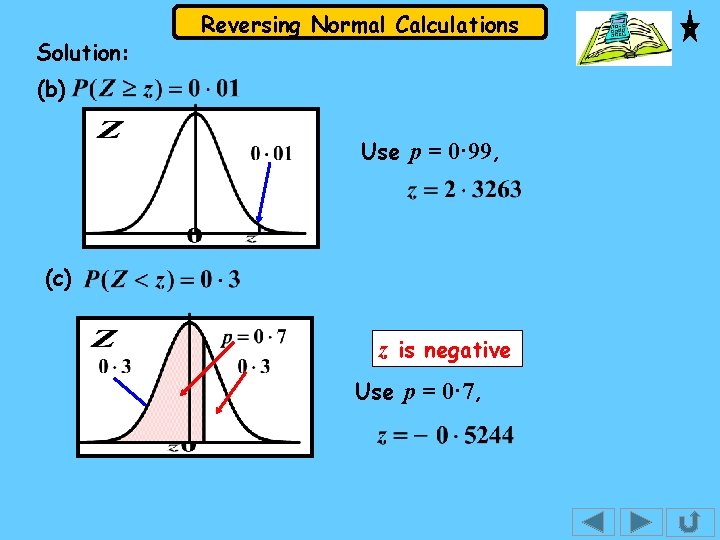
Solution: Reversing Normal Calculations (b) Use p = 0· 99, (c) z is negative
Solution: Reversing Normal Calculations (b) Use p = 0· 99, (c) z is negative Use p = 0· 7,
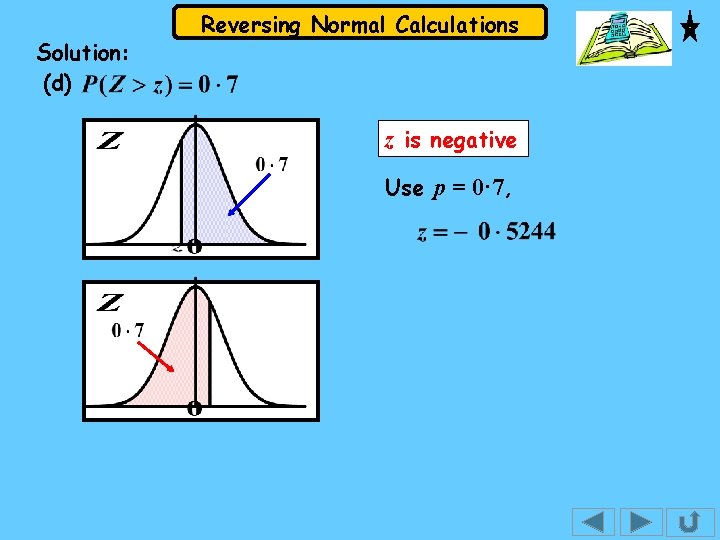
Solution: (d) Reversing Normal Calculations z is negative Use p = 0· 7,
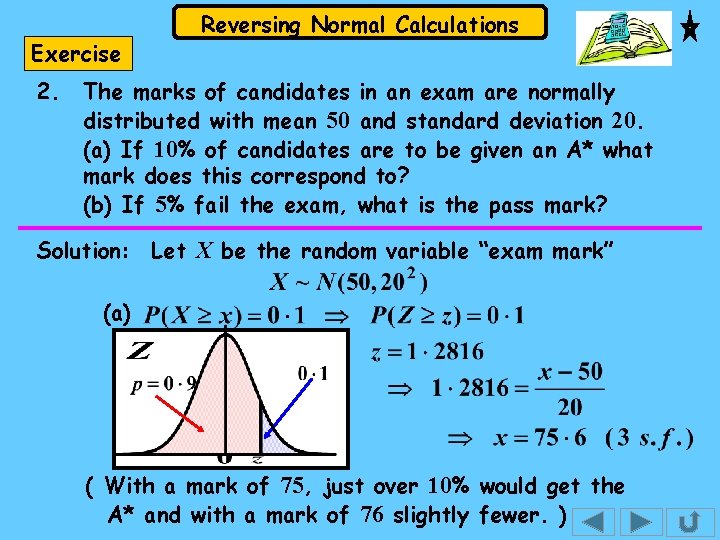
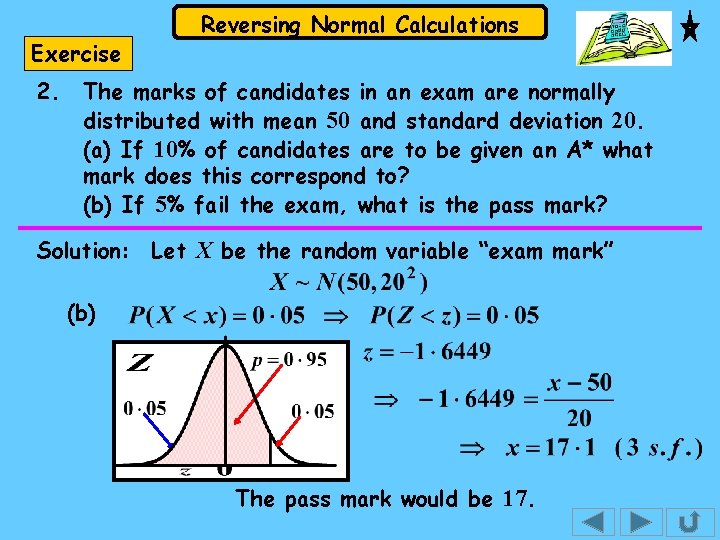
Exercise 2. Reversing Normal Calculations The marks of candidates in an exam are normally distributed with mean 50 and standard deviation 20. (a) If 10% of candidates are to be given an A* what mark does this correspond to? (b) If 5% fail the exam, what is the pass mark? Solution: Let X be the random variable “exam mark” (a) ( With a mark of 75, just over 10% would get the A* and with a mark of 76 slightly fewer. )
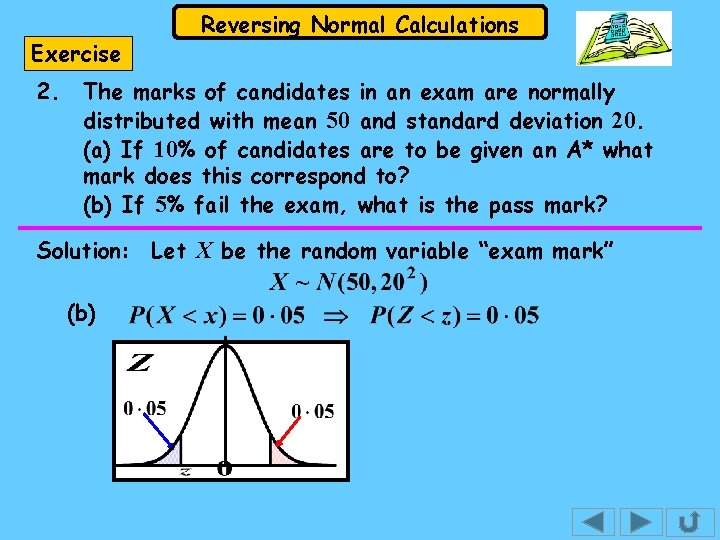
Exercise 2. Reversing Normal Calculations The marks of candidates in an exam are normally distributed with mean 50 and standard deviation 20. (a) If 10% of candidates are to be given an A* what mark does this correspond to? (b) If 5% fail the exam, what is the pass mark? Solution: Let X be the random variable “exam mark” (b)
Exercise 2. Reversing Normal Calculations The marks of candidates in an exam are normally distributed with mean 50 and standard deviation 20. (a) If 10% of candidates are to be given an A* what mark does this correspond to? (b) If 5% fail the exam, what is the pass mark? Solution: Let X be the random variable “exam mark” (b) The pass mark would be 17.
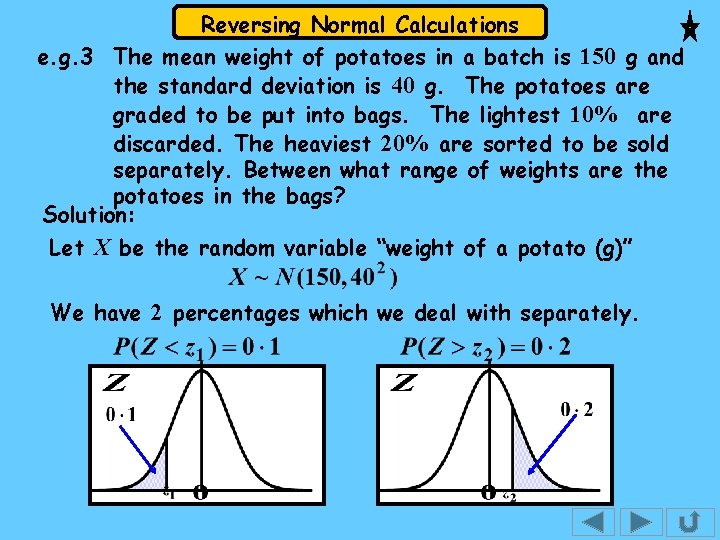
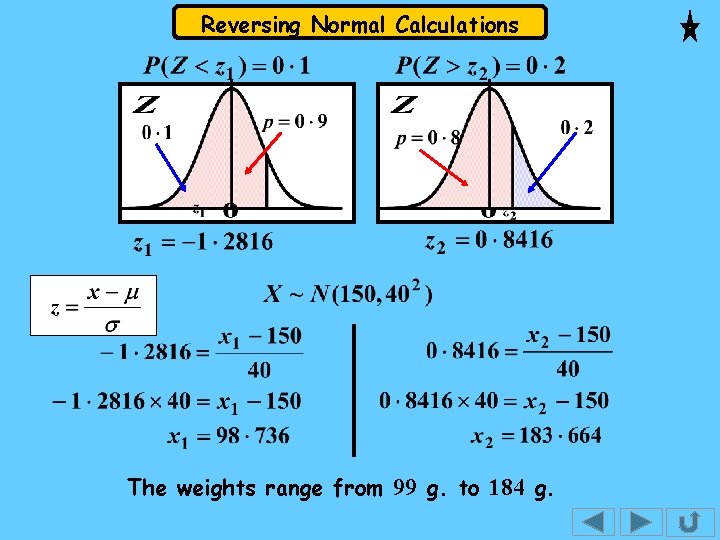
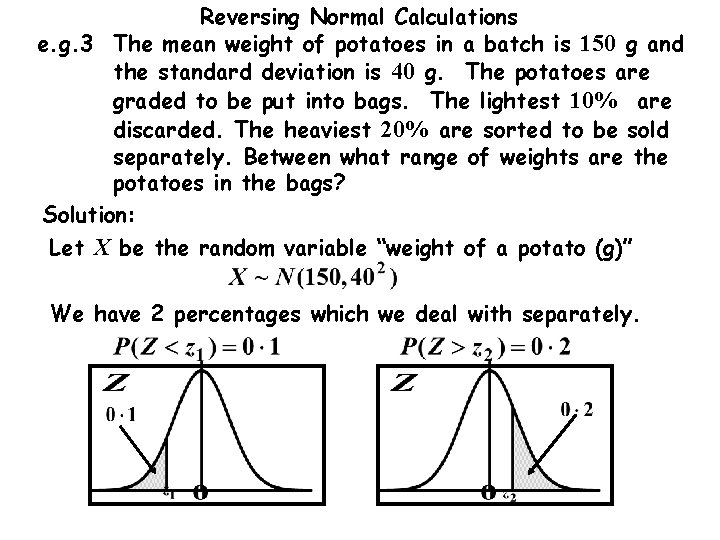
Reversing Normal Calculations e. g. 3 The mean weight of potatoes in a batch is 150 g and the standard deviation is 40 g. The potatoes are graded to be put into bags. The lightest 10% are discarded. The heaviest 20% are sorted to be sold separately. Between what range of weights are the potatoes in the bags? Solution: Let X be the random variable “weight of a potato (g)” We have 2 percentages which we deal with separately.
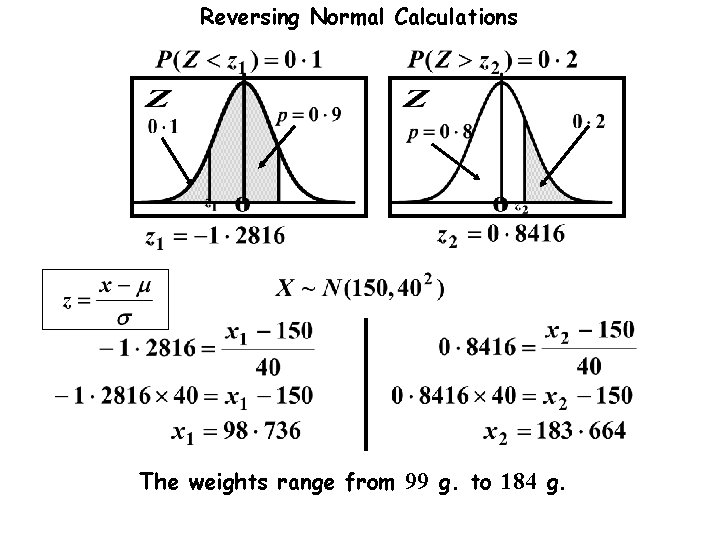
Reversing Normal Calculations The weights range from 99 g. to 184 g.
Reversing Normal Calculations The following slides contain repeats of information on earlier slides, shown without colour, so that they can be printed and photocopied. For most purposes the slides can be printed as “Handouts” with up to 6 slides per sheet.
Reversing Normal Calculations e. g. 1 A random variable X has a Normal Distribution with mean 100 and standard deviation 15. Find the value of X that is exceeded by 10% of the distribution. Solution: We want . This is the same as We now need to find z. Instead of having to use the table backwards there is a separate table written the other way round. It doesn’t give as many values but contains those you are likely to need. Find the table now. It’s called “Percentage Points of the Normal Distribution”
Reversing Normal Calculations As before, the table shows the area to the left of z. So, we want From the table, Now we need x: Rearranging:
Reversing Normal Calculations e. g. 2 The running time of a batch of batteries has a normal distribution with a mean time of 29 hours and standard deviation 6 hours. The manufacturer can accept that 5% of the batteries will not last the time written on the packaging. What time should this be? Solution: Let X be the random variable “lifetime of battery ( hours)” or We want The table doesn’t list values below 0· 5 so we need to find the value of z corresponding to p = 0· 95 and change the sign. So, z =
Reversing Normal Calculations The time claimed should be 19 hours.
Reversing Normal Calculations e. g. 3 The mean weight of potatoes in a batch is 150 g and the standard deviation is 40 g. The potatoes are graded to be put into bags. The lightest 10% are discarded. The heaviest 20% are sorted to be sold separately. Between what range of weights are the potatoes in the bags? Solution: Let X be the random variable “weight of a potato (g)” We have 2 percentages which we deal with separately.
Reversing Normal Calculations The weights range from 99 g. to 184 g.
Reversing Normal Calculations SUMMARY Ø To solve problems where we are given a probability, percentage or proportion we need to find values of the random variable. Ø If given a percentage or proportion we convert to a probability and find the z value using the table called “Percentage Points of the Normal Distribution”. Ø Always draw a diagram and watch out for values of z to the left of the mean as they will be negative. e. g. z is negative Write z = immediately. Ø Use the standardizing formula to covert to x.