TDM 1 Trastuzumab emtansine PreClinical and Early Clinical
 Pre-Clinical and Early Clinical Development Mauricio Lema Medina –")
T-DM 1 (Trastuzumab – emtansine) Pre-Clinical and Early Clinical Development Mauricio Lema Medina – Clínica de Oncología Astorga / Clínica SOMA, Medellín Trastuzumab-emtansine: A very nice poison May, 2014

Overview • Anti HER 2 therapy in m. BC – A bird’s eye view • Introduction to Antibody Drug Conjugates (ADCs) • Modes of ADC toxicity • T-DM 1 pre-clinical development • T-DM 1 early clinical development • Concluding remarks 2

DFS Human Breast Cancer: Correlation of Relapse and Survival with Amplification of the HER-2/neu Oncogene OS Slamon DJ, Science 235: 177 -182, 1987

Mechanism of Action of Trastuzumab T 1 1 2 2 1 Erb receptors Trastuzumab: • Inhibits ligand-independent HER 2 signaling • Activates ADCC • Prevents HER 2 ECD shedding Downstream signaling pathways Cell proliferation Cell survival
")
Trastuzumab with chemotherapy in HER 2 postive MBC Design and enrolment Eligible patients (n=469) No prior anthracyclines l Metastatic breast cancer l HER 2 overexpression 2/3+ l No prior CT for MBC l Measurable disease l KPS ³ 60% Prior anthracyclines Trastuzumab + AC AC Trastuzumab + paclitaxel Paclitaxel (n=143) (n=138) (n=92) (n=96) AC = doxorubicin/epirubicin + cyclophosphamide Slamon DJ et al. N Engl J Med 2001; 344: 783

Trastuzumab Combination Pivotal Trial: Subgroup Analysis–TTP* Paclitaxel AC 1. 0 Proportion of Progression-Free Survival 1. 0 0. 8 Trastuzumab + AC (N=143) AC (N=138) 0. 8 P< 0. 001 0. 6 0. 4 0. 2 0. 0 0 5 10 15 Months 20 25 * Median follow-up: 35 mo (range: 30– 51). . Slamon. N Engl J Med. 2001; 344: 783. 30 Trastuzumab + Paclitaxel (N=92) Paclitaxel (N=96) P< 0. 001 0 5 10 15 Months 20 25

Overall survival HR=0. 80 p=0. 046 Probability of survival 1. 0 0. 8 25. 1 months ( 20%) 0. 6 0. 4 20. 3 months 0. 2 H + CT CT 0 0 CT patients treated with trastuzumab after disease progression 5 24% 15 25 Time (months) 62% 35 45 65% 72% Slamon DJ et al. N Engl J Med 2001; 344: 783
 Response Duration, Mos (%")
QT vs QT+Trastuzumab Enrolled, n Response Rate, % (% Improvement) Response Duration, Mos (% Improvement) Time to Progression, Mos (% Improvement) H + CT 235 49 (-53%) 9. 3 (-58%) 7. 6 (-65%) CT 234 32 5. 9 4. 6 H + AC 138 52 (-20%) 9. 1 (-40%) 8. 1 (-33%) AC 145 43 6. 5 6. 1 H + T 92 42 (-163%) 11. 0 (-150%) 6. 9 (-130%) T 96 16 4. 4 3. 0 Slamon et al. N Engl J Med. 2001; 344: 783 -792.

Cardiac Dysfunction Associated With Trastuzumab Alone Trastuzumab + AC AC Alone Trastuzumab + Paclitaxel Alone Any 3% to 7% 27% 8% 13% 1% Class III-IV 2% to 4% 16% 4% 2% 1% Seidman A, et al. J Clin Oncol. 2002; 20: 1215 -1221.

There is significant reversibility of LV dysfunction with trastuzumab-related cardiac toxicity Ewer, et al J of Clinical Oncology 2005, 23; p 7820 -6.

Study M 77001 was conducted to demonstrate the activity of Trastuzumab plus docetaxel HER 2 -positive MBC (IHC 3+ and/or FISH+) n=188 Two patients did not receive study medication n=92 n=94 Docetaxel* 100 mg/m q 3 w x 6 2 *Patients progressing on docetaxel alone could crossover to receive Herceptin ® Docetaxel 100 mg/m q 3 w x 6 2 + Trastuzumab 4 mg/kg loading, 2 mg/kg weekly until PD ® Marty M, et al. J Clin Oncol 2005; 23: 4265
 Patients alive (%) 100 Trastuzumab + docetaxel")
M 77001: OS (IHC 3+ / FISH+) Patients alive (%) 100 Trastuzumab + docetaxel (n=92) Docetaxel alone (n=94) 80 p=0. 0325* 60 40 20 p=0. 0325 +37% 22. 7 0 0 5 10 15 20 31. 2 25 30 35 40 45 50 Months 8. 5 months • Twice as many patients receiving trastuzumab survived 3 years (33% vs 16%) *Statistically significant difference Extra 2005; Marty et al 2005

Mechanism of Action of Lapatinib Compared to Trastuzumab T 1 1 2 2 1 2 L L L Erb receptors Downstream signaling pathways Cell proliferation Cell survival Lapatinib

EGF 100151 study design 1, 2 Patients with Erb. B 2 -positive locally advanced or metastatic breast cancer that progressed after prior anthracycline, taxane and trastuzumab (N=399) RANDOMISATION Lapatinib 1250 mg po od continuously + capecitabine 2000 mg/m 2/d po days 1 -14 q 3 wk Capecitabine 2500 mg/m 2/day po days 1 -14 q 3 wk Treatment continued until progression or unacceptable toxicity po = oral; od = once daily; q 3 wk = once every 3 weeks 1. Cameron D et al. Breast Cancer Res Treat 2008; 2. Geyer GE et al. N Engl J Med 2006

EGF 100151: independently assessed time to progression 1

Lapatinib + Capecitabine after Taxane + Trastuzumab: One approach on progression 1 st-line Trastuzumab + Paclitaxel. 2001 Phase III Slamon DJ, et al. (2001) N Engl J Med 344: 783– 792. Marti M, et al. J Clin Oncol 23: 4265– 4274. Geyer, et al. NEJM, 2006 2 nd--line Trastuzumab + Docetaxel 2005 Lapatinib + Capecitabina 2006 Phase III

Pertuzumab and Trastuzumab: Complementary Mechanisms of Action HER 2 Trastuzumab Pertuzumab Subdomain IV HER 1/3/4 Dimerization domain Trastuzumab: • Inhibits ligand-independent HER 2 signaling • Activates ADCC • Prevents HER 2 ECD shedding Pertuzumab: • Inhibits ligand-dependent HER 2 dimerization and signaling • Activates ADCC = antibody-dependent cell-mediated cytotoxicity; ECD = extracellular domain
 Centrally confirmed HER 2 positive locally")
CLEOPATRA Study Design Docetaxel (≥ 6 cycles recommended) Centrally confirmed HER 2 positive locally recurrent, unresectable or metastatic BC (m. BC) ≤ 1 hormonal regimen for m. BC Prior (neo)adjuvant systemic rx, incl trastuzumab and/or taxane allowed if followed by DFS ≥ 12 mo N = 406 Trastuzumab Placebo R Baseline LVEF ≥ 50%; no CHF or LVEF < 50% during or after prior trastuzumab 1: 1 Docetaxel (≥ 6 cycles recommended) Trastuzumab N = 402 Primary endpoint: Independently assessed progression-free survival Baselga J et al. N Engl J Med 2012; 366(2): 109 -19. Pertuzumab
 Control (n =")
CLEOPATRA: Progression-Free Survival Independently assessed Median PFS Pertuzumab (n = 402) Control (n = 406) HR p-value 18. 5 mo 12. 4 mo 0. 62 <0. 001 Baselga J et al. N Engl J Med 2012; 366(2): 109 -119.
3 with pertuzumab Independently-assessed")
3 CLEOPATRA: Significant improvement in median PFS 1, 2 (and OS)3 with pertuzumab Independently-assessed PFS (%) 100 Ptz+T+D Pla+T+D 90 80 70 60 50 40 HR = 0. 62 95% CI 0. 51, 0. 75 p < 0. 001 30 20 10 12. 4 0 0 5 10 15 20 25 30 35 40 10 7 0 0 PFS time (months) Number at risk Ptz+T+D 402 Pla+T+D 406 18. 5 345 311 D, docetaxel; Ptz, pertuzumab; T, trastuzumab 267 209 139 93 83 42 32 17 1. Baselga J, et al. SABCS 2011 (Abstract S 5 -5); 2. Baselga J, et al. N Engl J Med 2012; 366: 109– 119; 3. Swain S, et al. SABCS 2012 (Poster P 5 -18 -26).
 Deaths* Pertuzumab (n = 402) Placebo (n = 406)")
CLEOPATRA: Overall Survival (Interim Analysis) Deaths* Pertuzumab (n = 402) Placebo (n = 406) HR p-value 17. 2% 23. 6% 0. 64 0. 005 * Did not meet the O’Brien-Fleming stopping boundary of the Lan-De. Mets alpha spending function for this interim analysis of overall survival and was therefore not significant. Baselga J et al. N Engl J Med 2012; 366(2): 109 -119.
 Placebo (n = 397) Neutropenia 48. 9%")
CLEOPATRA: Safety Results Pertuzumab (n = 407) Placebo (n = 397) Neutropenia 48. 9% 45. 8% Febrile neutropenia 13. 8% 7. 6% Leukopenia 12. 3% 14. 6% Diarrhea 7. 9% 5. 0% Peripheral neuropathy 2. 7% 1. 8% Left ventricular systolic dysfunction 1. 2% 2. 8% Select adverse events (Grade ≥ 3) Baselga J et al. N Engl J Med 2012; 366(2): 109 -19.

CLEOPATRA: Cardiac Tolerability of Pertuzumab plus Trastuzumab plus Docetaxel in Patients with HER 2 -Positive m. BC Pertuzumab Placebo LVSD (any grade) (n = 407, 397) 4. 4% 8. 3% Symptomatic LVSD (Grade ≥ 3) (n = 407, 397) 1. 0% 1. 8% LVEF decline to <50% and by ≥ 10% points from baseline (n = 393, 379) 3. 8% 6. 6% LVSD = left ventricular systolic dysfunction; LVEF = left ventricular ejection fraction Ewer M et al. Proc ASCO 2012; Abstract 533.

Lapatinib + Capecitabine after Taxane + Trastuzumab: One approach on progression 1 st-line Trastuzumab + Paclitaxel. 2001 2 nd--line Trastuzumab + Docetaxel 2005 Lapatinib + Capecitabina 2006 Phase III Pertuzumab + Trastuzumab + Docetaxel 2012 Slamon DJ, et al. (2001) N Engl J Med 344: 783– 792. Marti M, et al. J Clin Oncol 23: 4265– 4274. Geyer, et al. NEJM, 2006 Baselga, et al. NEJM, 2012 Verma, et al. NEJM, 2012 Phase III CLEOPATRA Phase III T-DM 1 2012 Phase III EMILIA
 and")
Percentage of Patients with HER+ m. BC Receiving nth Line of Chemotherapy (CT) and Duration of CT by Line of Treatment Retrospective Medical Record Review of 207 Women at DFCI 2005 -2008 Line of CT Total N % receiving CT Median duration of CT 1 58 100% 9. 0 mo 2 44 76% 5. 1 mo 3 40 69% 6. 3 mo 4 30 52% 4. 7 mo 5 24 40% 4. 0 mo 6 19 33% 4. 2 mo Seah DS et al. Proc ASCO 2012; Abstract 6089.
 Linker stable in circulation Antibody targeted to tumor")
Anatomy of an Antibody-Drug Conjugate (ADC) Linker stable in circulation Antibody targeted to tumor • Humanized monoclonal Ab (Ig. G 1) • m. Ab with Fc modifications (modulate ADCC, CDC activity) • Other m. Ab fragments • Linker biochemistry • Acid labile (hydrazone) • Enzyme dipeptides (cleavable) • Thioether (uncleavable) • Hindered disulfide (uncleavable) • Site of conjugation • Fc, HC, LC Very potent chemotherapeutic drug • Tubulin polymerization inhibitors • Maytansines (DM 1, DM 4) • Auristatins (MMAE, MMAF) • DNA damaging agents • Calicheamicins • Duocarmycins • Anthracyclines (doxorubicin) Genentech Confidential—Internal Use Only 26
: Mechanism of Action Trastuzumab-specific MOA • Antibody-dependent cellular cytotoxicity (ADCC)")
Trastuzumab Emtansine (T-DM 1): Mechanism of Action Trastuzumab-specific MOA • Antibody-dependent cellular cytotoxicity (ADCC) • Inhibition of HER 2 signaling • Inhibition of HER 2 shedding HER 2 P P P Nucleus Adapted from Lo. Russo PM, et al. Clin Cancer Res 2011. www. esmo 2012. org 27
: Mechanism of Action Trastuzumab-specific MOA • Antibody-dependent cellular cytotoxicity (ADCC)")
Trastuzumab Emtansine (T-DM 1): Mechanism of Action Trastuzumab-specific MOA • Antibody-dependent cellular cytotoxicity (ADCC) • Inhibition of HER 2 signaling • Inhibition of HER 2 shedding HER 2 T-DM 1 Emtansine release P Inhibition of microtubule polymerization P P Lysosome Internalization Nucleus Adapted from Lo. Russo PM, et al. Clin Cancer Res 2011. www. esmo 2012. org 28

Improving the Therapeutic Window • ADCs can selectively deliver a potent cytotoxic drug to tumor cells via tumorspecific and/or over-expressed antigens • Increase drug delivery to tumor • Reduce normal tissue drug exposure Chemotherapy ADC DRUG DOSE TOXIC DOSE (MTD) Therapeutic Window EFFICACIOUS DOSE (MED) MTD: Maximum tolerated dose; MED: Minimum Efficacious Dose 29
")
ADC Better Tolerated than Free Cytotoxin in Rats Body Weight (% change from baseline) Single IV dose; rats T-DM 1 (2040 µg DM 1/m²) Free DM 1 (2400 µg DM 1/m²) Early mortality (100%) Time (Day) T-DM 1: Trastuzumab emtansine 30

Modes of Anti-tumor Activity of ADCs Tumor Cell Tumor cytotoxicity is target-directed ADC-Ag binding → internalization in lysosomes → ADC degradation → release of toxin intracellularly → tumor cell death Genentech Confidential—Internal Use Only Tumor Cells Tumor cytotoxicity is target-enhanced (bystander effect) ADC-Ag binding → extracellular cleavage of toxin → release of toxin in local tumor environment → diffusion of toxin intracellularly to neighboring tumor cells → tumor cell death 31

Tissue Antigen Characteristics Are Key in ADCs Careful selection of target antigens are an important criterion for both the safety and efficacy of an ADC • The ‘ideal’ tissue antigen should have: – – – High level of target expression in cancer cells Little to no expression in normal cells Expressed on the cell surface Readily internalized No shedding into the blood by cleavage of the antigen from cancer cell surface • The number of antigen molecules and antibody binding affinity for the antigen may affect the potency of the ADC 32

Modes of Toxicity of ADCs + Normal Cell Systemic release of toxin Unwanted ADC-mediated cytotoxicity • Instability of linker • Catabolism of ADC • Targeted binding to normal tissues expressing antigen • Off-target (cross reactive) binding to normal tissues • Non-antigen-mediated ADC uptake (e. g. , Fcmediated uptake, pinocytosis) Genentech Confidential—Internal Use Only 33

Modes of Toxicity of ADCs + Normal Cell Systemic release of toxin Unwanted ADC-mediated cytotoxicity • Instability of linker • Catabolism of ADC • Targeted binding to normal tissues expressing antigen • Off-target (cross reactive) binding to normal tissues • Non-antigen-mediated ADC uptake (e. g. , Fcmediated uptake, pinocytosis) Genentech Confidential—Internal Use Only 34
 Single IV dose 20 mg/kg ADC")
Slower Drug Deconjugation With Uncleavable Linker Concentration (µg/ml) Single IV dose 20 mg/kg ADC Total Ab Uncleavable linker Cleavable linker Days post dose Polson, et al. , Cancer Res. , 69(6), 2009 35
")
More Stable Linker Reduces Systemic Toxicity of ADC in Rats Change in bodyweight (grams) Single IV dose given on Day 1 : CD 22 -DM 1 with cleavable linker Days post dose Polson, et al. , Cancer Res. , 69(6), 2009 36

More Stable Linker Reduces Systemic Toxicity of ADC in Rats Single IV dose given on Day 1 : Polson, et al. , Cancer Res. , 69(6), 2009 37

Modes of Toxicity of ADCs + Normal Cell Systemic release of toxin Unwanted ADC-mediated cytotoxicity • Instability of linker • Catabolism of ADC • DAR • Targeted binding to normal tissues expressing antigen • Off-target (cross reactive) binding to normal tissues • Non-antigen-mediated ADC uptake (e. g. , Fcmediated uptake, pinocytosis) Genentech Confidential—Internal Use Only 38

Early Observation: Highly Drugged ADCs More Toxic DAR: Drug-to-Antibody Ratio DAR 6 DAR 4 DAR 2 DAR 6 39

ADC Proportion Thio. MAb Technology: Controlling Heterogeneity TDC Proportion DAR • Engineered Thio. MAb backbone allows more homogenous drug load (MMAE) • Efficacy of TDC ADC (mg/kg basis) and 2 x ADC (ug MMAE/m 2 basis) Junutula, et al. , Nat. Biotech. , 26(8), 2008 40

Catabolism and Deconjugation of TDC is Slower than ADC in Rats Single dose I. V. PK study: ADC or TDC with matched cytotoxin (MMAE) doses Catabolism of the Antibody Junutula, et al. , Nat. Biotech. , 26(8), 2008 Deconjugation of the Antibody

MMAE TDC is Better Tolerated Than ADC in Monkeys Repeat IV doses of ADC or TDC, Days 1 and 23: • No neutrophil decreases with TDC compared to equivalent ug/m 2 dose of ADC Junutula, et al. , Nat. Biotech. , 26(8), 2008 42

Modes of Toxicity of ADCs + Normal Cell Systemic release of toxin Unwanted ADC-mediated cytotoxicity • Instability of linker • Catabolism of ADC • DAR • Site of conjugation • Targeted binding to normal tissues expressing antigen • Off-target (cross reactive) binding to normal tissues • Non-antigen-mediated ADC uptake (e. g. , Fcmediated uptake, pinocytosis) Genentech Confidential—Internal Use Only 43

Modes of Toxicity of ADCs + Normal Cell Systemic release of toxin Unwanted ADC-mediated cytotoxicity • Instability of linker • Catabolism of ADC • Targeted binding to normal tissues expressing antigen • Off-target (cross reactive) binding to normal tissues • Non-antigen-mediated ADC uptake (e. g. , Fcmediated uptake, pinocytosis) 44

Modes of Toxicity of ADCs + Normal Cell Systemic release of toxin Unwanted ADC-mediated cytotoxicity • Instability of linker • Catabolism of ADC • Targeted binding to normal tissues expressing antigen • Off-target (cross reactive) binding to normal tissues • Non-antigen-mediated ADC uptake (e. g. , Fc-mediated uptake, pinocytosis) 45

Summary • An ADC is both a “large molecule” and a “small molecule”. • ADCs hold great promise for improving current oncology therapies. – Highly potent cytotoxic agents are delivered directly to cancer cells, sparing normal tissues. – ADCs tend to be better tolerated than standard chemotherapy. – Increased therapeutic window allows for better balance between safety/efficacy. • There is a fine balance between efficacy and toxicity. ─ Choice of linker, cytotoxic drug and m. Ab are all important determinants of safety, PK, and efficacy. ─ Toxicity is usually antigen-independent, ADC/drug-dependent. ─ Linker stability, DAR, and site of drug conjugation impacts toxicity. 46

Constructing a highly effective ADC for HER 2 -positive breast cancer Five trastuzumab–maytansinoid conjugates were constructed with various linkers to assess impact on drug activity Least stable X DM T-SPDP-DM 1 X R is: Maytansine: CH 3 DM 1: CH 2 SSMe DM 3: CH 2 CH(CH 3)SSMe DM 4: CH 2 C(CH 3)2 SSMe T-SPP-DM 1 X T-SSNPP-DM 3 X T-SSNPP-DM 4 T-MCC-DM 1 Discovery of antibodies Ehrlich’s vision of targeted treatment 1900 s Hormonal therapy and chemotherapies used to treat haematological & solid cancers 1930– 60 s Key milestones in the development of Kadcyla m. Abs Maytansine 1970 s Lewis Phillips GD, et al. Cancer Res 2008; 68: 9280– 9290 HER 2 Trastuzumab 1980 s 1990 s Most stable Linker and ADC advances 2000 s
 Trastuzumab Mertansine: anti-tubulin")
Another HER-2 Targeted Therapy in Development Trastuzumab-DM 1 (T-DM 1) Trastuzumab Mertansine: anti-tubulin

T-DM 1 Selectively Delivers a Highly Toxic Payload to HER 2 -Positive Tumor Cells • Trastuzumab-like activity by binding to HER 2 • Targeted intracellular delivery of a potent antimicrotubule agent, DM 1 T-DM 1 binds to the HER 2 protein on cancer cells Receptor-T-DM 1 complex is internalized into HER 2 -positive cancer cell 49 Potent antimicrotubule agent is released once inside the HER 2 -positive tumor cell
")
ADC More Efficacious than Free Cytotoxin in Mice DM 1 Free DM 1 (cytotoxin) T-DM 1 (ADC) Parsons et al, AACR (2007); Modified from S. Spencer

T-DM 1 q 3 w – Phase I Trial: T-DM 1 DOT 51 Krop IE, et al. JCO, 2010

T-DM 1 q 3 w Phase I Trial Heavily pre-treated HER 2+ BC patients Dose/Efficacy Significant AEs at MTD 3. 6 mg/kg – q 3 w Thrombocytopenia 73% Clinical-Benefit Elevetad aminotrasferases 44% Objective responses Fatigue DLT at 4. 8 mg/kg: Thrombocytopenia Nausea Contra Pro “T-DM 1 was associated with mild, reversible toxicity, and substantial clinical activity in a heavily treated (HER 2+) population” Page 52 Krop IE, et al. JCO, 2010

T-DM 1 weekly – Phase I Study: T-DM 1 DOT 53 Beeram M, et al. Cancer, 2012

T-DM 1 weekly Phase I Trial Heavily pre-treated HER 2+ BC patients Dose/Efficacy Significant G>=3 AEs 2. 4 mg/kg – every week Anemia (14%) 57% Clinical-Benefit Thrombocytopenia (11%) 46% Objective responses Pneumonia (11%) 18. 6 m median DOT Increased AST (11%) Contra Pro “weekly dose of T-DM 1 2. 4 mg/kg has antitumor activity and is well tolerated in patients with HER 2+ m. BC ” Beeram M, et al. Cancer, 2012

Phase II Trial of Trastuzumab-DM 1 for the Treatment of HER 2+ m. BC After Prior anti-HER 2 therapy Burris HA, et al. J Clin Oncol, 2010

Phase II Trial of Trastuzumab-DM 1 for the Treatment of HER 2+ m. BC After Prior anti-HER 2 therapy Burris HA, et al. J Clin Oncol, 2010

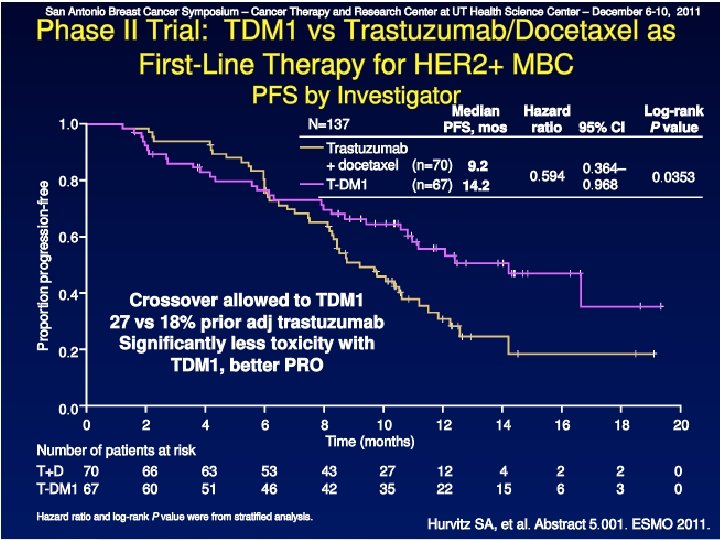
TDM 1 Versus Trastuzumab + Docetaxel 1 st line HER 2 -positive, recurrent locally advanced BC or MBC (n=137) 1: 1 T-DM 1 3. 6 mg/kg Q 3 W until PD Trastuzumab 8 mg/kg dose; 6 mg/kg Q 3 W + Docetaxel 75 or 100 mg/m 2 Q 3 W PD Crossover T-DM 1 Randomized, phase II, international, open-label study HER 2 -positive, measurable disease required Stratification factors World region, prior adjuvant trastuzumab therapy, disease-free interval Primary endpoints: PFS by INV, safety Key secondary endpoints: ORR, clinical benefit, OS, QOL, symptom control Perez EA, et al. ESMO 2010. Abstract LBA 3. 57
 + Docetaxel (D) in HER 2 -Positive MBC With")
T-DM 1 Versus Trastuzumab (T) + Docetaxel (D) in HER 2 -Positive MBC With No Prior Chemotherapy for MBC T-DM 1 (n=67) T+D (n=70) 47. 8% 41. 4% 37. 3% 75. 0% Efficacy Summary Overall response rate (ORR) Safety Summary Grade ≥ 3 adverse event (AE)† † Most common AEs, any grade, T + D: alopecia: 66. 2%, neutropenia: 57. 4%, diarrhea: 45. 6% — these were 1. 5%, 7. 5%, and 10. 4% in pts receiving T-DM 1. Most common AEs, any grade, T-DM 1: nausea: 47. 8%, fatigue: 46. 3%, pyrexia: 35. 8% — these were 39. 7%, 46. 2%, and 20. 6% in pts receiving T + D. Perez EA, et al. Proc ESMO 2010. Abstract LBA 3. 58
 T-DM 1 Activity: Improved PFS 15 P=0. 035 10 14.")
Median Progression-Free Survival (months) T-DM 1 Activity: Improved PFS 15 P=0. 035 10 14. 2 9. 2 5 Treatment with T-DM 1 reduced the probability of disease progression or death by 41% compared with Trastuzumab + Docetaxel HR=0. 59, P=0. 035 0 T-DM 1 trastuzumab + docetaxel HER 2+ locally advanced or metastatic Hurvitz S, et al. ECCO-ESMO 2011. Abstract 5001. 5959

From Ehrlich’s vision to Kadcyla: Over 100 years in the making Ehrlich’s vision 1– 3 Maytansine isolated 4, 5 m. Abs 6 HER 2 oncoprotein 7 ADC & linker advances 13 2000’s 1970 s 1897 Herceptin (trastuzumab) in trials and approval 7, 9– 12 Five trastuzumab-DM 1 conjugates with various linkers were evaluated 13 Greater activity compared with non-conjugated trastuzumab Good PK profile Best safety profile Taken into clinical studies Trastuzumab-MCC-DM 1 selected * EMILIA study population: Patients with HER 2 -positive locally advanced or metastatic breast cancer, who had received prior Herceptin and taxane therapy. Patients had either progressed within 6 months of completing adjuvant therapy or during metastatic treatment 2013 FDA & EMA approval 2012 Pivotal EMILIA* study reports successful survival and Qo. L benefits compared with lapatinib plus capecitabine and thus the final proof-of-concept of an ADC 14

Trastuzumab-emtamsine Concluding remarks And the rest of the story is about to come… EMILIA Hay be studied in combination Effective, with high response rate even in heavily pretreated HER 2+ BC patients Safe, with most cytotoxic activity inside the HER 2+ cell ADC (Trastuzumab + anti microtubule

Updated Overall Survival Results From EMILIA, a Phase 3 Study of Trastuzumab Emtansine (T-DM 1) vs Capecitabine and Lapatinib in HER 2 -Positive Locally Advanced or Metastatic Breast Cancer S Verma, 1 D Miles, 2 L Gianni, 3 IE Krop, 4 M Welslau, 5 J Baselga, 6 M Pegram, 7 D-Y Oh, 8 V Diéras, 9 E Guardino, 10 L Fang, 10 MW Lu, 10 S Olsen, 10 K Blackwell 11 1 Sunnybrook Odette Cancer Center, Toronto, Canada; 2 Mount Vernon Cancer Center, Northwood, UK; 3 San Raffaele Hospital, Milan, Italy; 4 Dana-Farber Cancer Institute, Boston, MA, USA; 5 Medical Office Hematology, Aschaffenburg, Germany; 6 Massachusetts General Hospital, Boston, MA, USA; 7 University of Miami Sylvester Comprehensive Cancer Center, Miami, FL, USA; 8 Seoul National University College of Medicine, Seoul, Korea; 9 Institut Curie, Paris, France; 10 Genentech, Inc, South San Francisco, CA, USA; 11 Duke Cancer Institute, Durham, NC, USA www. esmo 2012. org 63

Disclosure Slide • Verma: Compensated consultant/advisory relationship with Roche/GSK; honoraria from GSK/Roche; research funding from Genentech/Roche • Miles: Compensated consultant/advisory relationship with Genentech/Roche; honoraria from Genentech/Roche • Gianni: Compensated consultant/advisory relationship with Genentech/Roche, GSK, Pfizer • Krop: Uncompensated consultant/advisory relationship with Novartis; research funding from Genentech/Roche • Welslau: None • Baselga: Compensated consultant/advisory relationship with Genentech/Roche • Pegram: Compensated consultant/advisory relationship with Genentech/Roche; honoraria from Genentech/Roche • Oh: None • Dieras: Compensated consultant/advisory relationship with Genentech/Roche, Novartis, Sanofi, Amgen, Clovis, Pfizer, GSK; honoraria from Genentech/Roche, Novartis, Sanofi, Amgen, Clovis, Pfizer, GSK • Guardino: Genentech employee; owns Roche stock • Fang: Genentech employee; owns Roche stock • Lu: Genentech employee; owns Roche stock • Olsen: Genentech employee; owns Roche and Sanofi stock • Blackwell: None www. esmo 2012. org 64
: Mechanism of Action HER 2 Antibody: Trastuzumab Stable linker: MCC")
Trastuzumab Emtansine (T-DM 1): Mechanism of Action HER 2 Antibody: Trastuzumab Stable linker: MCC Emtansine Cytotoxic: DM 1 P P P Nucleus Adapted from Lo. Russo PM, et al. Clin Cancer Res 2011. www. esmo 2012. org 65
: Mechanism of Action Trastuzumab-specific MOA • Antibody-dependent cellular cytotoxicity (ADCC)")
Trastuzumab Emtansine (T-DM 1): Mechanism of Action Trastuzumab-specific MOA • Antibody-dependent cellular cytotoxicity (ADCC) • Inhibition of HER 2 signaling • Inhibition of HER 2 shedding HER 2 P P P Nucleus Adapted from Lo. Russo PM, et al. Clin Cancer Res 2011. www. esmo 2012. org 66
: Mechanism of Action Trastuzumab-specific MOA • Antibody-dependent cellular cytotoxicity (ADCC)")
Trastuzumab Emtansine (T-DM 1): Mechanism of Action Trastuzumab-specific MOA • Antibody-dependent cellular cytotoxicity (ADCC) • Inhibition of HER 2 signaling • Inhibition of HER 2 shedding HER 2 T-DM 1 Emtansine release P Inhibition of microtubule polymerization P P Lysosome Internalization Nucleus Adapted from Lo. Russo PM, et al. Clin Cancer Res 2011. www. esmo 2012. org 67
 • Prior taxane and")
EMILIA Study Design HER 2 -positive LABC or MBC (N=980) • Prior taxane and trastuzumab • Progression on metastatic treatment or within 6 months of adjuvant treatment T-DM 1 3. 6 mg/kg q 3 w IV PD Capecitabine 1000 mg/m 2 PO bid, days 1– 14, q 3 w + Lapatinib 1250 mg/day PO qd PD 1: 1 • Stratification factors: World region, number of prior chemo regimens for MBC or unresectable LABC, presence of visceral disease • Primary endpoints: PFS by independent review, OS, and safety • Key secondary endpoints: PFS by investigator, ORR, DOR • Statistical considerations: Hierarchical statistical analysis was performed in pre-specified sequential order: PFS by independent review → OS → secondary endpoints - PFS analysis: 90% power to detect HR=0. 75; 2 -sided alpha 5% - OS analyses: 80% power to detect HR=0. 80; 2 -sided alpha 5% www. esmo 2012. org 68

EMILIA Analyses Final PFS analysis: 1 st Final PFS and Interim OS Analysis Data cut-off Jan 14, 2012 Presented at ASCO 2012 • Targeted number: 508 events • Actual number: 569 events 1 st Interim OS analysis: • Preplanned at time of final PFS analysis • Did not cross efficacy stopping boundary Safety and Secondary Endpoint analysis 2 nd Interim OS Analysis Data cut-off July 31, 2012 Final OS Analysis Expected 2014 Following health authority interactions • 50% of targeted number of OS events (n=316) • Actual number of OS events: 331 events • Targeted number of events: 632 www. esmo 2012. org 69
 Median age, years (range) Race, n (%) White")
Patient Demographics and Baseline Characteristics (1) Median age, years (range) Race, n (%) White Asian Black/African American Other Not available World region, n (%) United States Western Europe Asia Other ECOG PS, n (%) 0 1 Cap + Lap (n=496) T-DM 1 (n=495) 53 (24– 83) 53 (25– 84) 374 (75) 86 (17) 21 (4) 10 (2) 5 (1) 358 (72) 94 (19) 29 (6) 7 (1) 136 (27) 160 (32) 76 (15) 124 (25) 134 (27) 157 (32) 82 (17) 122 (25) 312 (64) 176 (36) 299 (61) 194 (39) www. esmo 2012. org 70
 Cap + Lap (n=496) T-DM 1 (n=495) Measurable")
Patient Demographics and Baseline Characteristics (2) Cap + Lap (n=496) T-DM 1 (n=495) Measurable disease by independent review, n (%) 389 (78) 397 (80) Site of disease involvement, n (%) Visceral Non-visceral 335 (68) 161 (32) 334 (67) 161 (33) Metastatic sites, n (%) <3 ≥ 3 Unknown 307 (62) 175 (35) 14 (3) 298 (60) 189 (38) 8 (2) ER/PR status, n (%) ER+ and/or PR+ ER− and PR− Unknown 263 (53) 224 (45) 9 (2) 282 (57) 202 (41) 11 (2) www. esmo 2012. org 71
 Taxanes Anthracyclines Endocrine agents Prior therapy")
Prior Systemic Treatment Prior treatment type, n (%) Taxanes Anthracyclines Endocrine agents Prior therapy for MBC, n (%) Yes No Prior trastuzumab treatment, n (%) Early breast cancer only Duration of trastuzumab treatment, n (%) <1 year ≥ 1 year Median time since last trastuzumab, months (range) Cap + Lap (n=496) T-DM 1 (n=495) 494 (100) 302 (61) 204 (41) 493 (100) 303 (61) 205 (41) 438 (88) 58 (12) 435 (88) 60 (12) 495 (100) 77 (16) 495 (100) 78 (16) 212 (43) 284 (57) 210 (42) 285 (58) 1. 5 (0– 98) 1. 5 (0– 63) www. esmo 2012. org 72

Patient Disposition Primary analysis data cut-off Jan 14, 2012 Updated OS data cut-off July 31, 2012 Cap + Lap T-DM 1 Randomized, n 496 495 Treated, n 488 490 Median follow-up, months 12. 4 12. 9 18. 6 19. 1 On study at data cut-off date, n 316 366 262 308 On treatment, n 125 182 55 106 Deaths, n 129 94 182 149 www. esmo 2012. org 73
 Lap (n=488) T-DM 1 (n=490) 77. 2 93. 4 99.")
Drug Exposure Cap (n=487) Lap (n=488) T-DM 1 (n=490) 77. 2 93. 4 99. 9 260 (53. 4) 133 (27. 3) 80 (16. 3) T-DM 1 decreased to 3. 0 mg/kg, n (%) — — 58 (11. 8) T-DM 1 decreased to 2. 4 mg/kg, n (%) — — 22 (4. 5) Median dose intensity, % Pts with dose reduction, n (%) www. esmo 2012. org 74
 events Cap + Lap 6.")
Progression-Free Survival by Independent Review Median No. of (months) events Cap + Lap 6. 4 304 T-DM 1 9. 6 265 Stratified HR=0. 650 (95% CI, 0. 55, 0. 77) P<0. 0001 Proportion progression-free 1. 0 0. 8 0. 6 0. 4 0. 2 0. 0 0 2 4 6 8 10 12 14 16 18 20 22 24 26 28 30 Time (months) No. at risk by independent review: Cap + Lap 496 404 310 176 129 73 53 35 25 14 9 8 5 1 0 0 T-DM 1 183 130 101 72 54 44 30 18 9 3 1 0 495 419 341 236 Unstratified HR=0. 66 (P<0. 0001). www. esmo 2012. org 75

Progression-Free Survival Subgroup Analyses Pre-specified Stratification Factors Cap + Lap T-DM 1 Baseline characteristic Total n All patients 991 6. 4 9. 6 0. 66 (0. 56, 0. 78) World region US 270 Western Europe 317 Other 404 5. 7 6. 4 6. 9 8. 5 10. 9 9. 6 0. 70 (0. 51, 0. 98) 0. 56 (0. 41, 0. 74) 0. 73 (0. 56, 0. 94) 10. 3 8. 5 0. 68 (0. 55, 0. 85) 0. 63 (0. 49, 0. 82) 9. 6 8. 5 0. 55 (0. 45, 0. 67) 0. 96 (0. 71, 1. 30) Median, mos HR (95% CI) T-DM 1 Cap + Lap better Number prior chemo regimens for MBC or unresectable LABC 0– 1 609 6. 7 >1 382 5. 7 Disease involvement Visceral 669 Nonvisceral 322 5. 7 10. 2 Hazard ratio 0. 2 0. 5 1 2 www. esmo 2012. org 5 76
 No. of events Cap + Lap 23.")
Overall Survival: First Interim Analysis Median (months) No. of events Cap + Lap 23. 3 129 T-DM 1 NR 94 Stratified HR=0. 621 (95% CI, 0. 48, 0. 81); P=0. 0005 1. 0 Proportion surviving 84. 7% Efficacy stopping boundary P=0. 0003 or HR=0. 617 0. 8 77. 0% 65. 4% 0. 6 47. 5% 0. 4 0. 2 0. 0 0 2 4 No. at risk: Cap + Lap 496 469 438 T-DM 1 495 484 461 6 8 10 12 14 16 18 20 22 24 26 28 30 32 34 36 52 67 31 46 17 29 7 16 3 5 2 2 1 0 0 0 Time (months) 364 296 242 195 155 129 390 331 277 220 182 149 Unstratified HR=0. 63 (P=0. 0005). NR, not reached. 97 123 74 96 www. esmo 2012. org 77
 No. of events Cap + Lap 25. 1")
Overall Survival: Confirmatory Analysis Median (months) No. of events Cap + Lap 25. 1 182 T-DM 1 30. 9 149 Stratified HR=0. 682 (95% CI, 0. 55, 0. 85); P=0. 0006 1. 0 Proportion surviving 85. 2% Efficacy stopping boundary P=0. 0037 or HR=0. 727 0. 8 78. 4% 64. 7% 0. 6 51. 8% 0. 4 0. 2 0. 0 0 2 4 No. at risk: Cap + Lap 496 471 453 T-DM 1 495 485 474 6 8 10 12 14 16 18 20 22 24 26 28 30 32 34 36 133 110 86 164 136 111 63 86 45 62 27 38 17 28 7 13 4 5 Time (months) 435 403 368 297 240 204 457 439 418 349 293 242 159 197 Data cut-off July 31, 2012; Unstratified HR=0. 70 (P=0. 0012). www. esmo 2012. org 78
 HR")
Overall Survival Subgroup Analyses Cap + Lap T-DM 1 Total n Median (mos) HR (95% CI) All patients 991 25. 1 30. 9 0. 70 (0. 56, 0. 87) World region United States 270 23. 7 NR 0. 62 (0. 41, 0. 96) Western Europe 317 28. 6 27. 8 0. 95 (0. 65, 1. 39) Asia 158 22. 7 34. 3 0. 48 (0. 27, 0. 85) Other 246 22. 7 26. 1 0. 68 (0. 45, 1. 04) Number of prior chemotherapeutic regimens for LABC or MBC 0– 1 609 28. 0 29. 8 0. 80 (0. 61, 1. 07) Baseline characteristic >1 382 22. 7 31. 9 0. 58 (0. 41, 0. 81) Disease involvement Visceral 669 21. 9 28. 4 0. 59 (0. 46, 0. 76) NR 33. 9 1. 05 (0. 69, 1. 61) Nonvisceral 322 Hazard ratio 0. 2 NR, not reached. From confirmatory OS analysis; data cut-off July 31, 2012. T-DM 1 Cap + Lap Better 0. 5 1 2 www. esmo 2012. org 5 79
 HR")
Overall Survival Subgroup Analyses Cap + Lap T-DM 1 Total n Median (mos) HR (95% CI) 991 25. 1 30. 9 0. 70 (0. 56, 0. 87) <65 years 853 24. 6 30. 9 0. 66 (0. 52, 0. 83) 65– 74 years 113 27. 1 NR 0. 74 (0. 37, 1. 47) 25 NR 11. 1 3. 45 (0. 94, 12. 65) 545 25. 3 31. 9 0. 62 (0. 46, 0. 85) 426 23. 7 27. 1 0. 75 (0. 54, 1. 03) First-line 118 27. 9 NR 0. 61 (0. 32, 1. 16) Second-line 361 NR 27. 1 0. 88 (0. 61, 1. 27) Third- and later-line 512 23. 3 33. 9 0. 62 (0. 46, 0. 84) Baseline characteristic All patients T-DM 1 Cap + Lap Better Age group ≥ 75 years ER and PR status ER+ and/or PR+ ER– and PR– Line of therapya Hazard ratio 0. 2 0. 5 1 2 5 a. Defined as any systemic therapy including endocrine and chemotherapy. NR, not reached. From confirmatory OS analysis; data cut-off July 31, 2012. www. esmo 2012. org 80
 Duration of")
ORR and DOR in Patients with Measurable Disease Objective response rate (ORR) Duration of response (DOR) Difference: 12. 7% (95% CI, 6. 0, 19. 4) Median, months (95% CI) Cap + Lap 6. 5 (5. 5, 7. 2) T-DM 1 12. 6 (8. 4, 20. 8) P=0. 0002 43. 6% 50 Patients, % 40 30. 8% 30 20 10 0 Proportion progression-free 1. 0 97 Cap + Lap 0. 4 0. 2 0 T -DM 1 0. 6 0. 0 173/3 120/389 0. 8 2 20 4 22 No. at risk Cap + Lap 120 105 77 48 32 14 T-DM 1 6 24 8 26 10 28 Time (months) 9 8 3 3 12 30 14 32 16 34 18 36 1 1 0 0 0 0 173 159 126 84 65 47 42 33 27 19 12 8 2 0 0 0 www. esmo 2012. org 81
 T-DM 1 (n=490) All-grade AE, n")
Overview of Adverse Events Cap + Lap (n=488) T-DM 1 (n=490) All-grade AE, n (%) 477 (97. 7) 470 (95. 9) Grade ≥ 3 AE, n (%) 278 (57. 0) 200 (40. 8) AEs leading to treatment discontinuation (for any study drug), n (%) 52 (10. 7) 29 (5. 9) 4 (0. 8) 1 (0. 2) AEs leading to death within 30 days of last dose of study drug, n (%)a a. Cap + Lap: coronary artery disease, multi-organ failure, coma, and hydrocephalus; T-DM 1: metabolic aencephalopathy. www. esmo 2012. org 82

Adverse Events Grade ≥ 3 AEs With Incidence ≥ 2% Adverse Event Diarrhea Hand-foot syndrome Vomiting Neutropenia Hypokalemia Fatigue Nausea Mucosal inflammation Thrombocytopenia Increased AST Increased ALT Anemia Cap + Lap (n=488) All Grades, % Grade ≥ 3, % T-DM 1 (n=490) All Grades, % Grade ≥ 3, % 79. 7 58. 0 29. 3 8. 6 27. 9 44. 7 19. 1 20. 7 16. 4 4. 5 4. 3 4. 1 3. 5 2. 3 23. 3 1. 2 19. 0 5. 9 8. 6 35. 1 39. 2 6. 7 1. 6 0. 0 0. 8 2. 0 2. 2 2. 4 0. 8 0. 2 2. 5 9. 4 8. 8 8. 0 0. 2 0. 8 1. 4 1. 6 28. 0 22. 4 16. 9 10. 4 12. 9 4. 3 2. 9 2. 7 ALT, alanine aminotransferase; AST, aspartate aminotransferase. www. esmo 2012. org 83
 15 (3. 1) 2 (0. 4)")
Cardiac Dysfunction Cap + Lap T-DM 1 (n=488) 15 (3. 1) 2 (0. 4) (n=490) 9 (1. 8) 1 (0. 2) Lowest post-baseline LVEF value, n (%) ≥ 45% ≥ 40 to <45% <40% (n=461) 454 (98. 5) 4 (0. 9) 3 (0. 7) (n=482) 476 (98. 8) 3 (0. 6) LVEF <50% and ≥ 15 -point decrease from baseline, n (%) (n=445) 7 (1. 6) (n=481) 8 (1. 7) Cardiac dysfunction AEs, a n (%) All grades Grade 3 a. Includes preferred terms ‘decreased ejection fraction’ and ‘left ventricular dysfunction’; Does not include cardiac AEs (e. g. myocardial infarction, atrial fibrillation). www. esmo 2012. org 84

Conclusions In the EMILIA study, T-DM 1 achieved: • Significant improvement in PFS – Median PFS: Cap + Lap 6. 4 mos; T-DM 1 9. 6 mos – HR=0. 650; P<0. 0001 • Significant improvement in OS – Median OS: Cap + Lap 25. 1 mos; T-DM 1 30. 9 mos – HR=0. 682; P=0. 0006 Key secondary efficacy endpoints including time to symptom progression 1 were also significantly improved with T-DM 1 The safety profile of T-DM 1 was favorable to that of Cap + Lap T-DM 1 should offer an important therapeutic option in the treatment of HER 2 -positive metastatic breast cancer 1 Welslau et al. ESMO 2012, Poster 329 P. www. esmo 2012. org 85

Thanks To the scientists To the investigators, clinicians and research staff at the 213 sites in 26 countries To all of the patients who participated in the trial and their families www. esmo 2012. org 86

Krop I, et al. EMILIA investigators, SABCS 2013

Krop I, et al. EMILIA investigators, SABCS 2013

Krop I, et al. EMILIA investigators, SABCS 2013

EMILIA Biomarker Analysis: PFS by HER 2 m. RNA Level and Treatment Arm Baselga J, et al. EMILIA Investigators

EMILIA Biomarker Analysis: PFS by EGFR, HER 3 and PTEN Expression Baselga J, et al. EMILIA Investigators

Cytotoxic Activity of T-DM 1 in HER 2 -Positive Breast Cancer Cell Lines With PIK 3 CA Mutations Baselga J, et al. EMILIA Investigators

EMILIA Biomarker Analysis: PFS by PIK 3 CA Mutation Status Level and Treatment Arm Baselga J, et al. EMILIA Investigators

EMILIA Biomarker Analysis: PFS by PIK 3 CA Mutation Status Level and Treatment Arm Baselga J, et al. EMILIA Investigators

EMILIA Biomarker Analysis: PFS by PIK 3 CA Mutation Status Level and Treatment Arm Baselga J, et al. EMILIA Investigators

EMILIA Biomarker Analysis Baselga J, et al. EMILIA Investigators

EMILIA Biomarker Analysis Baselga J, et al. EMILIA Investigators

T-DM 1 for HER 2 -Positive MBC: Primary Results From TH 3 RESA, a Phase 3 Study of T-DM 1 vs Treatment of Physician’s Choice H Wildiers, 1 S-B Kim, 2 A Gonzalez-Martin, 3 PM Lo. Russo, 4 J-M Ferrero, 5 M Smitt, 6 R Yu, 6 A Leung, 6 IE Krop 7 1 University Hospitals Leuven, Belgium; 2 Asan Medical Center, University of Ulsan College of Medicine, Seoul, Korea; 3 Centro Oncológico MD Anderson International España, Madrid, Spain; 4 Karmanos Cancer Institute, Wayne State University, Detroit, MI, USA; 5 Department of Medical Oncology, Centre Antoine Lacassagne, Nice, France; 6 Genentech, Inc, South San Francisco, CA, USA; 7 Dana-Farber Cancer Institute, Harvard Medical School, Boston, MA, USA 2013

Disclosure Slide • Wildiers: advisory board for Roche • Kim: advisory board for Novartis, research grant from Novartis and Ildong • Gonzalez-Martin: advisory board for Roche • Lo. Russo: advisory board for Genentech, research grant from Genentech, speakers bureau for Genentech • Ferrero: research grant from Roche and Novartis • Smitt, Yu, Leung: Genentech employee, Roche stock • Krop: research grant from Genentech 2013 99
: Mechanism of Action HER 2 Antibody: Trastuzumab Antibody–drug conjugate: T-DM")
Trastuzumab Emtansine (T-DM 1): Mechanism of Action HER 2 Antibody: Trastuzumab Antibody–drug conjugate: T-DM 1 Stable linker: MCC Emtansine Cytotoxic: DM 1 Emtansine release P P P Inhibition of microtubule polymerization Lysosome Internalization Nucleus Adapted from Lo. Russo PM, et al. Clin Cancer Res 2011. 2013 100

T-DM 1: Background • Phase 3 EMILIA study in patients with HER 2 -positive LABC and MBC previously treated with a taxane and trastuzumab 1: Median PFS and OS were longer in the T-DM 1 arm vs the capecitabine + lapatinib arm – PFS: HR=0. 65 (95% CI, 0. 55, 0. 77); P<0. 001 – OS: HR=0. 68 (95% CI, 0. 55, 0. 85); P<0. 001 Fewer grade ≥ 3 AEs were reported with T-DM 1 vs capecitabine + lapatinib (41% vs 57%) • Approved in several countries worldwide • T-DM 1 has not previously been studied in a randomized trial in patients who received prior treatment with both trastuzumab and lapatinib for advanced disease 1 Verma S, et al. N Engl J Med 2012. AE, adverse events; CI, confidence interval; HER 2, human epidermal growth factor receptor 2; HR, hazard ratio; LABC, unresectable locally advanced breast cancer; MBC, metastatic breast cancer; PFS, progression-free survival; OS, overall survival. 2013 101
 advanced BCa (N=600) ≥ 2")
TH 3 RESA Study Schema HER 2 -positive (central) advanced BCa (N=600) ≥ 2 prior HER 2 -directed therapies for advanced BC T-DM 1 3. 6 mg/kg q 3 w IV 2 (n=400) 1 Treatment of physician’s choice (TPC)b Prior treatment with trastuzumab, lapatinib, and a taxane PD PD (n=200) T-DM 1 c (optional crossover) • Stratification factors: World region, number of prior regimens for advanced BC, d presence of visceral disease • Co-primary endpoints: PFS by investigator and OS • Key secondary endpoints: ORR by investigator and safety a Advanced BC includes MBC and unresectable locally advanced/recurrent BC. b TPC could have been single-agent chemotherapy, hormonal therapy, or HER 2 -directed therapy, or a combination of a HER 2 -directed therapy with a chemotherapy, hormonal therapy, or other HER 2 -directed therapy. c First patient in: Sep 2011. Study amended Sep 2012 (following EMILIA 2 nd interim OS results) to allow patients in the TPC arm to receive T-DM 1 after documented PD. d Excluding single-agent hormonal therapy. 2013 BC, breast cancer; IV, intravenous; ORR, objective response rate; PD, progressive disease; q 3 w, every 3 weeks. 102
 • Targeted number of events: 324")
Statistical Considerations Final PFS analysisa (by investigator assessment) • Targeted number of events: 324 • 80% power to detect HR=0. 65; 2 -sided alpha 0. 5% 1 st interim OS analysisa (prespecified to occur with final PFS analysis) • Number of observed events: 105 • Efficacy crossing boundary HR<0. 363; P<0. 0000013 Final OS analysis • Targeted number of events: 492 • 80% power to detect HR=0. 76; 2 -sided alpha 4. 5% 2013 a Clinical data cutoff: February 11, 2013. 103
 Characteristic Age, % <65 years 65– 74 years ≥ 75 years")
Baseline Characteristics (1) Characteristic Age, % <65 years 65– 74 years ≥ 75 years World region, % United States Western Europe Other Race, % White Asian Othera ECOG PS, b % 0 1 2 TPC (n=198) T-DM 1 (n=404) 82. 8 14. 1 3. 0 85. 4 11. 4 3. 2 24. 2 42. 9 32. 8 81. 3 12. 1 6. 6 24. 5 42. 3 33. 2 41. 4 51. 0 7. 6 44. 8 49. 8 5. 5 a Multi-racial patients are included in the Other category. 80. 4 14. 1 5. 4 2013 b Two patients in the T-DM 1 arm had missing ECOG PS scores: TPC, n=198; T-DM 1, n=402. ECOG PS, Eastern Cooperative Oncology Group performance status. 104
 TPC (n=198) T-DM 1 (n=404) ER and/or PR-positive, % 52. 0")
Baseline Characteristics (2) TPC (n=198) T-DM 1 (n=404) ER and/or PR-positive, % 52. 0 51. 5 Visceral involvement, % 75. 8 74. 8 Disease extent at study entry, % Metastatic Unresectable locally advanced/recurrent BC 94. 4 5. 6 96. 8 3. 2 Number of prior regimens for advanced BC, a median (range) ≤ 3, % 4– 5, % >5, % 4 (1– 19) 39. 4 32. 8 27. 8 4 (1– 14) 32. 6 37. 1 30. 3 13. 6 9. 9 Characteristic Brain metastasis at baseline, % a Two patients in the T-DM 1 arm had missing information for prior treatment in the advanced BC setting: TPC, n=198; T-DM 1, n=402. ER, estrogen receptor; PR, progesterone receptor. 2013 105
 Combination with HER 2 -directed")
TPC Treatment Category TPC treatment category TPC (n=184 a) Combination with HER 2 -directed agent, % 83. 2 Chemotherapyb + trastuzumab 68. 5 Lapatinib + trastuzumab 10. 3 T-containing Hormonal therapy + trastuzumab 1. 6 Chemotherapyb + lapatinib 2. 7 Single-agent chemotherapy, b % 80. 4 16. 8 a Includes patients who received study treatment. b The most common chemotherapy agents used were vinorelbine, gemcitabine, eribulin, paclitaxel, and docetaxel. 2013 106
 T-DM 1 (n=404) Discontinued study, % 36. 9")
Study Discontinuation Study discontinuation TPC (n=198) T-DM 1 (n=404) Discontinued study, % 36. 9 21. 0 Death 22. 2 15. 1 Withdrawal by patient 13. 1 4. 7 Physician’s decision 1. 0 0. 5 Other 0. 5 0. 7 Reasons for study discontinuation, % 2013 107
 (n=404) Median (months) 3. 3 6.")
PFS by Investigator Assessment TPC T-DM 1 (n=198) (n=404) Median (months) 3. 3 6. 2 No. of events 129 219 Stratified HR=0. 528 (95% CI, 0. 422, 0. 661) P<0. 0001 Proportion progression-free 1. 0 0. 8 0. 6 0. 4 0. 2 0. 0 0 2 4 6 8 10 12 14 Time (months) No. at risk: TPC 198 120 62 28 13 6 1 0 T-DM 1 334 241 114 66 27 12 0 404 2013 Median follow-up: TPC, 6. 5 months; T-DM 1, 7. 2 months. Unstratified HR=0. 521 (P<0. 0001). 108
 By Investigator Assessment TPC Baseline characteristic T-DM 1 Total n")
PFS Subgroup Analyses (1) By Investigator Assessment TPC Baseline characteristic T-DM 1 Total n n All patients 602 198 129 3. 3 404 219 6. 2 0. 52 (0. 42, 0. 65) Age group <65 years 509 164 108 3. 4 345 191 5. 8 0. 55 (0. 44, 0. 70) 74 19 28 6 17 4 3. 2 3. 0 46 13 25 3 6. 9 NE 0. 42 (0. 22, 0. 80) 0. 14 (0. 02, 0. 79) 147 256 199 48 85 65 24 61 44 4. 1 3. 2 3. 1 99 171 134 58 91 70 5. 8 6. 9 5. 8 0. 71 (0. 44, 1. 14) 0. 44 (0. 32, 0. 61) 0. 53 (0. 36, 0. 78) Race White 488 161 104 3. 4 325 177 6. 3 0. 50 (0. 39, 0. 64) Asian 81 24 17 2. 8 57 30 5. 4 0. 63 (0. 35, 1. 14) Other 35 13 8 3. 3 22 12 6. 6 0. 57 (0. 23, 1. 41) 262 82 48 3. 6 180 84 7. 0 0. 44 (0. 31, 0. 64) 1 301 101 68 3. 1 200 120 5. 4 0. 63 (0. 47, 0. 85) 2 37 15 13 1. 6 22 13 6. 9 0. 41 (0. 19, 0. 92) 65– 74 years ≥ 75 years Median Event (months) n T-DM 1 Better Median Event (months) HRa (95% CI) TPC Better World region United States Western Europe Other Baseline ECOG PS 0 0. 2 0. 5 1 2 5 2013 a Unstratified HR. NE, not estimable. 109
 By Investigator Assessment TPC Baseline characteristic T-DM 1 Total n")
PFS Subgroup Analyses (2) By Investigator Assessment TPC Baseline characteristic T-DM 1 Total n n All patients 602 198 129 3. 3 404 219 6. 2 0. 52 (0. 42, 0. 65) ER and PR status ER+ and/or PR+ 311 103 66 3. 9 208 109 5. 9 0. 56 (0. 41, 0. 76) 270 21 85 10 58 5 2. 9 3. 9 185 11 105 5 6. 0 8. 3 0. 51 (0. 37, 0. 71) 0. 17 (0. 03, 0. 93) 452 150 95 3. 4 302 168 6. 2 0. 56 (0. 44, 0. 72) 150 48 34 3. 1 102 51 6. 7 0. 41 (0. 26, 0. 64) 209 214 78 65 49 45 3. 3 3. 7 131 149 60 83 6. 9 6. 2 0. 48 (0. 32, 0. 70) 0. 58 (0. 40, 0. 83) 177 55 35 2. 9 122 75 5. 8 0. 48 (0. 32, 0. 73) 67 27 16 2. 9 40 24 5. 8 0. 47 (0. 24, 0. 89) 535 171 113 3. 6 364 195 6. 2 0. 53 (0. 42, 0. 66) ER– and PR– Unknown Disease involvement Visceral Nonvisceral Number of prior regimens for advanced BC ≤ 3 4– 5 >5 Brain metastasis at baseline Yes No Median Event (months) n T-DM 1 Better Median Event (months) HRa (95% CI) 0. 2 0. 5 TPC Better 1 2 5 2013 a Unstratified HR. 110
 (n=149) Median (months) 3. 2")
PFS for Patients Treated With Trastuzumab-Containing Regimens TPC (T-containing) (n=149) Median (months) 3. 2 No. of events 101 Proportion progression-free 1. 0 0. 8 T-DM 1 (n=404) 6. 2 219 Stratified HR=0. 558 (95% CI, 0. 437, 0. 711) P<0. 0001 0. 6 0. 4 0. 2 0. 0 0 2 4 6 8 10 12 14 Time (months) No. at risk: TPC 149 99 50 20 12 5 1 0 T-DM 1 334 241 114 66 27 12 0 404 2013 Unstratified HR=0. 54 (P<0. 0001). 111

First Interim OS Analysis 1. 0 Proportion surviving Observed 21% of targeted events 0. 8 0. 6 TPC T-DM 1 (n=198) (n=404) Median (months) 14. 9 NE No. of events 44 61 Stratified HR=0. 552 (95% CI, 0. 369, 0. 826); P=0. 0034 Efficacy stopping boundary HR<0. 363 or P<0. 0000013 0. 4 0. 2 0. 0 0 2 4 6 8 10 12 14 16 Time (months) No. at risk: TPC 198 169 125 80 51 30 9 3 0 404 381 316 207 127 65 30 7 0 T-DM 1 2013 44 patients in the TPC arm received crossover T-DM 1 treatment after documented progression. Unstratified HR=0. 57 (P=0. 004). 112

ORR in Patients With Measurable Disease By Investigator Assessment Difference: 22. 7% (95% CI, 16. 2, 29. 2) P<0. 0001 40 31. 3% 35 Patients, % 30 25 20 15 8. 6% 10 5 0 14/163 TPC 108/345 TDM 1 2013 113
 T-DM 1 (n=403 a) All-grade AEs, % 88.")
Overview of AEs TPC (n=184 a) T-DM 1 (n=403 a) All-grade AEs, % 88. 6 93. 5 Grade ≥ 3 AEs, b % 43. 5 32. 3 AEs leading to treatment discontinuation, c % 10. 9 6. 7 AEs leading to dose reduction, % 19. 6 9. 4 1. 1 1. 5 LVEF <50% and ≥ 15% decrease from baseline, d % a One patient randomized to the TPC arm received 2 cycles of T-DM 1 by mistake; this patient was included in the T-DM 1 group for safety analyses. b Grade 5 AEs: TPC, 1. 6% (n=3); T-DM 1, 1. 2% (n=5). Three were considered related to T-DM 1: hepatic encephalopathy, subarachnoid hemorrhage, and pneumonitis. One was considered related to TPC: noncardiogenic pulmonary edema. c For any study drug. d No patient experienced an LVEF <40%. LVEF, left ventricular ejection fraction. 2013 114
 Nonhematologic")
Grade ≥ 3 AEs With Incidence ≥ 2% in Either Arma TPC (n=184) Nonhematologic AEs, % Diarrhea Abdominal pain AST increased Fatigue Asthenia Cellulitis Pulmonary embolism Dyspnea Hematologic AEs, % Neutropenia Febrile neutropenia Anemia Leukopenia Thrombocytopenia T-DM 1 (n=403) Any grade Grade ≥ 3 21. 7 12. 5 5. 4 25. 0 15. 8 3. 3 2. 2 9. 2 4. 3 2. 7 2. 2 2. 2 1. 6 9. 9 6. 5 8. 4 27. 0 15. 6 1. 2 0. 5 9. 9 0. 7 1. 2 2. 0 1. 0 0. 5 2. 0 21. 7 3. 8 10. 3 6. 0 3. 3 15. 8 3. 8 2. 7 1. 6 5. 5 0. 2 8. 9 0. 7 15. 1 2. 5 0. 2 2. 7 0. 2 4. 7 b a Medical Dictionary for Regulatory Activities (Med. DRA) preferred term. b Grade 5 subarachnoid hemorrhage was reported for 1 patient with grade 4 thrombocytopenia; grade 4 tumor hemorrhage was reported for 1 patient with grade 3 thrombocytopenia. The incidence of grade ≥ 3 hemorrhage of any type was 2. 2% (T-DM 1) and 0. 5% (TPC). AST, aspartate aminotransferase. Highlighting indicates grade ≥ 3 AEs with >3% difference between the TPC and T-DM 1 arms. 2013 115

Conclusions • T-DM 1 demonstrated improved efficacy and safety compared with TPC Significant improvement in PFS – – HR=0. 528; P<0. 0001 A clear and consistent treatment effect across subgroups Interim OS favored T-DM 1 but efficacy stopping boundary not crossed – HR=0. 552; P=0. 0034 Safety and ORR favored T-DM 1 – – – Fewer grade ≥ 3 AEs with T-DM 1 vs TPC: 32. 3% vs 43. 5% Fewer discontinuations and dose reductions due to AEs with T-DM 1 ORR 31. 3% vs 8. 6%, P<0. 0001 • These data reaffirm the results from the EMILIA study, demonstrating a consistent benefit with T-DM 1 in patients with previously treated HER 2 -positive advanced BC 2013 116

Thanks To all of the patients who participated in the trial and their families, as well as the participating study sites 2013 117
- Slides: 117