TAU Performance System Sameer Shende Allen D Malony
![Acknowledgements r r LLNL Alan Morris [UO] Holger Brunst and Wolfgang Nagel [TU Dresden] Acknowledgements r r LLNL Alan Morris [UO] Holger Brunst and Wolfgang Nagel [TU Dresden]](https://slidetodoc.com/presentation_image_h2/00558749d90dac8d2eb2f638bcca9298/image-2.jpg)
![TAU Measurement System Configuration r LLNL configure [OPTIONS] ¦ {-c++=<CC>, -cc=<cc>} Specify C++ and TAU Measurement System Configuration r LLNL configure [OPTIONS] ¦ {-c++=<CC>, -cc=<cc>} Specify C++ and](https://slidetodoc.com/presentation_image_h2/00558749d90dac8d2eb2f638bcca9298/image-17.jpg)
![TAU Measurement System Configuration r LLNL configure [OPTIONS] ¦ -TRACE Generate binary TAU traces TAU Measurement System Configuration r LLNL configure [OPTIONS] ¦ -TRACE Generate binary TAU traces](https://slidetodoc.com/presentation_image_h2/00558749d90dac8d2eb2f638bcca9298/image-18.jpg)
![Tau_[cxx, cc, f 90]. sh – Improves Integration in Makefiles OLD include /usr/tau-2. 14/include/Makefile Tau_[cxx, cc, f 90]. sh – Improves Integration in Makefiles OLD include /usr/tau-2. 14/include/Makefile](https://slidetodoc.com/presentation_image_h2/00558749d90dac8d2eb2f638bcca9298/image-33.jpg)
![TAU_COMPILER Options r Optional parameters for $(TAU_COMPILER): [tau_compiler. sh –help] ¦ ¦ ¦ ¦ TAU_COMPILER Options r Optional parameters for $(TAU_COMPILER): [tau_compiler. sh –help] ¦ ¦ ¦ ¦](https://slidetodoc.com/presentation_image_h2/00558749d90dac8d2eb2f638bcca9298/image-35.jpg)
![Instrumentation Specification % tau_instrumentor Usage : tau_instrumentor <pdbfile> <sourcefile> [-o <outputfile>] [-noinline] [ -g Instrumentation Specification % tau_instrumentor Usage : tau_instrumentor <pdbfile> <sourcefile> [-o <outputfile>] [-noinline] [ -g](https://slidetodoc.com/presentation_image_h2/00558749d90dac8d2eb2f638bcca9298/image-36.jpg)
![Using Opari with TAU Step I: Configure KOJAK/opari [Download from http: //www. fz-juelich. de/zam/kojak/] Using Opari with TAU Step I: Configure KOJAK/opari [Download from http: //www. fz-juelich. de/zam/kojak/]](https://slidetodoc.com/presentation_image_h2/00558749d90dac8d2eb2f638bcca9298/image-45.jpg)
![TAU Performance System Interfaces r r PDT [U. Oregon, LANL, FZJ] for instrumentation of TAU Performance System Interfaces r r PDT [U. Oregon, LANL, FZJ] for instrumentation of](https://slidetodoc.com/presentation_image_h2/00558749d90dac8d2eb2f638bcca9298/image-48.jpg)
![PAPI [UTK] r Performance Application Programming Interface ¦ The purpose of the PAPI project PAPI [UTK] r Performance Application Programming Interface ¦ The purpose of the PAPI project](https://slidetodoc.com/presentation_image_h2/00558749d90dac8d2eb2f638bcca9298/image-49.jpg)
- Slides: 141

TAU Performance System Sameer Shende, Allen D. Malony University of Oregon {sameer, malony}@cs. uoregon. edu Workshop Jan 9 -10, 2006. Classroom 1, T 1889, LLNL
![Acknowledgements r r LLNL Alan Morris UO Holger Brunst and Wolfgang Nagel TU Dresden Acknowledgements r r LLNL Alan Morris [UO] Holger Brunst and Wolfgang Nagel [TU Dresden]](https://slidetodoc.com/presentation_image_h2/00558749d90dac8d2eb2f638bcca9298/image-2.jpg)
Acknowledgements r r LLNL Alan Morris [UO] Holger Brunst and Wolfgang Nagel [TU Dresden] Bernd Mohr [Research Center Juelich, Germany] Wyatt Spear [UO] TAU Performance System 2

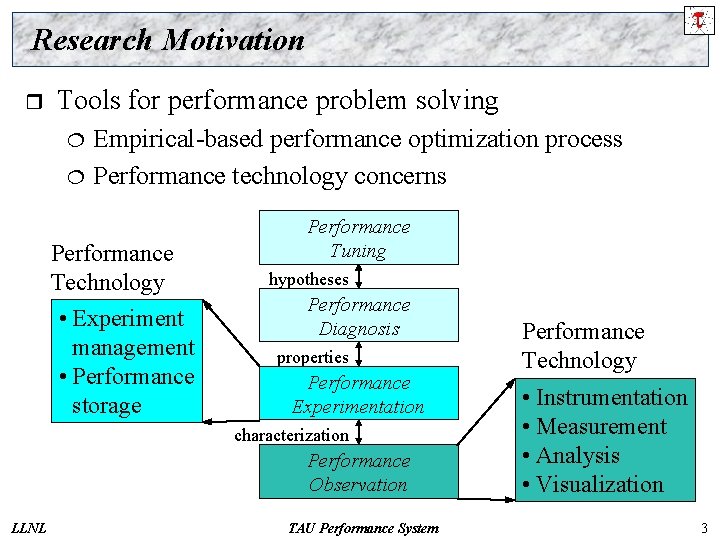
Research Motivation r Tools for performance problem solving ¦ ¦ Empirical-based performance optimization process Performance technology concerns Performance Technology • Experiment management • Performance storage Performance Tuning hypotheses Performance Diagnosis properties Performance Experimentation characterization Performance Observation LLNL TAU Performance System Performance Technology • Instrumentation • Measurement • Analysis • Visualization 3

Outline of Talk r r r Overview of TAU Instrumentation Measurement Analysis: Para. Prof and Vampir/VNG Performance data management and data mining ¦ ¦ r Multi-experiment case studies ¦ r LLNL Performance Data Management Framework (Perf. DMF) Perf. Explorer Clustering analysis Future work and concluding remarks TAU Performance System 4

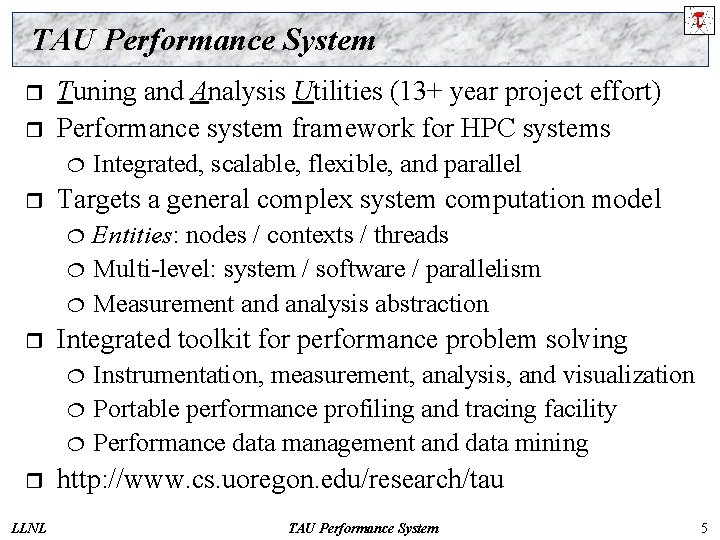
TAU Performance System r r Tuning and Analysis Utilities (13+ year project effort) Performance system framework for HPC systems ¦ r Targets a general complex system computation model ¦ ¦ ¦ r ¦ ¦ LLNL Entities: nodes / contexts / threads Multi-level: system / software / parallelism Measurement and analysis abstraction Integrated toolkit for performance problem solving ¦ r Integrated, scalable, flexible, and parallel Instrumentation, measurement, analysis, and visualization Portable performance profiling and tracing facility Performance data management and data mining http: //www. cs. uoregon. edu/research/tau TAU Performance System 5

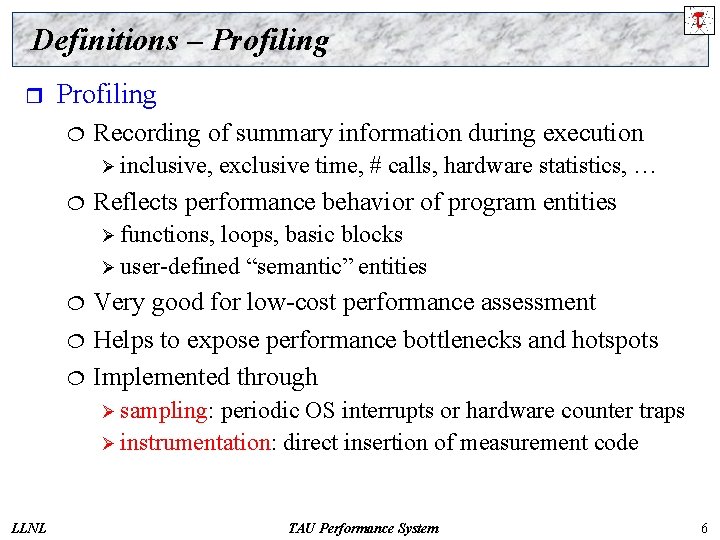
Definitions – Profiling r Profiling ¦ Recording of summary information during execution Ø inclusive, ¦ exclusive time, # calls, hardware statistics, … Reflects performance behavior of program entities Ø functions, loops, basic blocks Ø user-defined “semantic” entities ¦ ¦ ¦ Very good for low-cost performance assessment Helps to expose performance bottlenecks and hotspots Implemented through Ø sampling: periodic OS interrupts or hardware counter traps Ø instrumentation: direct insertion of measurement code LLNL TAU Performance System 6

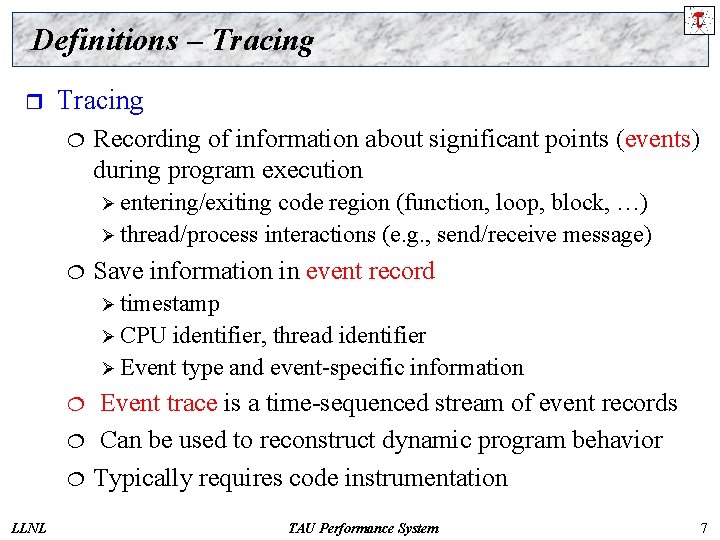
Definitions – Tracing r Tracing ¦ Recording of information about significant points (events) during program execution Ø entering/exiting code region (function, loop, block, …) Ø thread/process interactions (e. g. , send/receive message) ¦ Save information in event record Ø timestamp Ø CPU identifier, thread identifier Ø Event type and event-specific information ¦ ¦ ¦ LLNL Event trace is a time-sequenced stream of event records Can be used to reconstruct dynamic program behavior Typically requires code instrumentation TAU Performance System 7

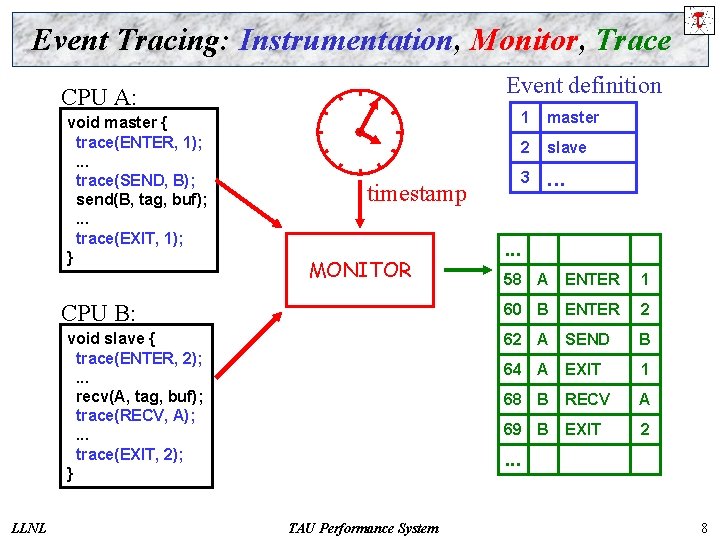
Event Tracing: Instrumentation, Monitor, Trace Event definition CPU A: void master { trace(ENTER, 1); . . . trace(SEND, B); send(B, tag, buf); . . . trace(EXIT, 1); } timestamp MONITOR CPU B: void slave { trace(ENTER, 2); . . . recv(A, tag, buf); trace(RECV, A); . . . trace(EXIT, 2); } LLNL 1 master 2 slave 3 . . . 58 A ENTER 1 60 B ENTER 2 62 A SEND B 64 A EXIT 1 68 B RECV A 69 B EXIT 2 . . . TAU Performance System 8

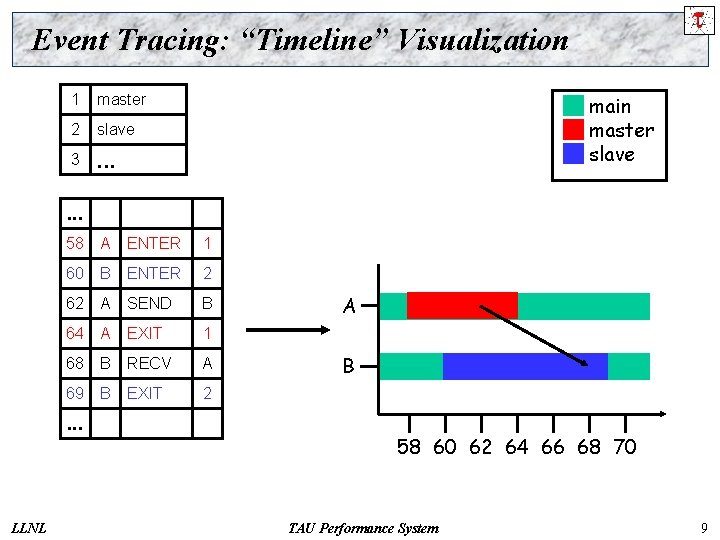
Event Tracing: “Timeline” Visualization 1 master 2 slave 3 . . . main master slave . . . 58 A ENTER 1 60 B ENTER 2 62 A SEND B 64 A EXIT 1 68 B RECV A 69 B EXIT 2 . . . LLNL A B 58 60 62 64 66 68 70 TAU Performance System 9

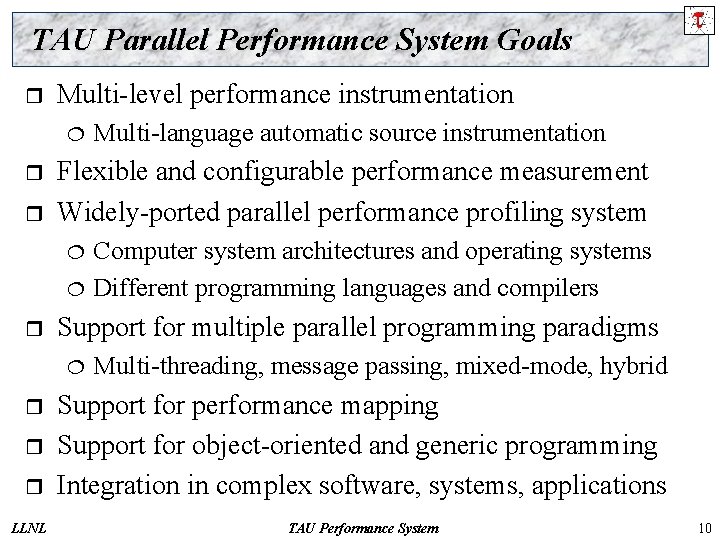
TAU Parallel Performance System Goals r Multi-level performance instrumentation ¦ r r Flexible and configurable performance measurement Widely-ported parallel performance profiling system ¦ ¦ r r r LLNL Computer system architectures and operating systems Different programming languages and compilers Support for multiple parallel programming paradigms ¦ r Multi-language automatic source instrumentation Multi-threading, message passing, mixed-mode, hybrid Support for performance mapping Support for object-oriented and generic programming Integration in complex software, systems, applications TAU Performance System 10

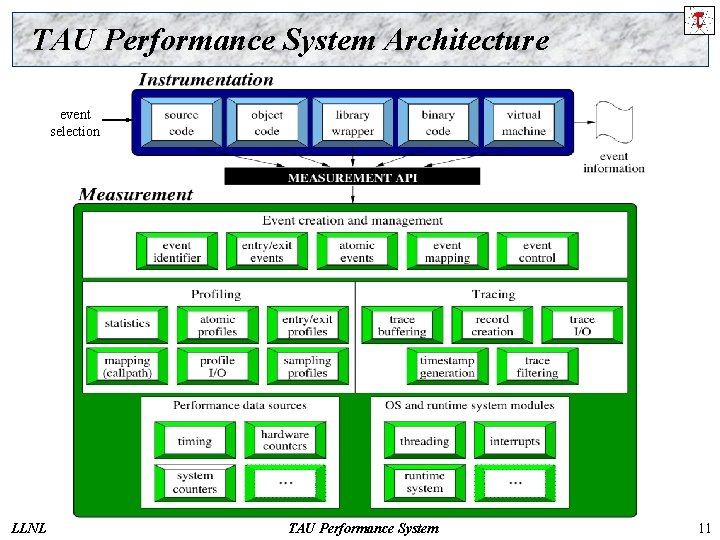
TAU Performance System Architecture event selection LLNL TAU Performance System 11

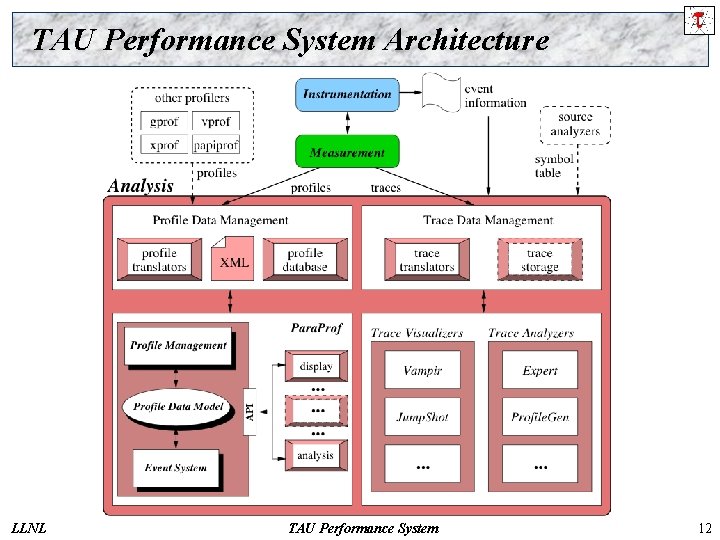
TAU Performance System Architecture LLNL TAU Performance System 12

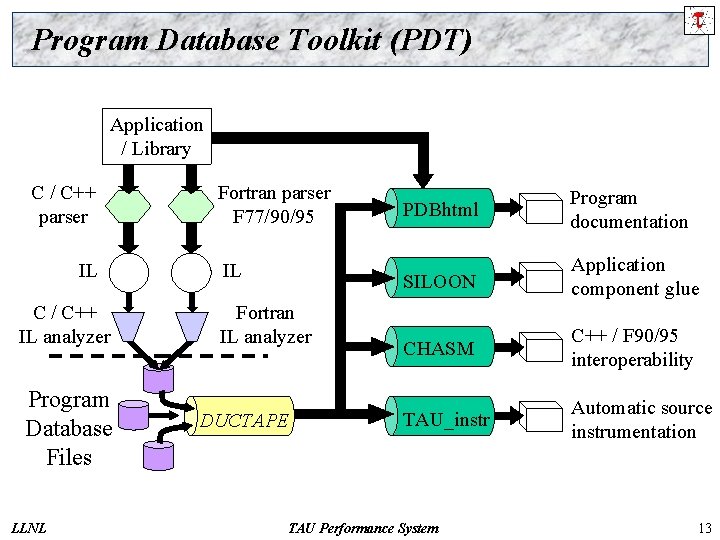
Program Database Toolkit (PDT) Application / Library C / C++ parser IL C / C++ IL analyzer Program Database Files LLNL Fortran parser F 77/90/95 IL Fortran IL analyzer DUCTAPE PDBhtml Program documentation SILOON Application component glue CHASM C++ / F 90/95 interoperability TAU_instr Automatic source instrumentation TAU Performance System 13

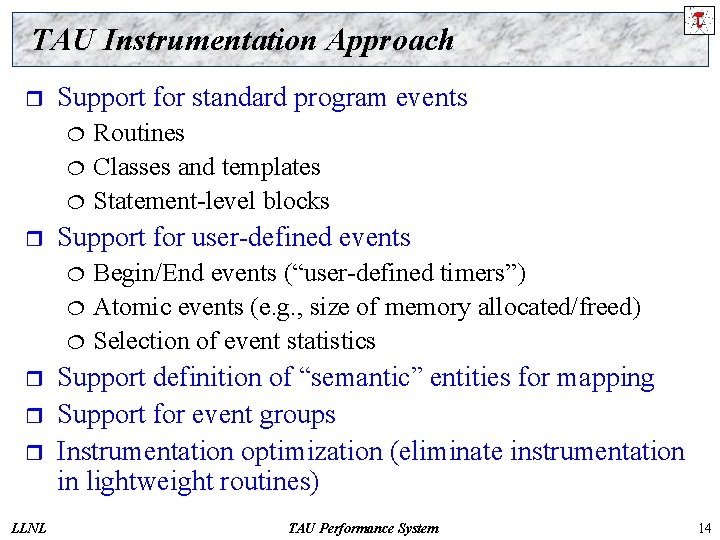
TAU Instrumentation Approach r Support for standard program events ¦ ¦ ¦ r Support for user-defined events ¦ ¦ ¦ r r r LLNL Routines Classes and templates Statement-level blocks Begin/End events (“user-defined timers”) Atomic events (e. g. , size of memory allocated/freed) Selection of event statistics Support definition of “semantic” entities for mapping Support for event groups Instrumentation optimization (eliminate instrumentation in lightweight routines) TAU Performance System 14

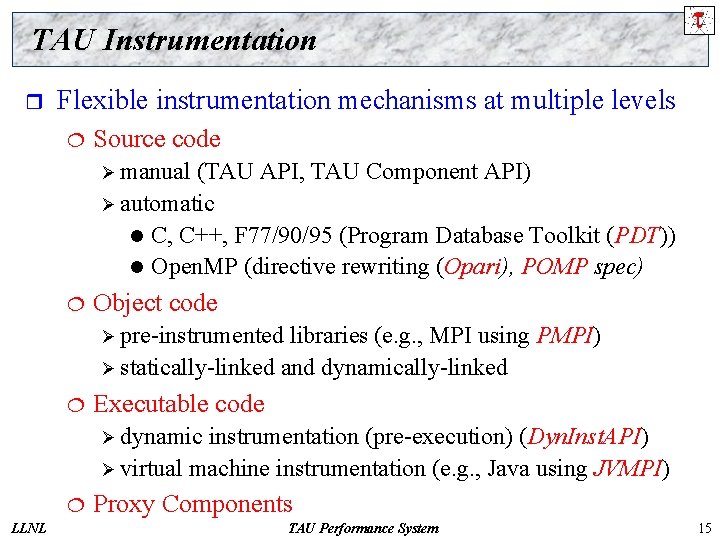
TAU Instrumentation r Flexible instrumentation mechanisms at multiple levels ¦ Source code Ø manual (TAU API, TAU Component API) Ø automatic l C, C++, F 77/90/95 (Program Database Toolkit (PDT)) l Open. MP (directive rewriting (Opari), POMP spec) ¦ Object code Ø pre-instrumented libraries (e. g. , MPI using PMPI) Ø statically-linked and dynamically-linked ¦ Executable code Ø dynamic instrumentation (pre-execution) (Dyn. Inst. API) Ø virtual machine instrumentation (e. g. , Java using JVMPI) ¦ LLNL Proxy Components TAU Performance System 15

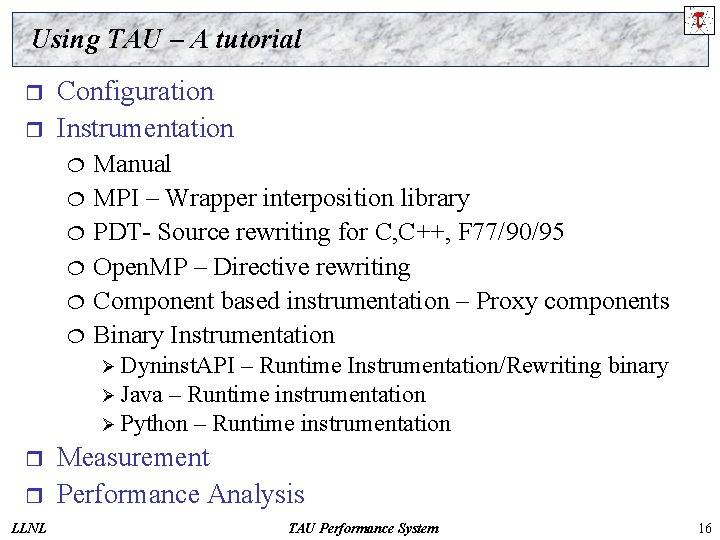
Using TAU – A tutorial r r Configuration Instrumentation ¦ ¦ ¦ Manual MPI – Wrapper interposition library PDT- Source rewriting for C, C++, F 77/90/95 Open. MP – Directive rewriting Component based instrumentation – Proxy components Binary Instrumentation Ø Dyninst. API – Runtime Instrumentation/Rewriting binary Ø Java – Runtime instrumentation Ø Python – Runtime instrumentation r r LLNL Measurement Performance Analysis TAU Performance System 16
![TAU Measurement System Configuration r LLNL configure OPTIONS cCC cccc Specify C and TAU Measurement System Configuration r LLNL configure [OPTIONS] ¦ {-c++=<CC>, -cc=<cc>} Specify C++ and](https://slidetodoc.com/presentation_image_h2/00558749d90dac8d2eb2f638bcca9298/image-17.jpg)
TAU Measurement System Configuration r LLNL configure [OPTIONS] ¦ {-c++=<CC>, -cc=<cc>} Specify C++ and C compilers ¦ {-pthread, -sproc} Use pthread or SGI sproc threads ¦ -openmp Use Open. MP threads ¦ -jdk=<dir> Specify Java instrumentation (JDK) ¦ -opari=<dir> Specify location of Opari Open. MP tool ¦ -papi=<dir> Specify location of PAPI ¦ -pdt=<dir> Specify location of PDT ¦ -dyninst=<dir> Specify location of Dyn. Inst Package ¦ -mpi[inc/lib]=<dir> Specify MPI library instrumentation ¦ -shmem[inc/lib]=<dir> Specify PSHMEM library instrumentation ¦ -python[inc/lib]=<dir> Specify Python instrumentation ¦ -epilog=<dir> Specify location of EPILOG ¦ -slog 2[=<dir>] Specify location of SLOG 2/Jumpshot ¦ -vtf=<dir> Specify location of VTF 3 trace package ¦ -arch=<architecture> Specify architecture explicitly (bgl, ibm 64 linux…) TAU Performance System 17
![TAU Measurement System Configuration r LLNL configure OPTIONS TRACE Generate binary TAU traces TAU Measurement System Configuration r LLNL configure [OPTIONS] ¦ -TRACE Generate binary TAU traces](https://slidetodoc.com/presentation_image_h2/00558749d90dac8d2eb2f638bcca9298/image-18.jpg)
TAU Measurement System Configuration r LLNL configure [OPTIONS] ¦ -TRACE Generate binary TAU traces ¦ -PROFILE (default) Generate profiles (summary) ¦ -PROFILECALLPATH Generate call path profiles ¦ -PROFILEPHASE Generate phase based profiles ¦ -PROFILEMEMORY Track heap memory for each routine ¦ -PROFILEHEADROOM Track memory headroom to grow ¦ -MULTIPLECOUNTERS Use hardware counters + time ¦ -COMPENSATE Compensate timer overhead ¦ -CPUTIME Use usertime+system time ¦ -PAPIWALLCLOCK Use PAPI’s wallclock time ¦ -PAPIVIRTUAL Use PAPI’s process virtual time ¦ -SGITIMERS Use fast IRIX timers ¦ -LINUXTIMERS Use fast x 86 Linux timers TAU Performance System 18

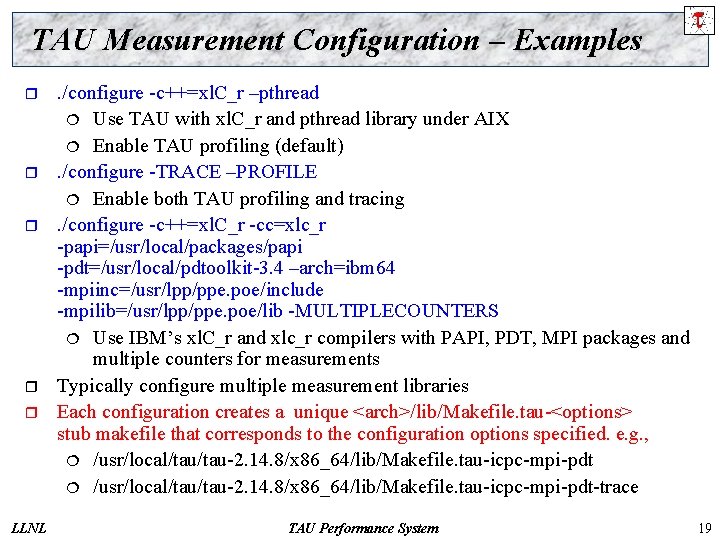
TAU Measurement Configuration – Examples r r r LLNL . /configure -c++=xl. C_r –pthread ¦ Use TAU with xl. C_r and pthread library under AIX ¦ Enable TAU profiling (default). /configure -TRACE –PROFILE ¦ Enable both TAU profiling and tracing. /configure -c++=xl. C_r -cc=xlc_r -papi=/usr/local/packages/papi -pdt=/usr/local/pdtoolkit-3. 4 –arch=ibm 64 -mpiinc=/usr/lpp/ppe. poe/include -mpilib=/usr/lpp/ppe. poe/lib -MULTIPLECOUNTERS ¦ Use IBM’s xl. C_r and xlc_r compilers with PAPI, PDT, MPI packages and multiple counters for measurements Typically configure multiple measurement libraries Each configuration creates a unique <arch>/lib/Makefile. tau-<options> stub makefile that corresponds to the configuration options specified. e. g. , ¦ /usr/local/tau/tau-2. 14. 8/x 86_64/lib/Makefile. tau-icpc-mpi-pdt-trace TAU Performance System 19

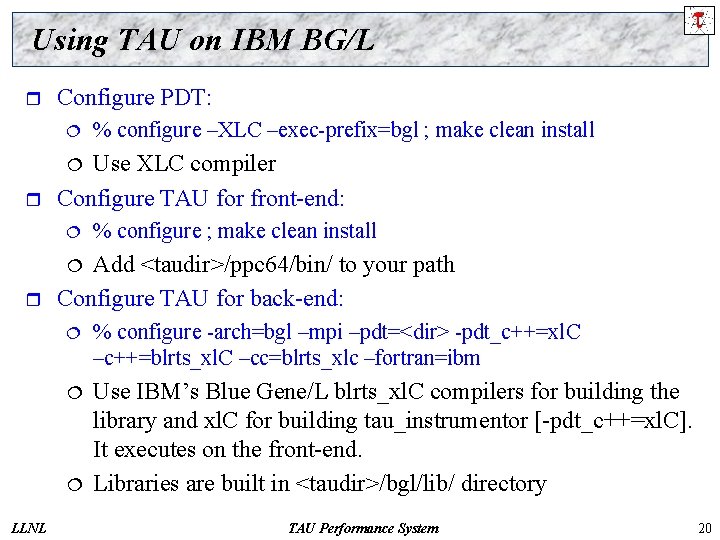
Using TAU on IBM BG/L r Configure PDT: ¦ % configure –XLC –exec-prefix=bgl ; make clean install Use XLC compiler Configure TAU for front-end: ¦ r ¦ % configure ; make clean install Add <taudir>/ppc 64/bin/ to your path Configure TAU for back-end: ¦ r ¦ % configure -arch=bgl –mpi –pdt=<dir> -pdt_c++=xl. C –c++=blrts_xl. C –cc=blrts_xlc –fortran=ibm ¦ Use IBM’s Blue Gene/L blrts_xl. C compilers for building the library and xl. C for building tau_instrumentor [-pdt_c++=xl. C]. It executes on the front-end. Libraries are built in <taudir>/bgl/lib/ directory ¦ LLNL TAU Performance System 20

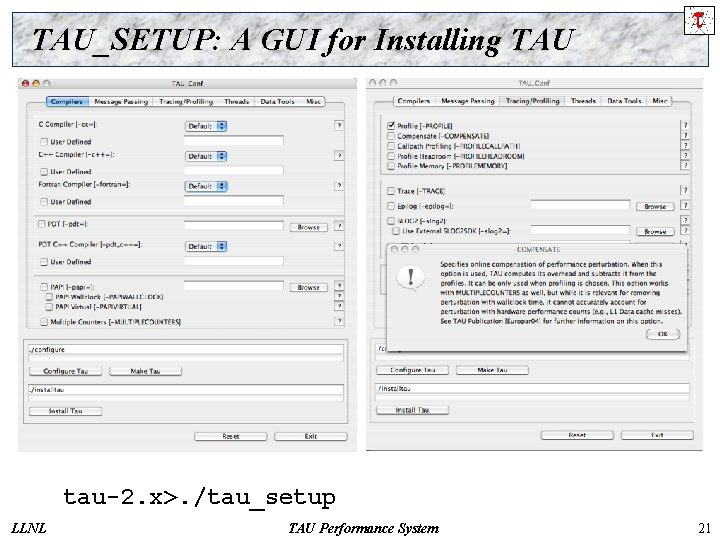
TAU_SETUP: A GUI for Installing TAU tau-2. x>. /tau_setup LLNL TAU Performance System 21

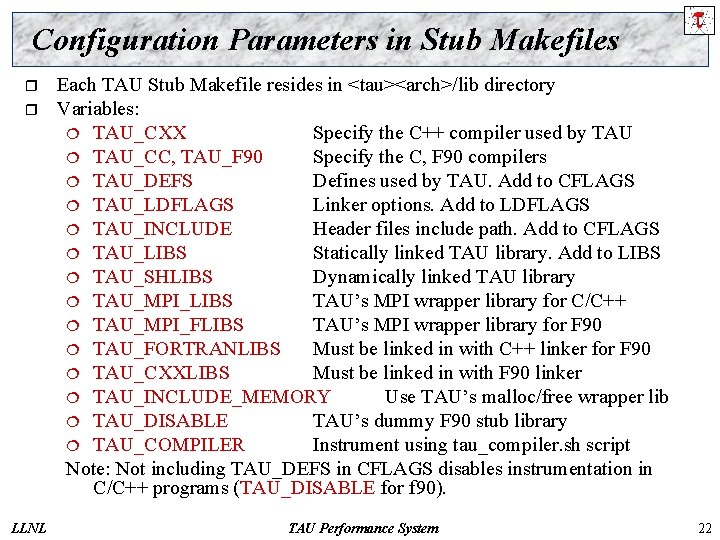
Configuration Parameters in Stub Makefiles r r LLNL Each TAU Stub Makefile resides in <tau><arch>/lib directory Variables: ¦ TAU_CXX Specify the C++ compiler used by TAU ¦ TAU_CC, TAU_F 90 Specify the C, F 90 compilers ¦ TAU_DEFS Defines used by TAU. Add to CFLAGS ¦ TAU_LDFLAGS Linker options. Add to LDFLAGS ¦ TAU_INCLUDE Header files include path. Add to CFLAGS ¦ TAU_LIBS Statically linked TAU library. Add to LIBS ¦ TAU_SHLIBS Dynamically linked TAU library ¦ TAU_MPI_LIBS TAU’s MPI wrapper library for C/C++ ¦ TAU_MPI_FLIBS TAU’s MPI wrapper library for F 90 ¦ TAU_FORTRANLIBS Must be linked in with C++ linker for F 90 ¦ TAU_CXXLIBS Must be linked in with F 90 linker ¦ TAU_INCLUDE_MEMORY Use TAU’s malloc/free wrapper lib ¦ TAU_DISABLE TAU’s dummy F 90 stub library ¦ TAU_COMPILER Instrument using tau_compiler. sh script Note: Not including TAU_DEFS in CFLAGS disables instrumentation in C/C++ programs (TAU_DISABLE for f 90). TAU Performance System 22

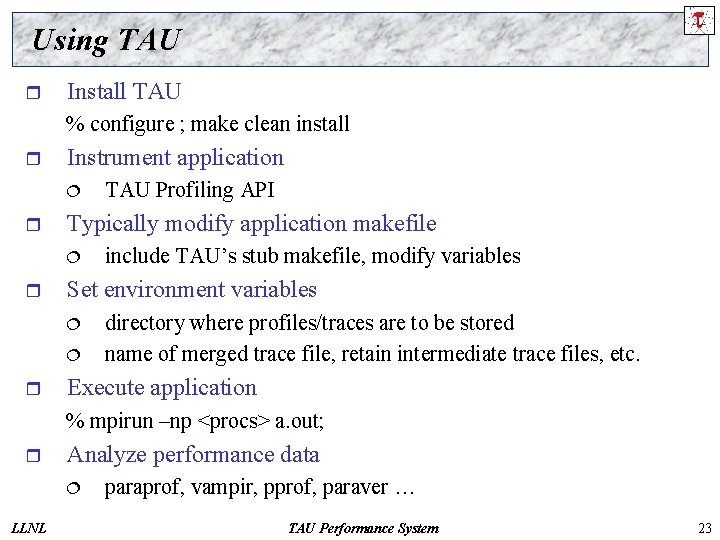
Using TAU r Install TAU % configure ; make clean install r Instrument application ¦ r Typically modify application makefile ¦ r include TAU’s stub makefile, modify variables Set environment variables ¦ ¦ r TAU Profiling API directory where profiles/traces are to be stored name of merged trace file, retain intermediate trace files, etc. Execute application % mpirun –np <procs> a. out; r Analyze performance data ¦ LLNL paraprof, vampir, pprof, paraver … TAU Performance System 23

Using TAU – A tutorial r r Configuration Instrumentation ¦ ¦ ¦ Manual MPI – Wrapper interposition library PDT- Source rewriting for C, C++, F 77/90/95 Open. MP – Directive rewriting Component based instrumentation – Proxy components Binary Instrumentation Dyninst. API – Runtime Instrumentation/Rewriting binary Ø Java – Runtime instrumentation Ø Python – Runtime instrumentation Ø r r LLNL Measurement Performance Analysis TAU Performance System 24

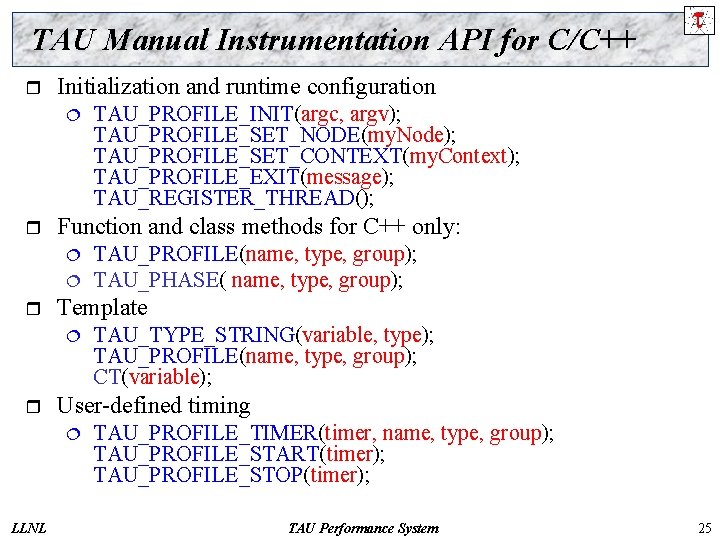
TAU Manual Instrumentation API for C/C++ r Initialization and runtime configuration ¦ r Function and class methods for C++ only: ¦ ¦ r TAU_TYPE_STRING(variable, type); TAU_PROFILE(name, type, group); CT(variable); User-defined timing ¦ LLNL TAU_PROFILE(name, type, group); TAU_PHASE( name, type, group); Template ¦ r TAU_PROFILE_INIT(argc, argv); TAU_PROFILE_SET_NODE(my. Node); TAU_PROFILE_SET_CONTEXT(my. Context); TAU_PROFILE_EXIT(message); TAU_REGISTER_THREAD(); TAU_PROFILE_TIMER(timer, name, type, group); TAU_PROFILE_START(timer); TAU_PROFILE_STOP(timer); TAU Performance System 25

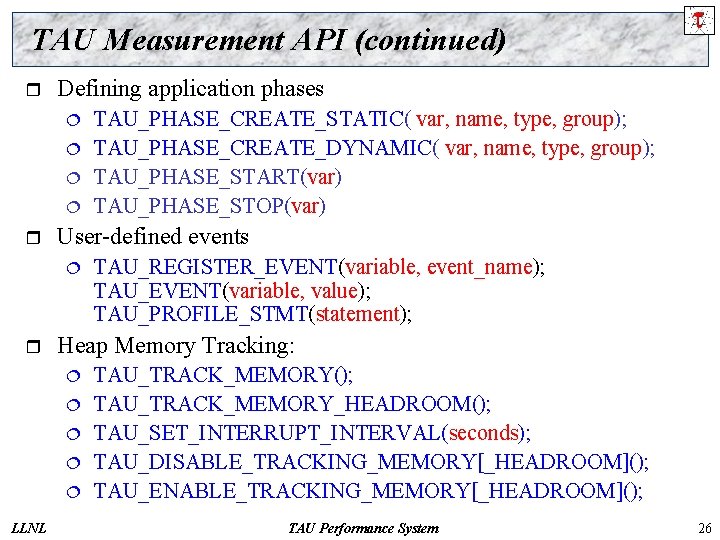
TAU Measurement API (continued) r Defining application phases ¦ ¦ r User-defined events ¦ r TAU_REGISTER_EVENT(variable, event_name); TAU_EVENT(variable, value); TAU_PROFILE_STMT(statement); Heap Memory Tracking: ¦ ¦ ¦ LLNL TAU_PHASE_CREATE_STATIC( var, name, type, group); TAU_PHASE_CREATE_DYNAMIC( var, name, type, group); TAU_PHASE_START(var) TAU_PHASE_STOP(var) TAU_TRACK_MEMORY(); TAU_TRACK_MEMORY_HEADROOM(); TAU_SET_INTERRUPT_INTERVAL(seconds); TAU_DISABLE_TRACKING_MEMORY[_HEADROOM](); TAU_ENABLE_TRACKING_MEMORY[_HEADROOM](); TAU Performance System 26

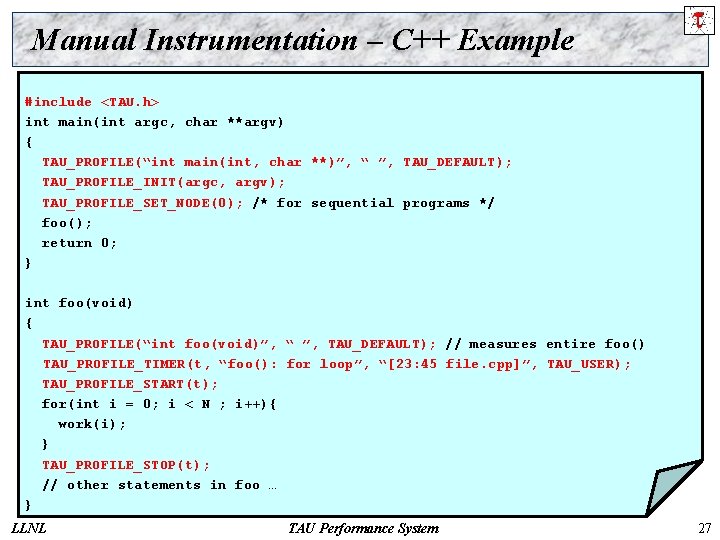
Manual Instrumentation – C++ Example #include <TAU. h> int main(int argc, char **argv) { TAU_PROFILE(“int main(int, char **)”, “ ”, TAU_DEFAULT); TAU_PROFILE_INIT(argc, argv); TAU_PROFILE_SET_NODE(0); /* for sequential programs */ foo(); return 0; } int foo(void) { TAU_PROFILE(“int foo(void)”, “ ”, TAU_DEFAULT); // measures entire foo() TAU_PROFILE_TIMER(t, “foo(): for loop”, “[23: 45 file. cpp]”, TAU_USER); TAU_PROFILE_START(t); for(int i = 0; i < N ; i++){ work(i); } TAU_PROFILE_STOP(t); // other statements in foo … } LLNL TAU Performance System 27

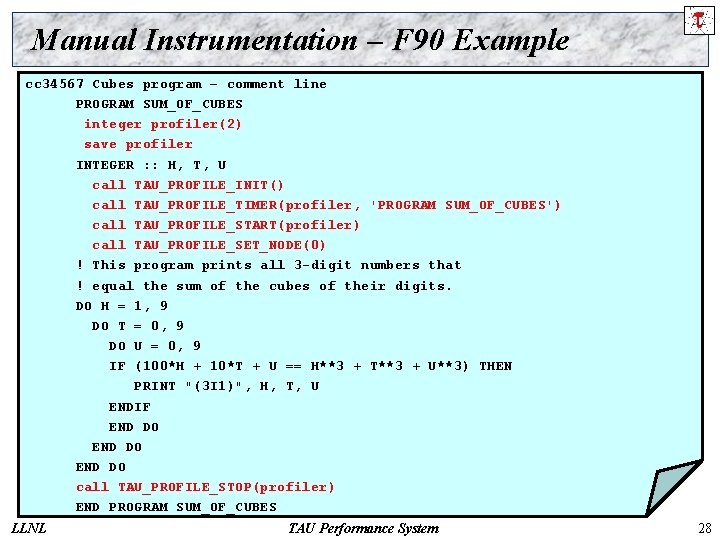
Manual Instrumentation – F 90 Example cc 34567 Cubes program – comment line PROGRAM SUM_OF_CUBES integer profiler(2) save profiler INTEGER : : H, T, U call TAU_PROFILE_INIT() call TAU_PROFILE_TIMER(profiler, 'PROGRAM SUM_OF_CUBES') call TAU_PROFILE_START(profiler) call TAU_PROFILE_SET_NODE(0) ! This program prints all 3 -digit numbers that ! equal the sum of the cubes of their digits. DO H = 1, 9 DO T = 0, 9 DO U = 0, 9 IF (100*H + 10*T + U == H**3 + T**3 + U**3) THEN PRINT "(3 I 1)", H, T, U ENDIF END DO call TAU_PROFILE_STOP(profiler) END PROGRAM SUM_OF_CUBES LLNL TAU Performance System 28

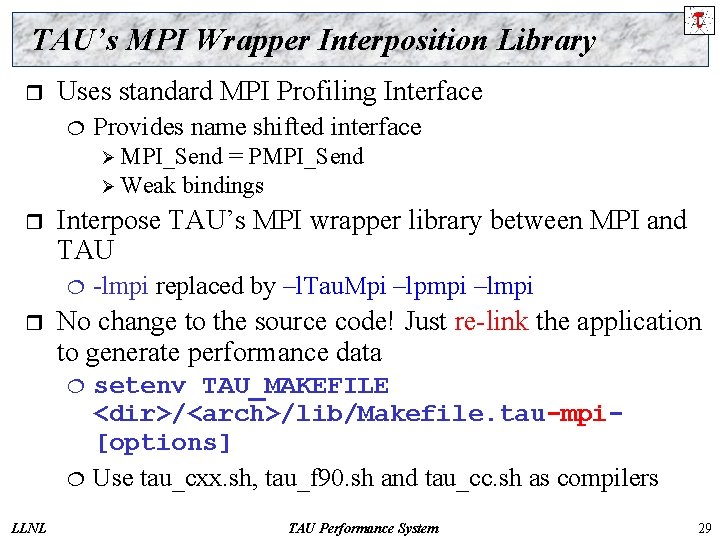
TAU’s MPI Wrapper Interposition Library r Uses standard MPI Profiling Interface ¦ Provides name shifted interface Ø MPI_Send = PMPI_Send Ø Weak bindings r Interpose TAU’s MPI wrapper library between MPI and TAU ¦ r No change to the source code! Just re-link the application to generate performance data ¦ ¦ LLNL -lmpi replaced by –l. Tau. Mpi –lpmpi –lmpi setenv TAU_MAKEFILE <dir>/<arch>/lib/Makefile. tau-mpi[options] Use tau_cxx. sh, tau_f 90. sh and tau_cc. sh as compilers TAU Performance System 29

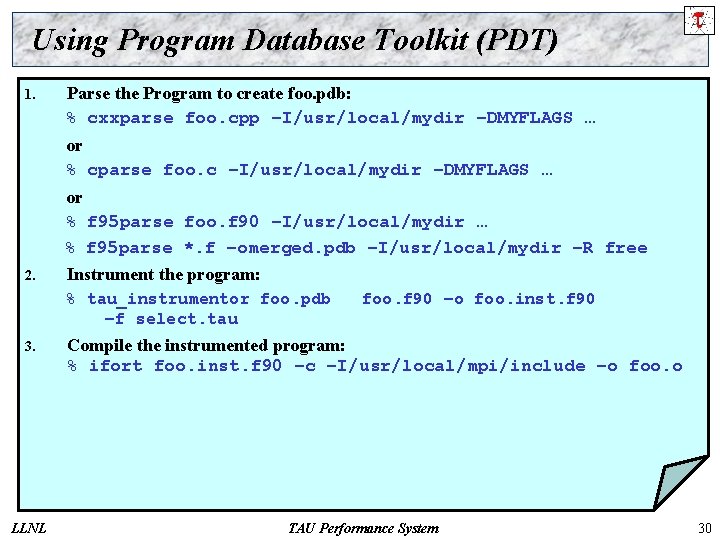
Using Program Database Toolkit (PDT) 1. Parse the Program to create foo. pdb: % cxxparse foo. cpp –I/usr/local/mydir –DMYFLAGS … or % cparse foo. c –I/usr/local/mydir –DMYFLAGS … or % f 95 parse foo. f 90 –I/usr/local/mydir … % f 95 parse *. f –omerged. pdb –I/usr/local/mydir –R free 2. Instrument the program: % tau_instrumentor foo. pdb –f select. tau 3. LLNL foo. f 90 –o foo. inst. f 90 Compile the instrumented program: % ifort foo. inst. f 90 –c –I/usr/local/mpi/include –o foo. o TAU Performance System 30

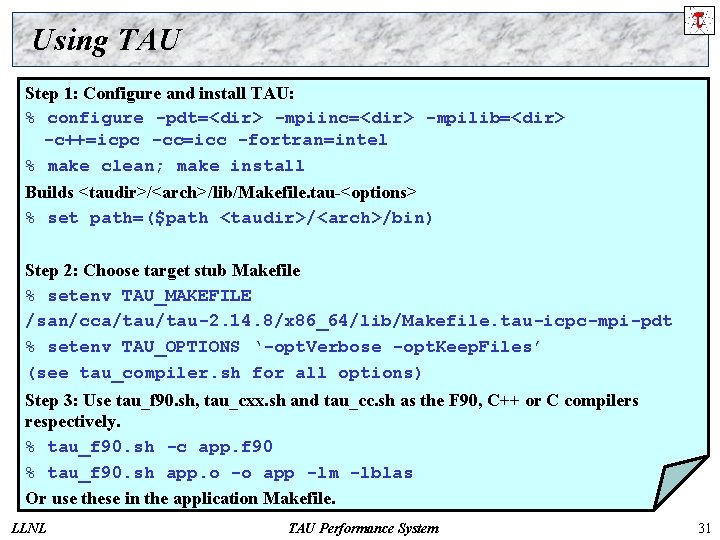
Using TAU Step 1: Configure and install TAU: % configure -pdt=<dir> -mpiinc=<dir> -mpilib=<dir> -c++=icpc -cc=icc -fortran=intel % make clean; make install Builds <taudir>/<arch>/lib/Makefile. tau-<options> % set path=($path <taudir>/<arch>/bin) Step 2: Choose target stub Makefile % setenv TAU_MAKEFILE /san/cca/tau-2. 14. 8/x 86_64/lib/Makefile. tau-icpc-mpi-pdt % setenv TAU_OPTIONS ‘-opt. Verbose -opt. Keep. Files’ (see tau_compiler. sh for all options) Step 3: Use tau_f 90. sh, tau_cxx. sh and tau_cc. sh as the F 90, C++ or C compilers respectively. % tau_f 90. sh -c app. f 90 % tau_f 90. sh app. o -o app -lm -lblas Or use these in the application Makefile. LLNL TAU Performance System 31

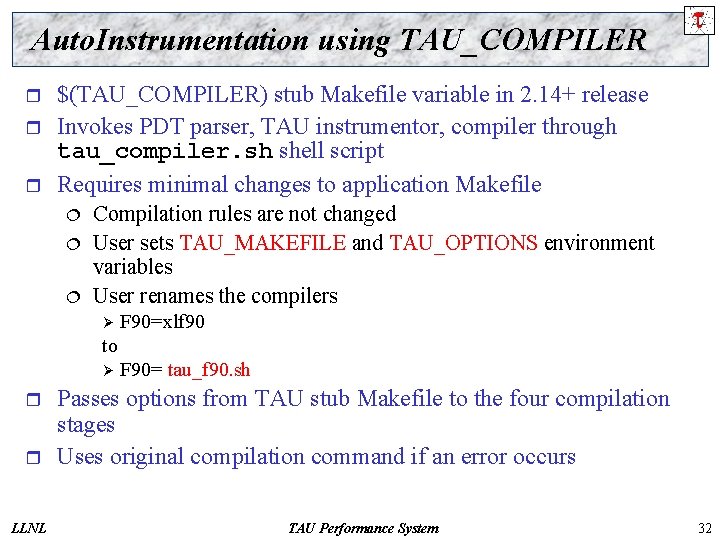
Auto. Instrumentation using TAU_COMPILER r r r $(TAU_COMPILER) stub Makefile variable in 2. 14+ release Invokes PDT parser, TAU instrumentor, compiler through tau_compiler. sh shell script Requires minimal changes to application Makefile ¦ ¦ ¦ Compilation rules are not changed User sets TAU_MAKEFILE and TAU_OPTIONS environment variables User renames the compilers Ø F 90=xlf 90 to Ø r r LLNL F 90= tau_f 90. sh Passes options from TAU stub Makefile to the four compilation stages Uses original compilation command if an error occurs TAU Performance System 32
![Taucxx cc f 90 sh Improves Integration in Makefiles OLD include usrtau2 14includeMakefile Tau_[cxx, cc, f 90]. sh – Improves Integration in Makefiles OLD include /usr/tau-2. 14/include/Makefile](https://slidetodoc.com/presentation_image_h2/00558749d90dac8d2eb2f638bcca9298/image-33.jpg)
Tau_[cxx, cc, f 90]. sh – Improves Integration in Makefiles OLD include /usr/tau-2. 14/include/Makefile CXX = mp. CC F 90 = mpxlf 90_r PDTPARSE = $(PDTDIR)/ $(PDTARCHDIR)/bin/cxxparse TAUINSTR = $(TAUROOT)/$(CONFIG_ARCH)/ bin/tau_instrumentor CFLAGS = $(TAU_DEFS) $(TAU_INCLUDE) LIBS = $(TAU_MPI_LIBS) $(TAU_LIBS) -lm OBJS = f 1. o f 2. o f 3. o … fn. o app: $(OBJS) -o $@ $(LIBS). cpp. o: $(CXX) $(LDFLAGS) NEW # set TAU_MAKEFILE and TAU_OPTIONS env vars CXX = tau_cxx. sh F 90 = tau_f 90. sh CFLAGS = LIBS = -lm OBJS = f 1. o f 2. o f 3. o … fn. o app: $(OBJS) $(CXX) $(LDFLAGS) $(OBJS) -o $@ $(LIBS). cpp. o: $(CC) $(CFLAGS) -c $< $(PDTPARSE) $< $(TAUINSTR) $*. pdb $< -o $*. i. cpp LLNL $*. i. cpp –f select. dat $(CC) $(CFLAGS) -c TAU Performance System 33

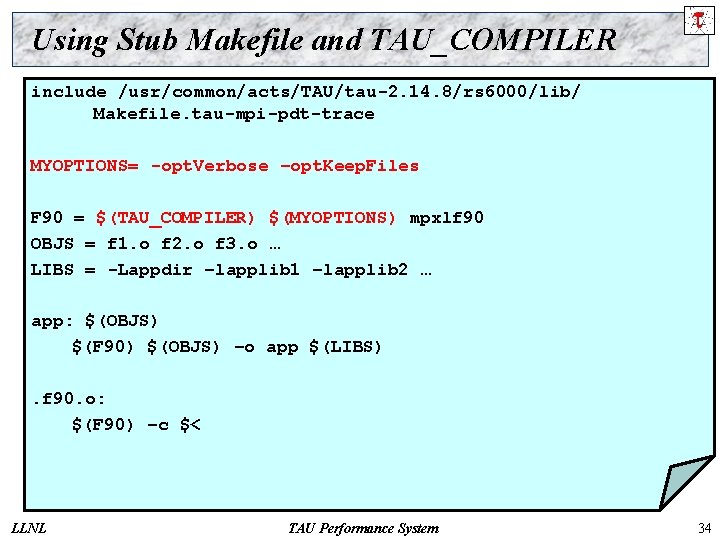
Using Stub Makefile and TAU_COMPILER include /usr/common/acts/TAU/tau-2. 14. 8/rs 6000/lib/ Makefile. tau-mpi-pdt-trace MYOPTIONS= -opt. Verbose –opt. Keep. Files F 90 = $(TAU_COMPILER) $(MYOPTIONS) mpxlf 90 OBJS = f 1. o f 2. o f 3. o … LIBS = -Lappdir –lapplib 1 –lapplib 2 … app: $(OBJS) $(F 90) $(OBJS) –o app $(LIBS). f 90. o: $(F 90) –c $< LLNL TAU Performance System 34
![TAUCOMPILER Options r Optional parameters for TAUCOMPILER taucompiler sh help TAU_COMPILER Options r Optional parameters for $(TAU_COMPILER): [tau_compiler. sh –help] ¦ ¦ ¦ ¦](https://slidetodoc.com/presentation_image_h2/00558749d90dac8d2eb2f638bcca9298/image-35.jpg)
TAU_COMPILER Options r Optional parameters for $(TAU_COMPILER): [tau_compiler. sh –help] ¦ ¦ ¦ ¦ -opt. Verbose Turn on verbose debugging messages -opt. Pdt. Dir="" PDT architecture directory. Typically $(PDTDIR)/$(PDTARCHDIR) -opt. Pdt. F 95 Opts="" Options for Fortran parser in PDT (f 95 parse) -opt. Pdt. COpts="" Options for C parser in PDT (cparse). Typically $(TAU_MPI_INCLUDE) $(TAU_DEFS) -opt. Pdt. Cxx. Opts="" Options for C++ parser in PDT (cxxparse). Typically $(TAU_MPI_INCLUDE) $(TAU_DEFS) -opt. Pdt. F 90 Parser="" Specify a different Fortran parser. For e. g. , f 90 parse instead of f 95 parse -opt. Pdt. User="" Optional arguments for parsing source code -opt. PDBFile="" Specify [merged] PDB file. Skips parsing phase. -opt. Tau. Instr="" Specify location of tau_instrumentor. Typically $(TAUROOT)/$(CONFIG_ARCH)/bin/tau_instrumentor -opt. Tau. Select. File="" Specify selective instrumentation file for tau_instrumentor -opt. Tau="" Specify options for tau_instrumentor -opt. Compile="" Options passed to the compiler. Typically $(TAU_MPI_INCLUDE) $(TAU_DEFS) -opt. Linking="" Options passed to the linker. Typically $(TAU_MPI_FLIBS) $(TAU_CXXLIBS) -opt. No. Mpi Removes -l*mpi* libraries during linking (default) -opt. Keep. Files Does not remove intermediate. pdb and. inst. * files e. g. , % setenv TAU_OPTIONS ‘-opt. Tau. Select. File=select. tau – opt. Verbose -opt. Pdt. COpts=“-I/home -DFOO” ’ % tau_cxx. sh matrix. cpp -o matrix -lm LLNL TAU Performance System 35
![Instrumentation Specification tauinstrumentor Usage tauinstrumentor pdbfile sourcefile o outputfile noinline g Instrumentation Specification % tau_instrumentor Usage : tau_instrumentor <pdbfile> <sourcefile> [-o <outputfile>] [-noinline] [ -g](https://slidetodoc.com/presentation_image_h2/00558749d90dac8d2eb2f638bcca9298/image-36.jpg)
Instrumentation Specification % tau_instrumentor Usage : tau_instrumentor <pdbfile> <sourcefile> [-o <outputfile>] [-noinline] [ -g groupname] [-i headerfile] [-c|-c++|-fortran] [-f <instr_req_file> ] For selective instrumentation, use –f option % tau_instrumentor foo. pdb foo. cpp –o foo. inst. cpp –f selective. dat % cat selective. dat # Selective instrumentation: Specify an exclude/include list of routines/files. BEGIN_EXCLUDE_LIST void quicksort(int *, int) void sort_5 elements(int *) void interchange(int *, int *) END_EXCLUDE_LIST BEGIN_FILE_INCLUDE_LIST Main. cpp Foo? . c *. C END_FILE_INCLUDE_LIST # Instruments routines in Main. cpp, Foo? . c and *. C files only # Use BEGIN_[FILE]_INCLUDE_LIST with END_[FILE]_INCLUDE_LIST LLNL TAU Performance System 36

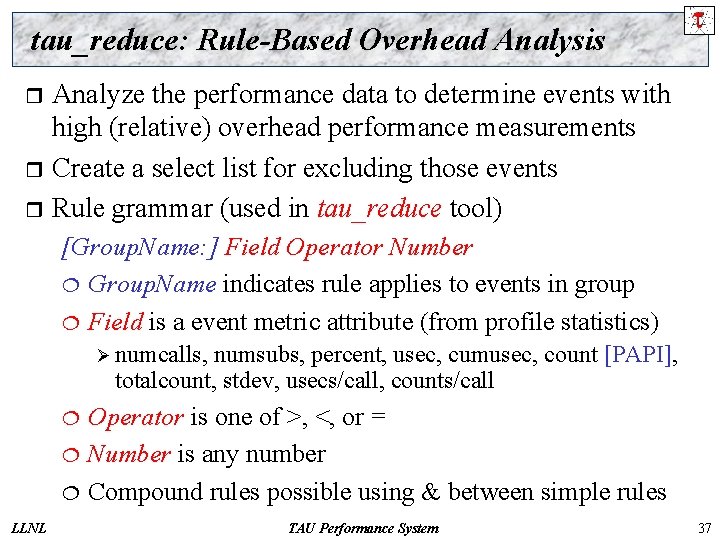
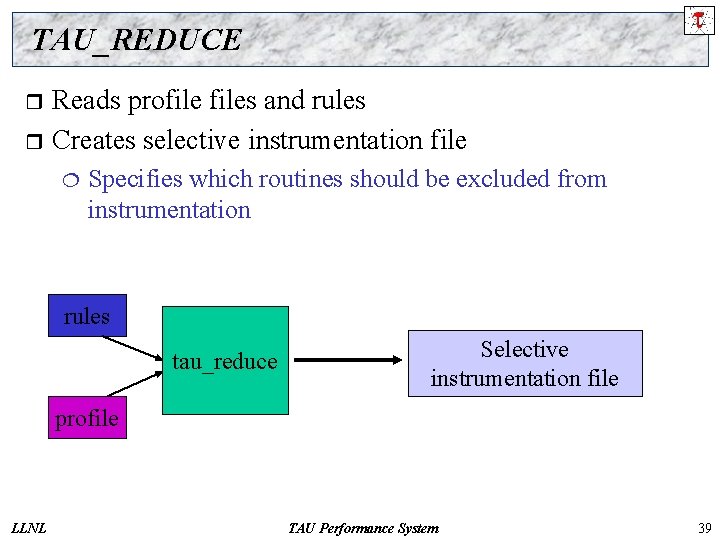
tau_reduce: Rule-Based Overhead Analysis Analyze the performance data to determine events with high (relative) overhead performance measurements r Create a select list for excluding those events r Rule grammar (used in tau_reduce tool) r [Group. Name: ] Field Operator Number ¦ Group. Name indicates rule applies to events in group ¦ Field is a event metric attribute (from profile statistics) Ø numcalls, numsubs, percent, usec, cumusec, count [PAPI], totalcount, stdev, usecs/call, counts/call Operator is one of >, <, or = ¦ Number is any number ¦ Compound rules possible using & between simple rules ¦ LLNL TAU Performance System 37

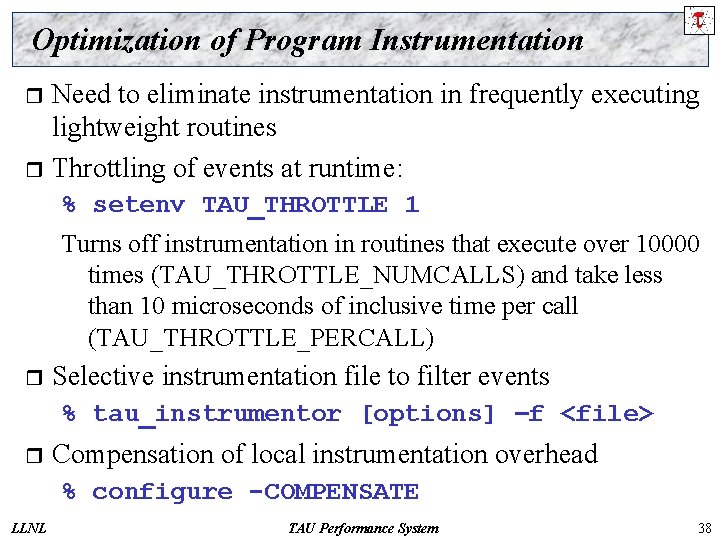
Optimization of Program Instrumentation Need to eliminate instrumentation in frequently executing lightweight routines r Throttling of events at runtime: r % setenv TAU_THROTTLE 1 Turns off instrumentation in routines that execute over 10000 times (TAU_THROTTLE_NUMCALLS) and take less than 10 microseconds of inclusive time per call (TAU_THROTTLE_PERCALL) r Selective instrumentation file to filter events % tau_instrumentor [options] –f <file> r Compensation of local instrumentation overhead % configure -COMPENSATE LLNL TAU Performance System 38

TAU_REDUCE Reads profiles and rules r Creates selective instrumentation file r ¦ Specifies which routines should be excluded from instrumentation rules tau_reduce Selective instrumentation file profile LLNL TAU Performance System 39

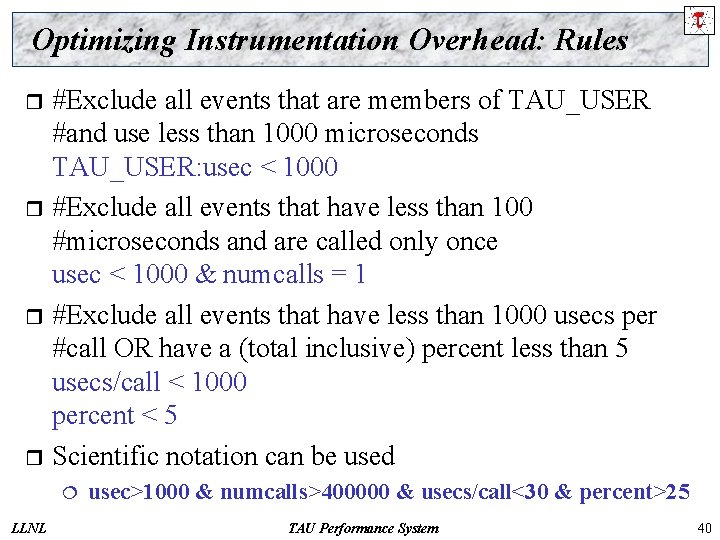
Optimizing Instrumentation Overhead: Rules #Exclude all events that are members of TAU_USER #and use less than 1000 microseconds TAU_USER: usec < 1000 r #Exclude all events that have less than 100 #microseconds and are called only once usec < 1000 & numcalls = 1 r #Exclude all events that have less than 1000 usecs per #call OR have a (total inclusive) percent less than 5 usecs/call < 1000 percent < 5 r Scientific notation can be used r ¦ LLNL usec>1000 & numcalls>400000 & usecs/call<30 & percent>25 TAU Performance System 40

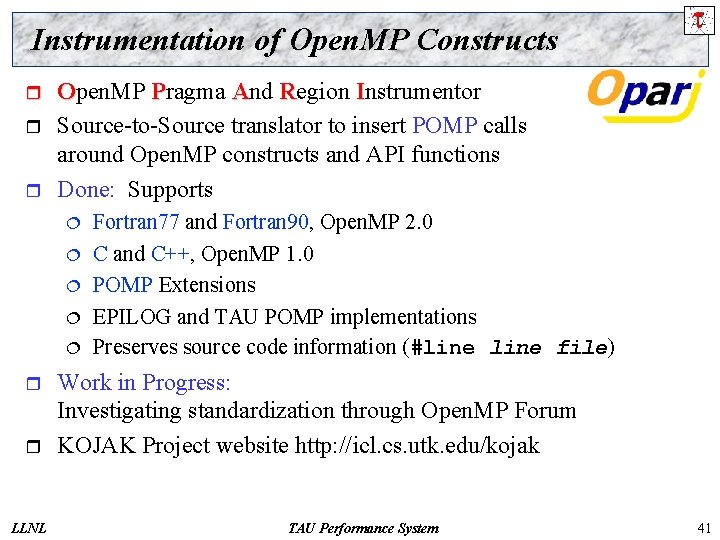
Instrumentation of Open. MP Constructs r r r Open. MP Pragma And Region Instrumentor Source-to-Source translator to insert POMP calls around Open. MP constructs and API functions Done: Supports ¦ ¦ ¦ r r LLNL Fortran 77 and Fortran 90, Open. MP 2. 0 C and C++, Open. MP 1. 0 POMP Extensions EPILOG and TAU POMP implementations Preserves source code information (#line file) Work in Progress: Investigating standardization through Open. MP Forum KOJAK Project website http: //icl. cs. utk. edu/kojak TAU Performance System 41

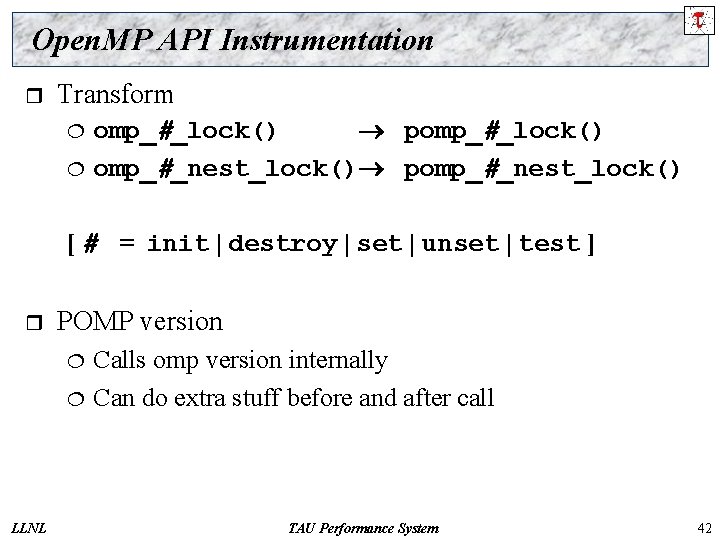
Open. MP API Instrumentation r Transform ¦ ¦ omp_#_lock() pomp_#_lock() omp_#_nest_lock() pomp_#_nest_lock() [ # = init | destroy | set | unset | test ] r POMP version ¦ ¦ LLNL Calls omp version internally Can do extra stuff before and after call TAU Performance System 42

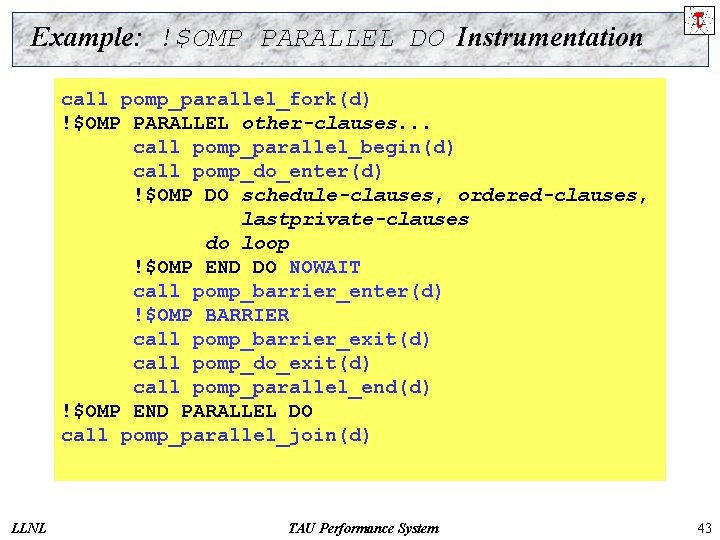
Example: !$OMP PARALLEL DO Instrumentation call pomp_parallel_fork(d) !$OMP PARALLEL DO other-clauses. . . call pomp_parallel_begin(d) call pomp_do_enter(d) !$OMP DO schedule-clauses, ordered-clauses, lastprivate-clauses do loop !$OMP END DO NOWAIT call pomp_barrier_enter(d) !$OMP BARRIER call pomp_barrier_exit(d) call pomp_do_exit(d) call pomp_parallel_end(d) !$OMP END PARALLEL DO call pomp_parallel_join(d) LLNL TAU Performance System 43

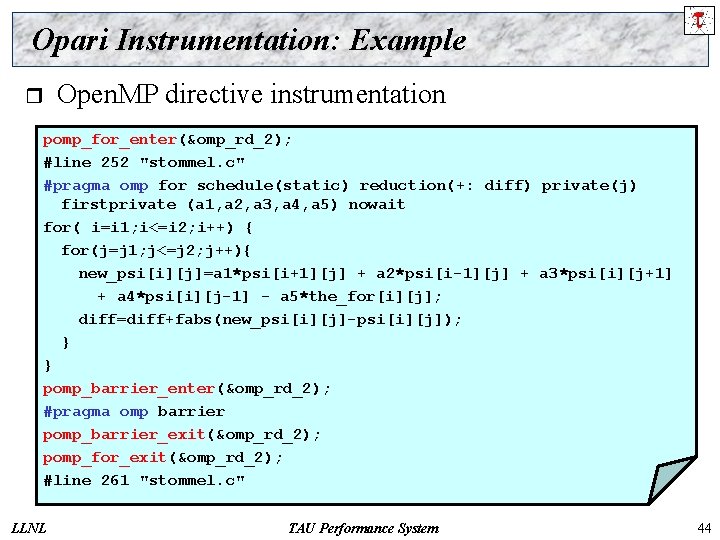
Opari Instrumentation: Example r Open. MP directive instrumentation pomp_for_enter(&omp_rd_2); #line 252 "stommel. c" #pragma omp for schedule(static) reduction(+: diff) private(j) firstprivate (a 1, a 2, a 3, a 4, a 5) nowait for( i=i 1; i<=i 2; i++) { for(j=j 1; j<=j 2; j++){ new_psi[i][j]=a 1*psi[i+1][j] + a 2*psi[i-1][j] + a 3*psi[i][j+1] + a 4*psi[i][j-1] - a 5*the_for[i][j]; diff=diff+fabs(new_psi[i][j]-psi[i][j]); } } pomp_barrier_enter(&omp_rd_2); #pragma omp barrier pomp_barrier_exit(&omp_rd_2); pomp_for_exit(&omp_rd_2); #line 261 "stommel. c" LLNL TAU Performance System 44
![Using Opari with TAU Step I Configure KOJAKopari Download from http www fzjuelich dezamkojak Using Opari with TAU Step I: Configure KOJAK/opari [Download from http: //www. fz-juelich. de/zam/kojak/]](https://slidetodoc.com/presentation_image_h2/00558749d90dac8d2eb2f638bcca9298/image-45.jpg)
Using Opari with TAU Step I: Configure KOJAK/opari [Download from http: //www. fz-juelich. de/zam/kojak/] % cd kojak-2. 1; cp mf/Makefile. defs. ibm Makefile. defs; edit Makefile % make Builds opari Step II: Configure TAU with Opari (used here with MPI and PDT) % configure –opari=/usr/contrib/TAU/kojak-2. 1/opari -mpiinc=/usr/lpp/ppe. poe/include –mpilib=/usr/lpp/ppe. poe/lib –pdt=/usr/contrib/TAU/pdtoolkit-3. 4 % make clean; make install % setenv TAU_MAKEFILE /tau/<arch>/lib/Makefile. tau-…opari-… % tau_cxx. sh -c foo. cpp % tau_cxx. sh -c bar. f 90 % tau_cxx. sh *. o -o app LLNL TAU Performance System 45

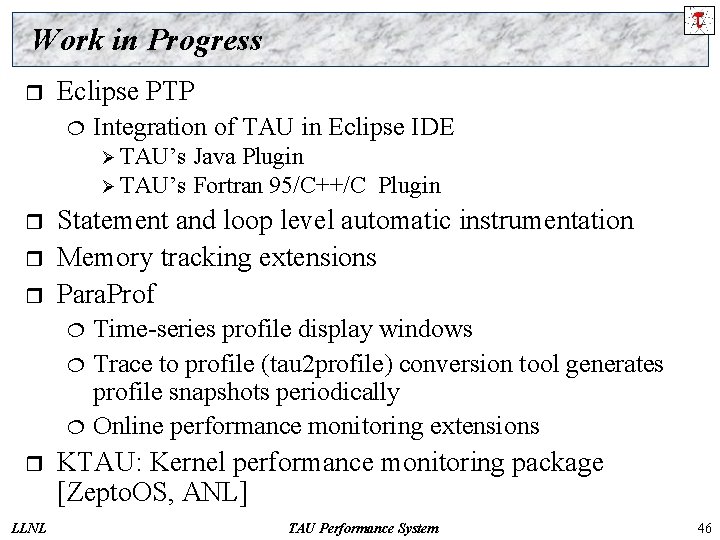
Work in Progress r Eclipse PTP ¦ Integration of TAU in Eclipse IDE Ø TAU’s Java Plugin Ø TAU’s Fortran 95/C++/C Plugin r r r Statement and loop level automatic instrumentation Memory tracking extensions Para. Prof ¦ ¦ ¦ r LLNL Time-series profile display windows Trace to profile (tau 2 profile) conversion tool generates profile snapshots periodically Online performance monitoring extensions KTAU: Kernel performance monitoring package [Zepto. OS, ANL] TAU Performance System 46

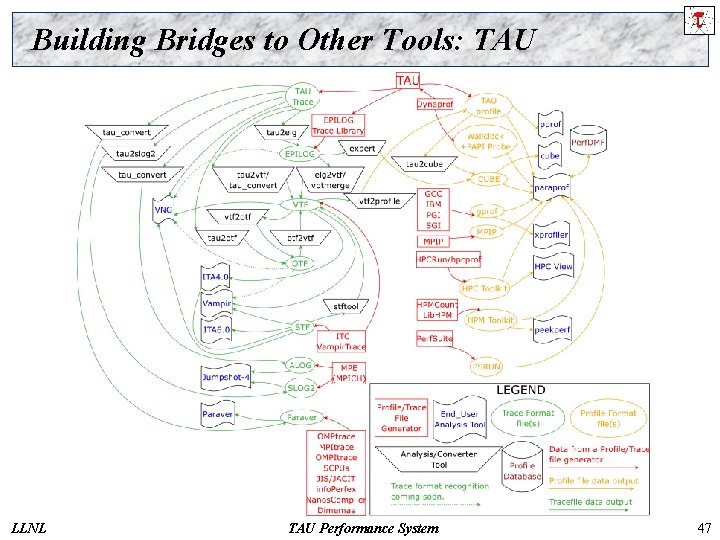
Building Bridges to Other Tools: TAU LLNL TAU Performance System 47
![TAU Performance System Interfaces r r PDT U Oregon LANL FZJ for instrumentation of TAU Performance System Interfaces r r PDT [U. Oregon, LANL, FZJ] for instrumentation of](https://slidetodoc.com/presentation_image_h2/00558749d90dac8d2eb2f638bcca9298/image-48.jpg)
TAU Performance System Interfaces r r PDT [U. Oregon, LANL, FZJ] for instrumentation of C++, C 99, F 95 source code PAPI [UTK] & PCL[FZJ] for accessing hardware performance counters data Dyninst. API [U. Maryland, U. Wisconsin] for runtime instrumentation KOJAK [FZJ, UTK] ¦ ¦ ¦ r r r Vampir/Intel® Trace Analyzer [Pallas/Intel] VTF 3 trace generation library for Vampir [TU Dresden] (available from TAU website) Paraver trace visualizer [CEPBA] Jumpshot-4 trace visualizer [MPICH, ANL] JVMPI from JDK for Java program instrumentation [Sun] Paraprofile browser/Perf. DMF database supports: ¦ ¦ ¦ r LLNL Epilog trace generation library CUBE callgraph visualizer Opari Open. MP directive rewriting tool TAU format Gprof [GNU] HPM Toolkit [IBM] Mpi. P [ORNL, LLNL] Dynaprof [UTK] PSRun [NCSA] Perf. DMF database can use Oracle, My. SQL or Postgre. SQL (IBM DB 2 support planned) TAU Performance System 48
![PAPI UTK r Performance Application Programming Interface The purpose of the PAPI project PAPI [UTK] r Performance Application Programming Interface ¦ The purpose of the PAPI project](https://slidetodoc.com/presentation_image_h2/00558749d90dac8d2eb2f638bcca9298/image-49.jpg)
PAPI [UTK] r Performance Application Programming Interface ¦ The purpose of the PAPI project is to design, standardize and implement a portable and efficient API to access the hardware performance monitor counters found on most modern microprocessors. Parallel Tools Consortium project r University of Tennessee, Knoxville r http: //icl. cs. utk. edu/papi r LLNL TAU Performance System 49

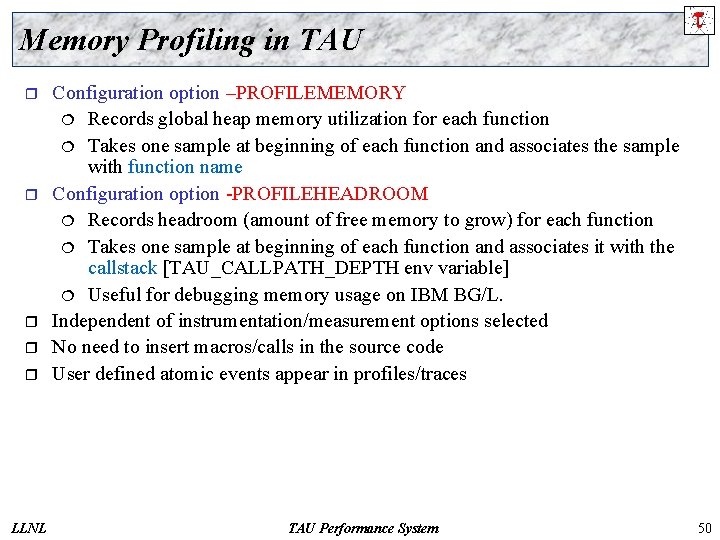
Memory Profiling in TAU r Configuration option –PROFILEMEMORY ¦ Records global heap memory utilization for each function ¦ Takes one sample at beginning of each function and associates the sample with function name Configuration option -PROFILEHEADROOM ¦ Records headroom (amount of free memory to grow) for each function ¦ Takes one sample at beginning of each function and associates it with the callstack [TAU_CALLPATH_DEPTH env variable] ¦ Useful for debugging memory usage on IBM BG/L. Independent of instrumentation/measurement options selected No need to insert macros/calls in the source code User defined atomic events appear in profiles/traces LLNL TAU Performance System r r 50

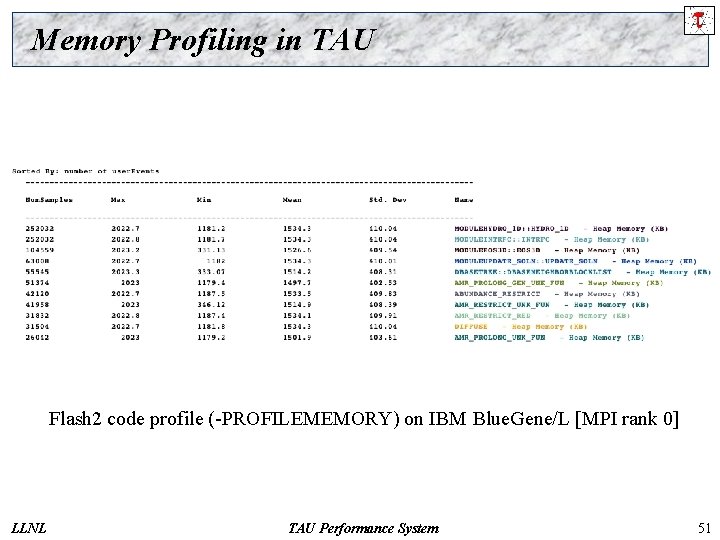
Memory Profiling in TAU Flash 2 code profile (-PROFILEMEMORY) on IBM Blue. Gene/L [MPI rank 0] LLNL TAU Performance System 51

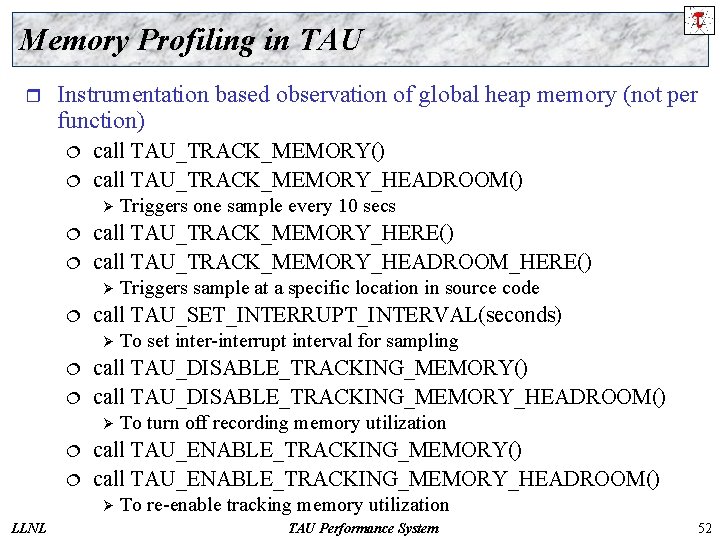
Memory Profiling in TAU r Instrumentation based observation of global heap memory (not per function) ¦ ¦ call TAU_TRACK_MEMORY() call TAU_TRACK_MEMORY_HEADROOM() Ø ¦ ¦ call TAU_TRACK_MEMORY_HERE() call TAU_TRACK_MEMORY_HEADROOM_HERE() Ø ¦ ¦ ¦ To turn off recording memory utilization call TAU_ENABLE_TRACKING_MEMORY() call TAU_ENABLE_TRACKING_MEMORY_HEADROOM() Ø LLNL To set inter-interrupt interval for sampling call TAU_DISABLE_TRACKING_MEMORY() call TAU_DISABLE_TRACKING_MEMORY_HEADROOM() Ø ¦ Triggers sample at a specific location in source code call TAU_SET_INTERRUPT_INTERVAL(seconds) Ø ¦ Triggers one sample every 10 secs To re-enable tracking memory utilization TAU Performance System 52

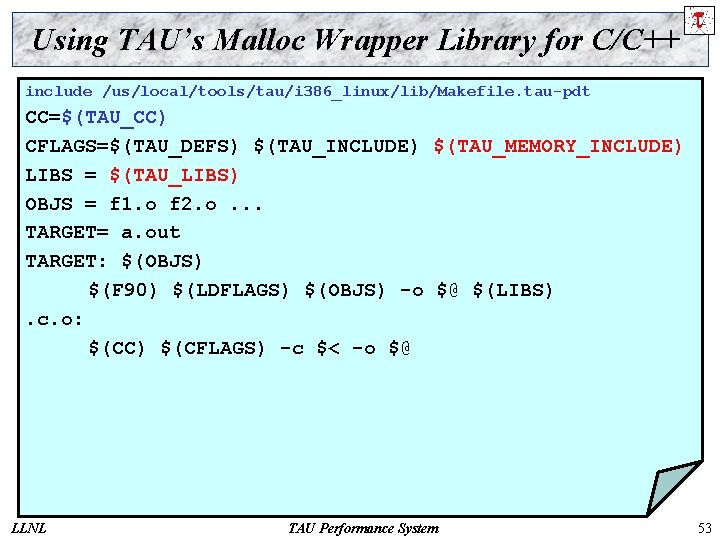
Using TAU’s Malloc Wrapper Library for C/C++ include /us/local/tools/tau/i 386_linux/lib/Makefile. tau-pdt CC=$(TAU_CC) CFLAGS=$(TAU_DEFS) $(TAU_INCLUDE) $(TAU_MEMORY_INCLUDE) LIBS = $(TAU_LIBS) OBJS = f 1. o f 2. o. . . TARGET= a. out TARGET: $(OBJS) $(F 90) $(LDFLAGS) $(OBJS) -o $@ $(LIBS). c. o: $(CC) $(CFLAGS) -c $< -o $@ LLNL TAU Performance System 53

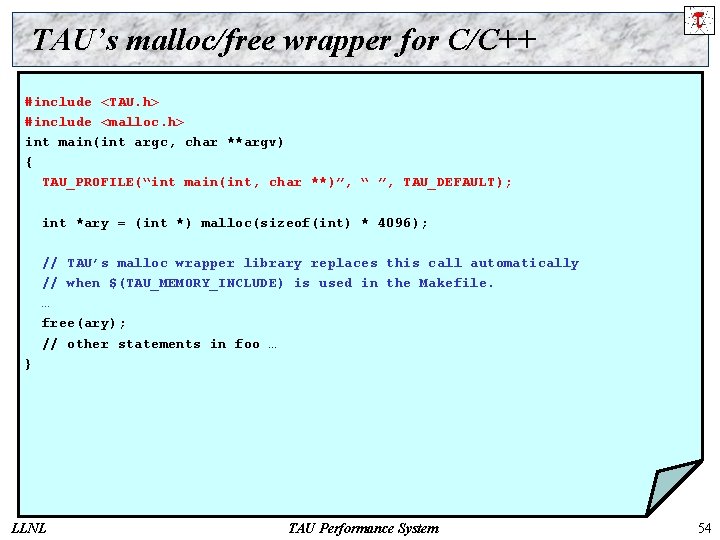
TAU’s malloc/free wrapper for C/C++ #include <TAU. h> #include <malloc. h> int main(int argc, char **argv) { TAU_PROFILE(“int main(int, char **)”, “ ”, TAU_DEFAULT); int *ary = (int *) malloc(sizeof(int) * 4096); // TAU’s malloc wrapper library replaces this call automatically // when $(TAU_MEMORY_INCLUDE) is used in the Makefile. … free(ary); // other statements in foo … } LLNL TAU Performance System 54

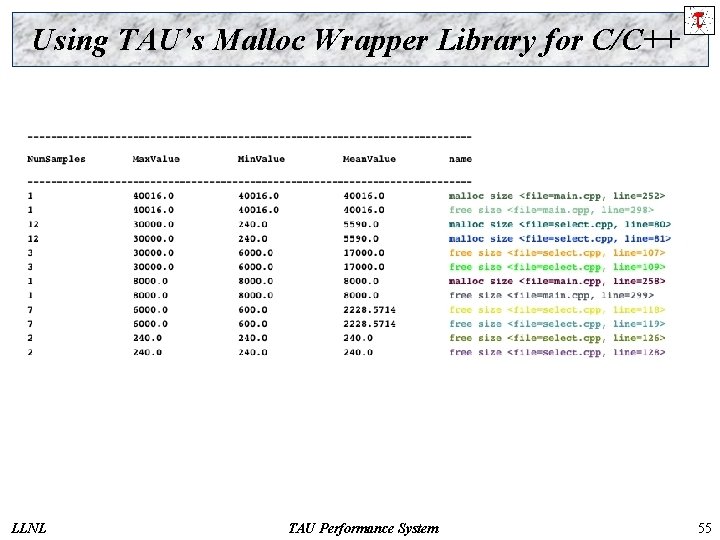
Using TAU’s Malloc Wrapper Library for C/C++ LLNL TAU Performance System 55

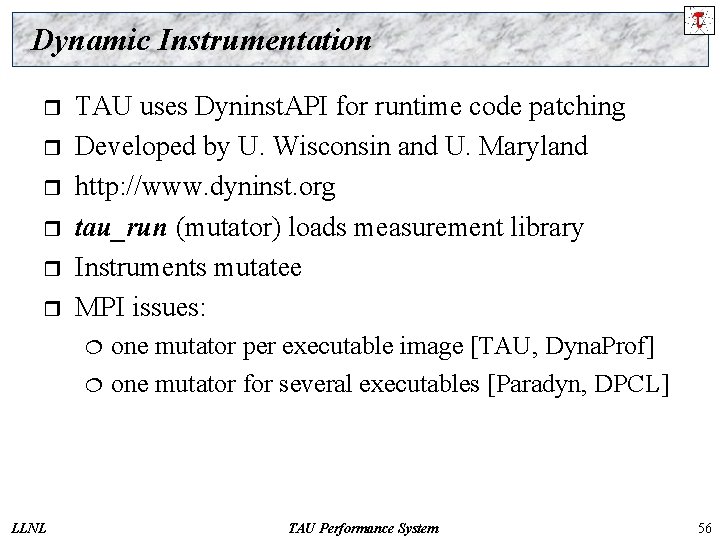
Dynamic Instrumentation r r r TAU uses Dyninst. API for runtime code patching Developed by U. Wisconsin and U. Maryland http: //www. dyninst. org tau_run (mutator) loads measurement library Instruments mutatee MPI issues: ¦ ¦ LLNL one mutator per executable image [TAU, Dyna. Prof] one mutator for several executables [Paradyn, DPCL] TAU Performance System 56

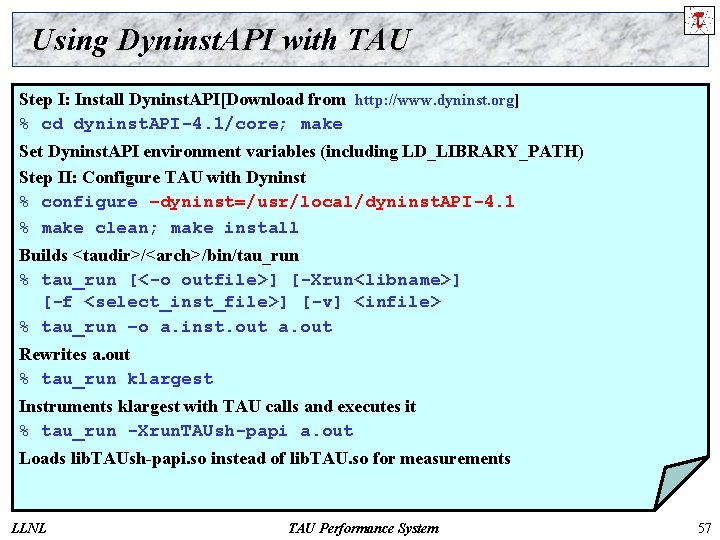
Using Dyninst. API with TAU Step I: Install Dyninst. API[Download from http: //www. dyninst. org] % cd dyninst. API-4. 1/core; make Set Dyninst. API environment variables (including LD_LIBRARY_PATH) Step II: Configure TAU with Dyninst % configure –dyninst=/usr/local/dyninst. API-4. 1 % make clean; make install Builds <taudir>/<arch>/bin/tau_run % tau_run [<-o outfile>] [-Xrun<libname>] [-f <select_inst_file>] [-v] <infile> % tau_run –o a. inst. out a. out Rewrites a. out % tau_run klargest Instruments klargest with TAU calls and executes it % tau_run -Xrun. TAUsh-papi a. out Loads lib. TAUsh-papi. so instead of lib. TAU. so for measurements LLNL TAU Performance System 57

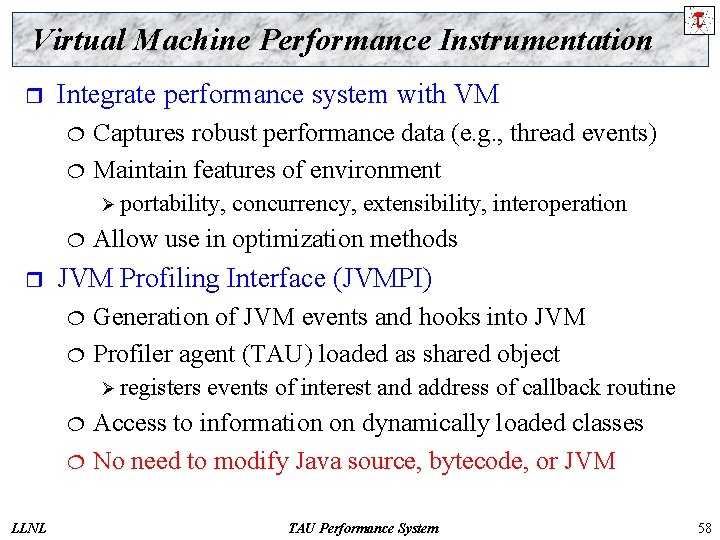
Virtual Machine Performance Instrumentation r Integrate performance system with VM ¦ ¦ Captures robust performance data (e. g. , thread events) Maintain features of environment Ø portability, ¦ r Allow use in optimization methods JVM Profiling Interface (JVMPI) ¦ ¦ Generation of JVM events and hooks into JVM Profiler agent (TAU) loaded as shared object Ø registers ¦ ¦ LLNL concurrency, extensibility, interoperation events of interest and address of callback routine Access to information on dynamically loaded classes No need to modify Java source, bytecode, or JVM TAU Performance System 58

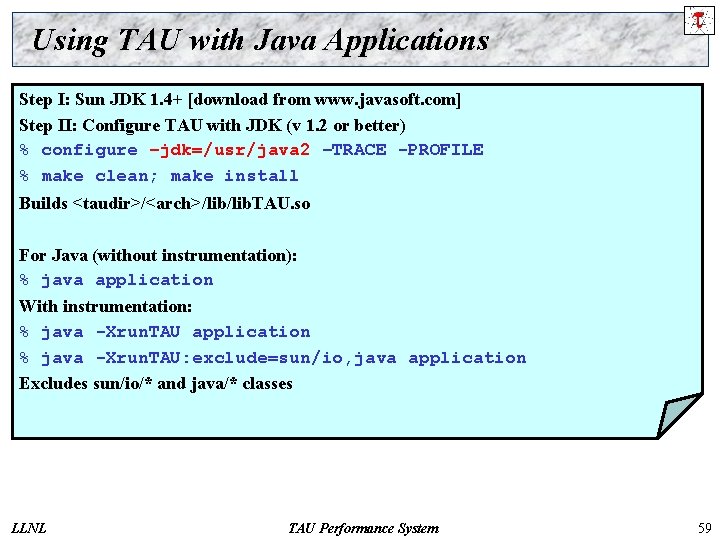
Using TAU with Java Applications Step I: Sun JDK 1. 4+ [download from www. javasoft. com] Step II: Configure TAU with JDK (v 1. 2 or better) % configure –jdk=/usr/java 2 –TRACE -PROFILE % make clean; make install Builds <taudir>/<arch>/lib. TAU. so For Java (without instrumentation): % java application With instrumentation: % java -Xrun. TAU application % java -Xrun. TAU: exclude=sun/io, java application Excludes sun/io/* and java/* classes LLNL TAU Performance System 59

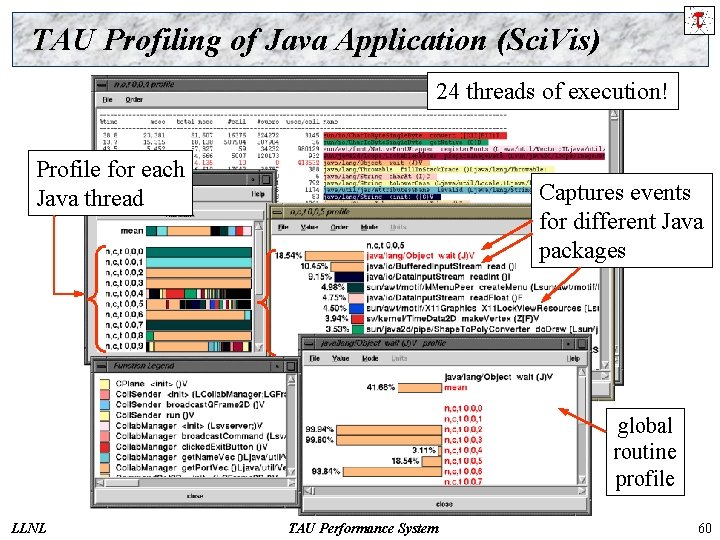
TAU Profiling of Java Application (Sci. Vis) 24 threads of execution! Profile for each Java thread Captures events for different Java packages global routine profile LLNL TAU Performance System 60

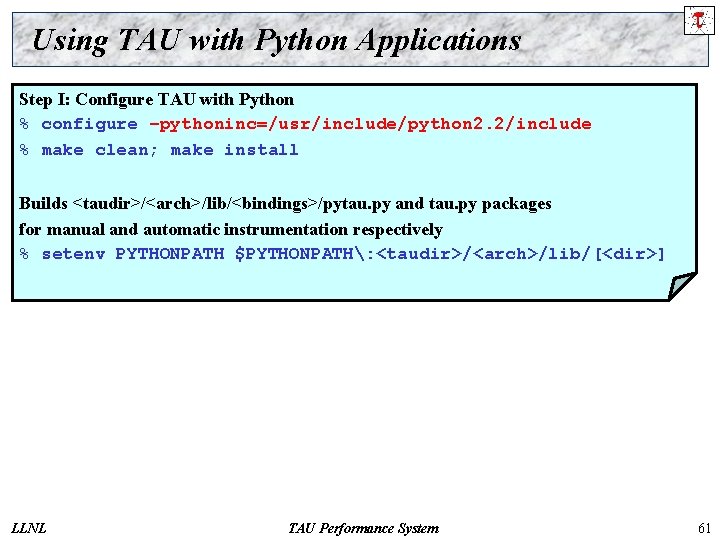
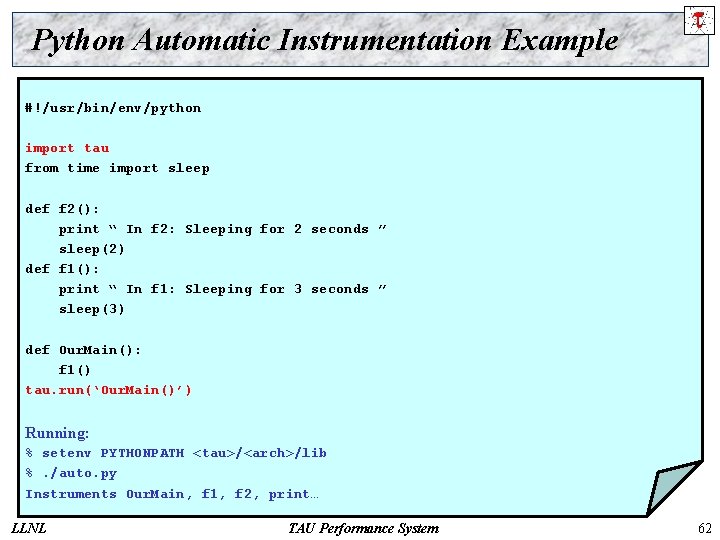
Using TAU with Python Applications Step I: Configure TAU with Python % configure –pythoninc=/usr/include/python 2. 2/include % make clean; make install Builds <taudir>/<arch>/lib/<bindings>/pytau. py and tau. py packages for manual and automatic instrumentation respectively % setenv PYTHONPATH $PYTHONPATH: <taudir>/<arch>/lib/[<dir>] LLNL TAU Performance System 61

Python Automatic Instrumentation Example #!/usr/bin/env/python import tau from time import sleep def f 2(): print “ In f 2: Sleeping for 2 seconds ” sleep(2) def f 1(): print “ In f 1: Sleeping for 3 seconds ” sleep(3) def Our. Main(): f 1() tau. run(‘Our. Main()’) Running: % setenv PYTHONPATH <tau>/<arch>/lib %. /auto. py Instruments Our. Main, f 1, f 2, print… LLNL TAU Performance System 62

Performance Mapping Associate performance with “significant” entities (events) r Source code points are important r ¦ Functions, regions, control flow events, user events Execution process and thread entities are important r Some entities are more abstract, harder to measure r LLNL TAU Performance System 63

TAU: An Overview Instrumentation r Measurement r Analysis r LLNL TAU Performance System 64

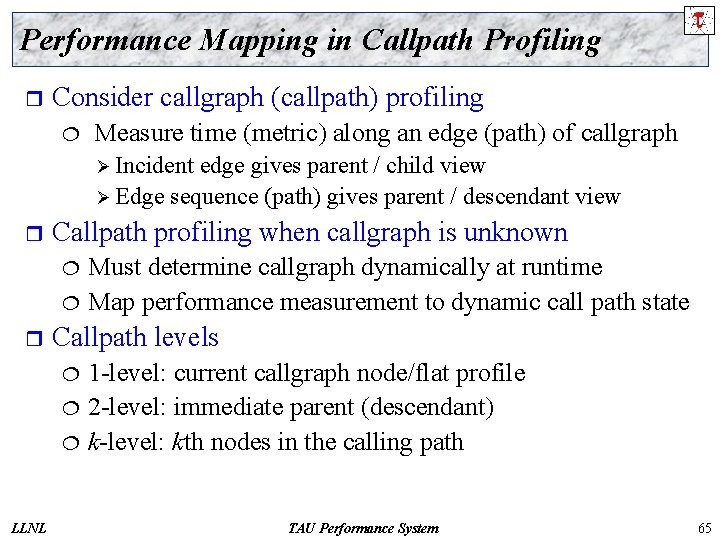
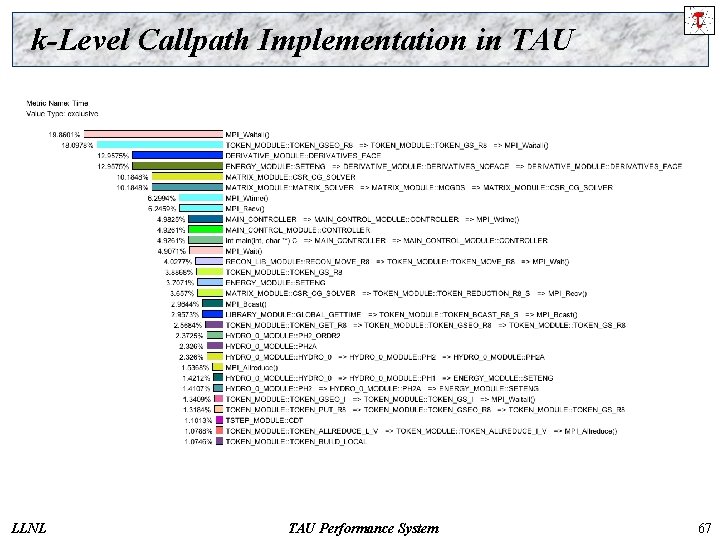
Performance Mapping in Callpath Profiling r Consider callgraph (callpath) profiling ¦ Measure time (metric) along an edge (path) of callgraph Ø Incident edge gives parent / child view Ø Edge sequence (path) gives parent / descendant view r Callpath profiling when callgraph is unknown Must determine callgraph dynamically at runtime ¦ Map performance measurement to dynamic call path state ¦ r Callpath levels 1 -level: current callgraph node/flat profile ¦ 2 -level: immediate parent (descendant) ¦ k-level: kth nodes in the calling path ¦ LLNL TAU Performance System 65

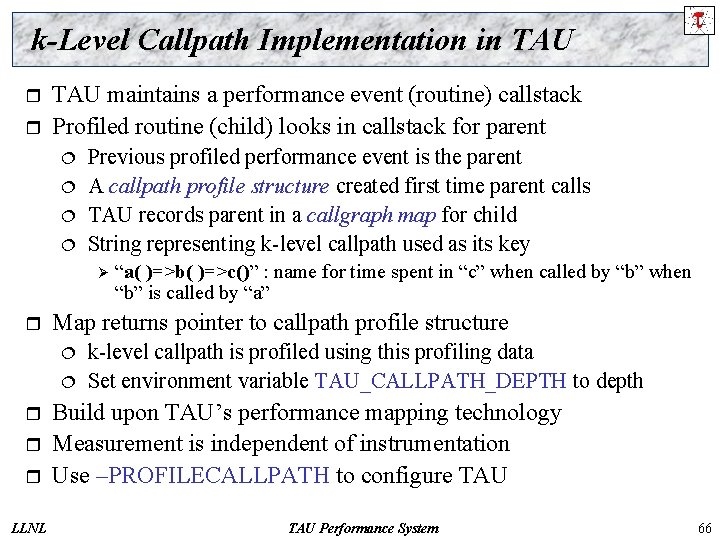
k-Level Callpath Implementation in TAU r r TAU maintains a performance event (routine) callstack Profiled routine (child) looks in callstack for parent ¦ ¦ Previous profiled performance event is the parent A callpath profile structure created first time parent calls TAU records parent in a callgraph map for child String representing k-level callpath used as its key Ø r Map returns pointer to callpath profile structure ¦ ¦ r r r LLNL “a( )=>b( )=>c()” : name for time spent in “c” when called by “b” when “b” is called by “a” k-level callpath is profiled using this profiling data Set environment variable TAU_CALLPATH_DEPTH to depth Build upon TAU’s performance mapping technology Measurement is independent of instrumentation Use –PROFILECALLPATH to configure TAU Performance System 66

k-Level Callpath Implementation in TAU LLNL TAU Performance System 67

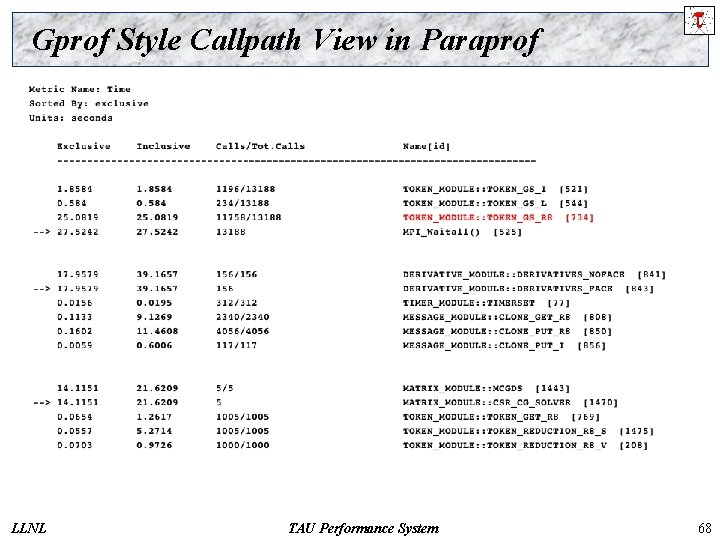
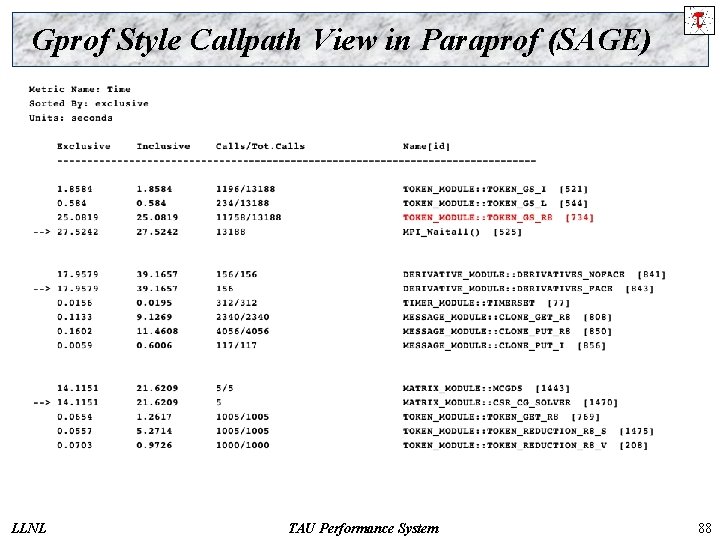
Gprof Style Callpath View in Paraprof LLNL TAU Performance System 68

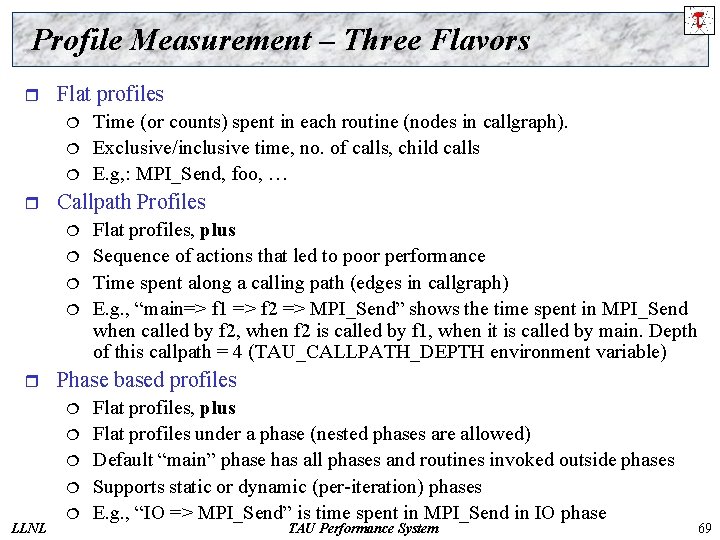
Profile Measurement – Three Flavors r Flat profiles ¦ ¦ ¦ r Callpath Profiles ¦ ¦ r Flat profiles, plus Sequence of actions that led to poor performance Time spent along a calling path (edges in callgraph) E. g. , “main=> f 1 => f 2 => MPI_Send” shows the time spent in MPI_Send when called by f 2, when f 2 is called by f 1, when it is called by main. Depth of this callpath = 4 (TAU_CALLPATH_DEPTH environment variable) Phase based profiles ¦ ¦ LLNL Time (or counts) spent in each routine (nodes in callgraph). Exclusive/inclusive time, no. of calls, child calls E. g, : MPI_Send, foo, … ¦ Flat profiles, plus Flat profiles under a phase (nested phases are allowed) Default “main” phase has all phases and routines invoked outside phases Supports static or dynamic (per-iteration) phases E. g. , “IO => MPI_Send” is time spent in MPI_Send in IO phase TAU Performance System 69

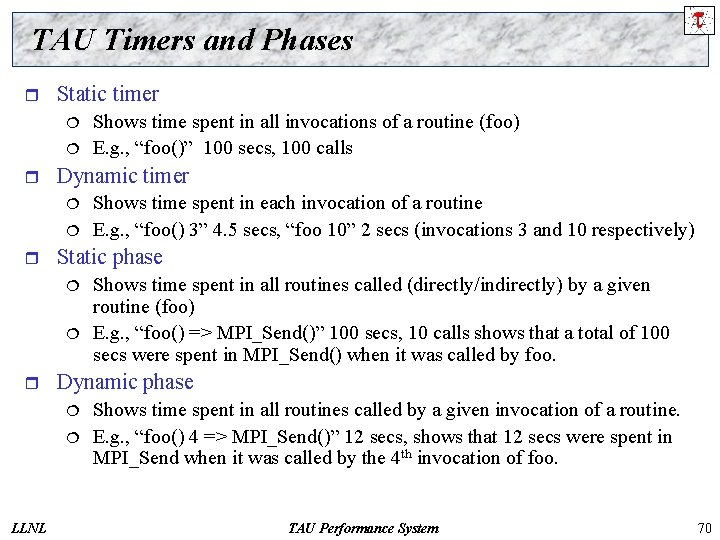
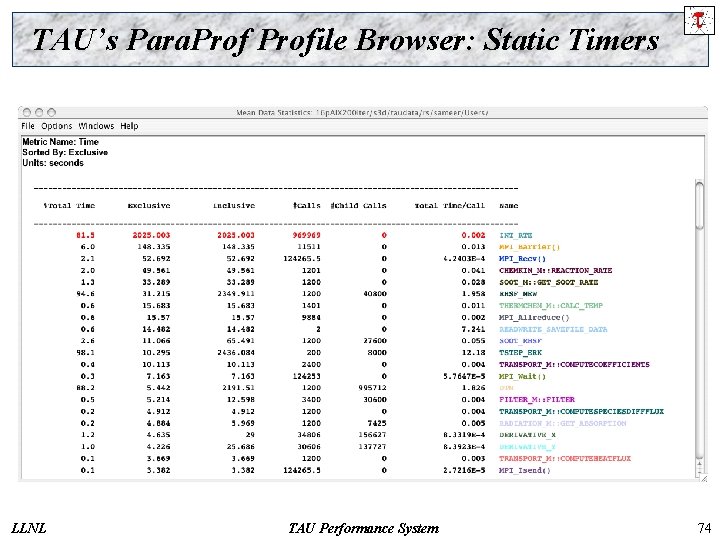
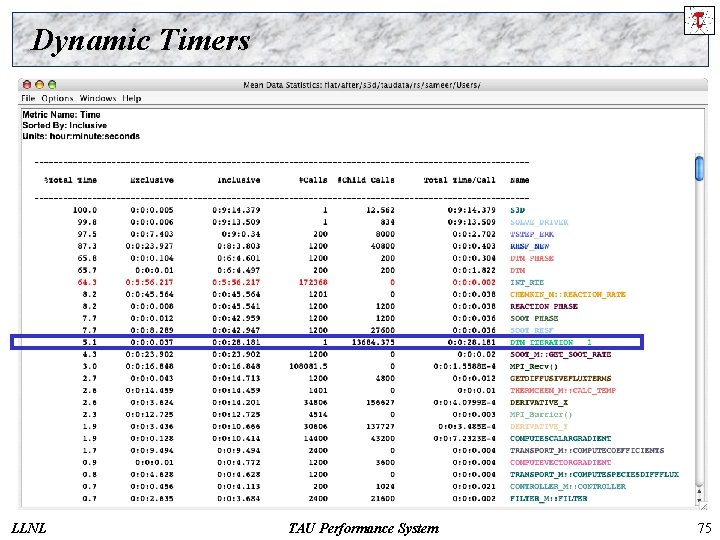
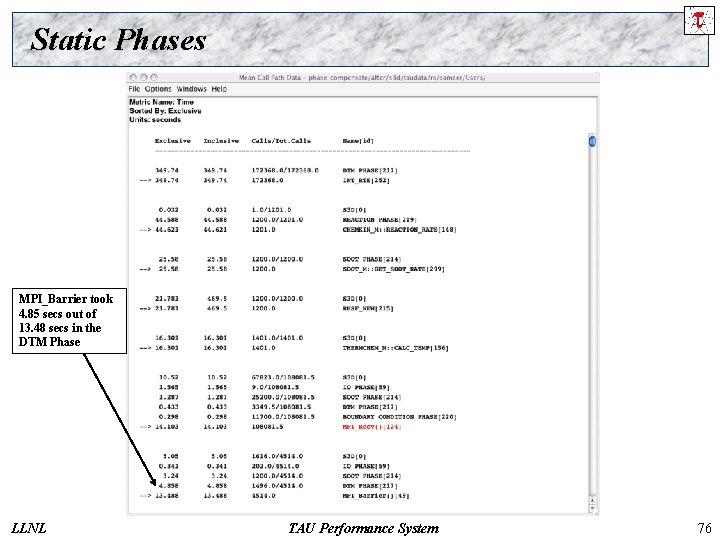
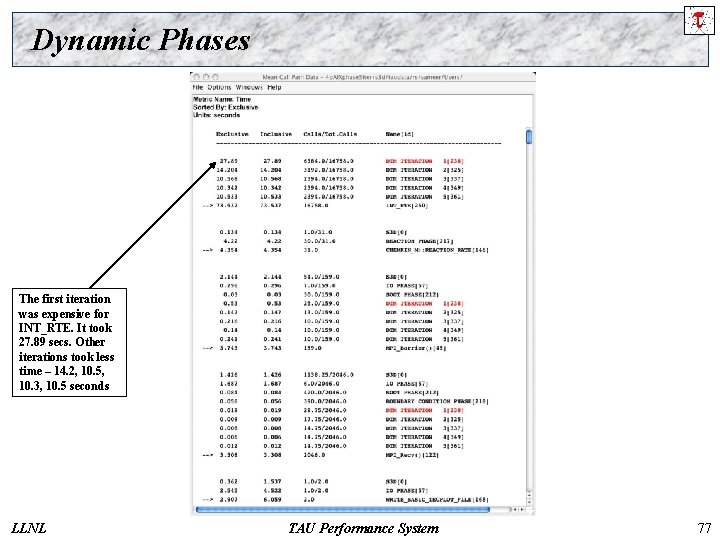
TAU Timers and Phases r Static timer ¦ ¦ r Dynamic timer ¦ ¦ r ¦ Shows time spent in all routines called (directly/indirectly) by a given routine (foo) E. g. , “foo() => MPI_Send()” 100 secs, 10 calls shows that a total of 100 secs were spent in MPI_Send() when it was called by foo. Dynamic phase ¦ ¦ LLNL Shows time spent in each invocation of a routine E. g. , “foo() 3” 4. 5 secs, “foo 10” 2 secs (invocations 3 and 10 respectively) Static phase ¦ r Shows time spent in all invocations of a routine (foo) E. g. , “foo()” 100 secs, 100 calls Shows time spent in all routines called by a given invocation of a routine. E. g. , “foo() 4 => MPI_Send()” 12 secs, shows that 12 secs were spent in MPI_Send when it was called by the 4 th invocation of foo. TAU Performance System 70

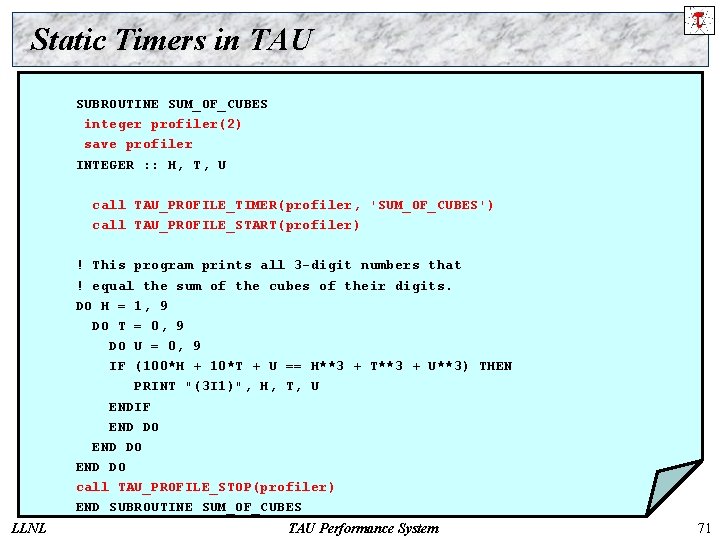
Static Timers in TAU SUBROUTINE SUM_OF_CUBES integer profiler(2) save profiler INTEGER : : H, T, U call TAU_PROFILE_TIMER(profiler, 'SUM_OF_CUBES') call TAU_PROFILE_START(profiler) ! This program prints all 3 -digit numbers that ! equal the sum of the cubes of their digits. DO H = 1, 9 DO T = 0, 9 DO U = 0, 9 IF (100*H + 10*T + U == H**3 + T**3 + U**3) THEN PRINT "(3 I 1)", H, T, U ENDIF END DO call TAU_PROFILE_STOP(profiler) END SUBROUTINE SUM_OF_CUBES LLNL TAU Performance System 71

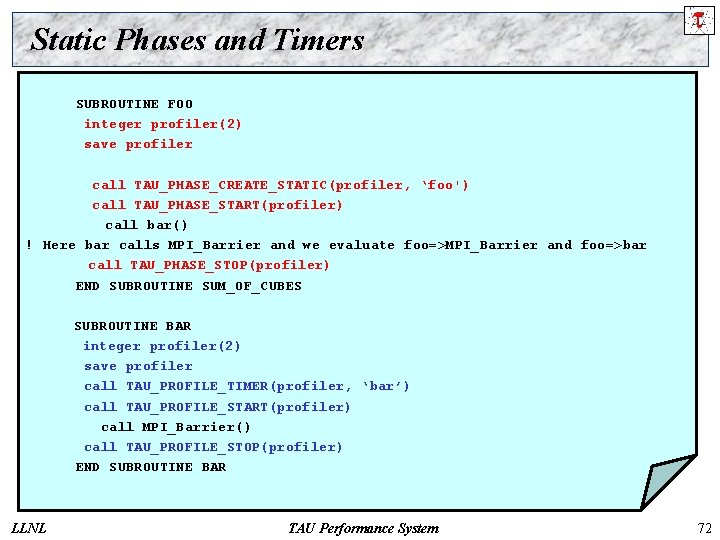
Static Phases and Timers SUBROUTINE FOO integer profiler(2) save profiler call TAU_PHASE_CREATE_STATIC(profiler, ‘foo') call TAU_PHASE_START(profiler) call bar() ! Here bar calls MPI_Barrier and we evaluate foo=>MPI_Barrier and foo=>bar call TAU_PHASE_STOP(profiler) END SUBROUTINE SUM_OF_CUBES SUBROUTINE BAR integer profiler(2) save profiler call TAU_PROFILE_TIMER(profiler, ‘bar’) call TAU_PROFILE_START(profiler) call MPI_Barrier() call TAU_PROFILE_STOP(profiler) END SUBROUTINE BAR LLNL TAU Performance System 72

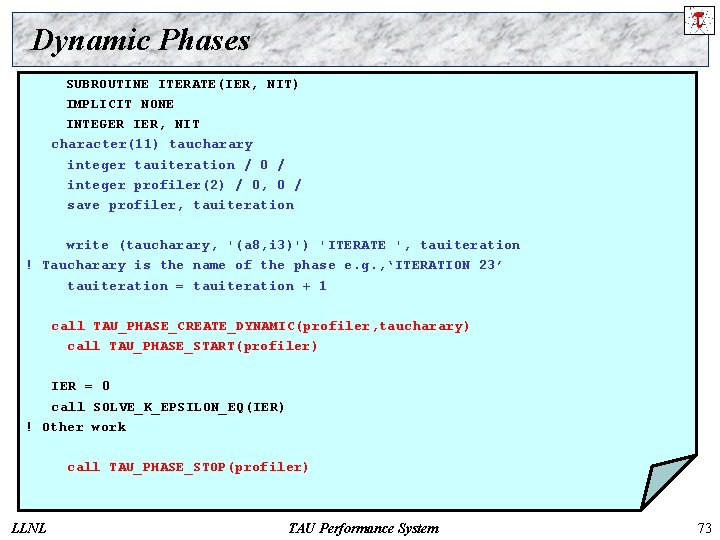
Dynamic Phases SUBROUTINE ITERATE(IER, NIT) IMPLICIT NONE INTEGER IER, NIT character(11) taucharary integer tauiteration / 0 / integer profiler(2) / 0, 0 / save profiler, tauiteration write (taucharary, '(a 8, i 3)') 'ITERATE ', tauiteration ! Taucharary is the name of the phase e. g. , ‘ITERATION 23’ tauiteration = tauiteration + 1 call TAU_PHASE_CREATE_DYNAMIC(profiler, taucharary) call TAU_PHASE_START(profiler) IER = 0 call SOLVE_K_EPSILON_EQ(IER) ! Other work call TAU_PHASE_STOP(profiler) LLNL TAU Performance System 73

TAU’s Para. Profile Browser: Static Timers LLNL TAU Performance System 74

Dynamic Timers LLNL TAU Performance System 75

Static Phases MPI_Barrier took 4. 85 secs out of 13. 48 secs in the DTM Phase LLNL TAU Performance System 76

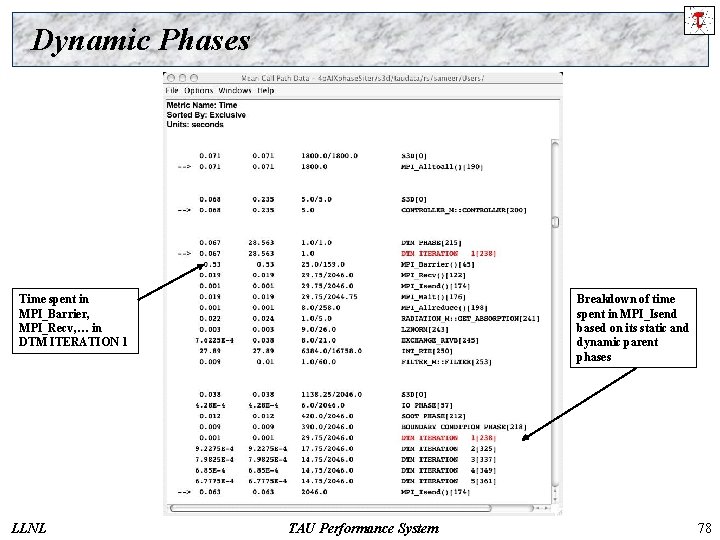
Dynamic Phases The first iteration was expensive for INT_RTE. It took 27. 89 secs. Other iterations took less time – 14. 2, 10. 5, 10. 3, 10. 5 seconds LLNL TAU Performance System 77

Dynamic Phases Time spent in MPI_Barrier, MPI_Recv, … in DTM ITERATION 1 LLNL Breakdown of time spent in MPI_Isend based on its static and dynamic parent phases TAU Performance System 78

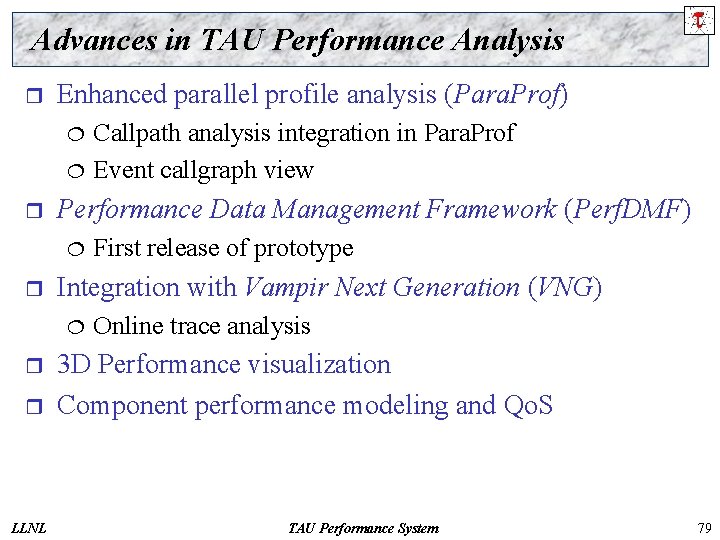
Advances in TAU Performance Analysis r Enhanced parallel profile analysis (Para. Prof) ¦ ¦ r Performance Data Management Framework (Perf. DMF) ¦ r r LLNL First release of prototype Integration with Vampir Next Generation (VNG) ¦ r Callpath analysis integration in Para. Prof Event callgraph view Online trace analysis 3 D Performance visualization Component performance modeling and Qo. S TAU Performance System 79

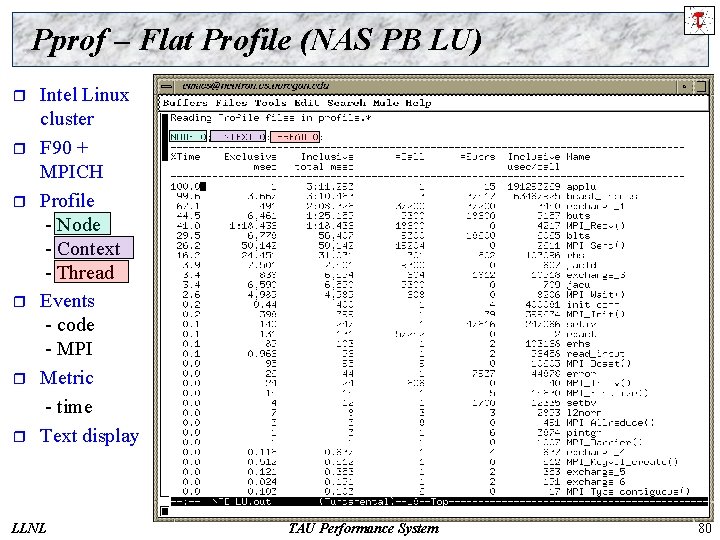
Pprof – Flat Profile (NAS PB LU) r r r Intel Linux cluster F 90 + MPICH Profile - Node - Context - Thread Events - code - MPI Metric - time Text display LLNL TAU Performance System 80

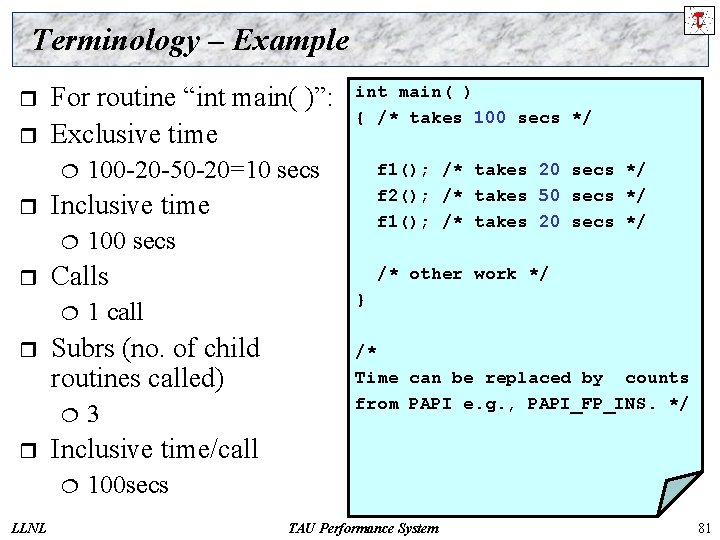
Terminology – Example r r For routine “int main( )”: Exclusive time ¦ r 3 /* other work */ } /* Time can be replaced by counts from PAPI e. g. , PAPI_FP_INS. */ Inclusive time/call ¦ LLNL 1 call Subrs (no. of child routines called) ¦ r f 1(); /* takes 20 secs */ f 2(); /* takes 50 secs */ f 1(); /* takes 20 secs */ 100 secs Calls ¦ r 100 -20 -50 -20=10 secs Inclusive time ¦ r int main( ) { /* takes 100 secs */ 100 secs TAU Performance System 81

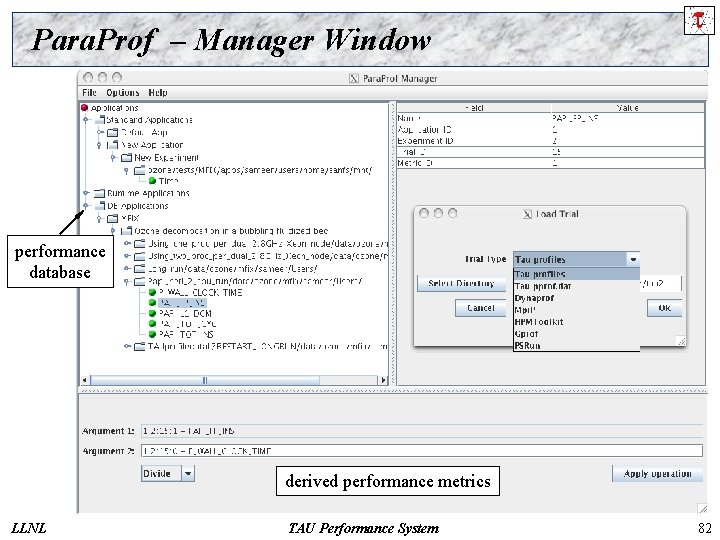
Para. Prof – Manager Window performance database derived performance metrics LLNL TAU Performance System 82

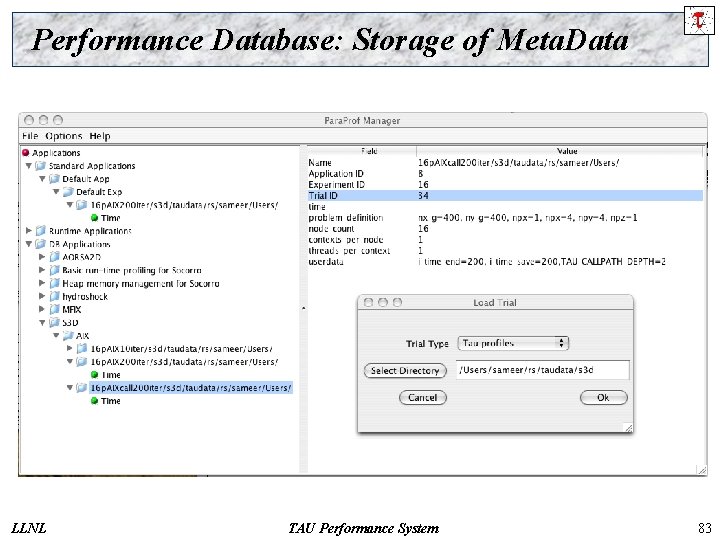
Performance Database: Storage of Meta. Data LLNL TAU Performance System 83

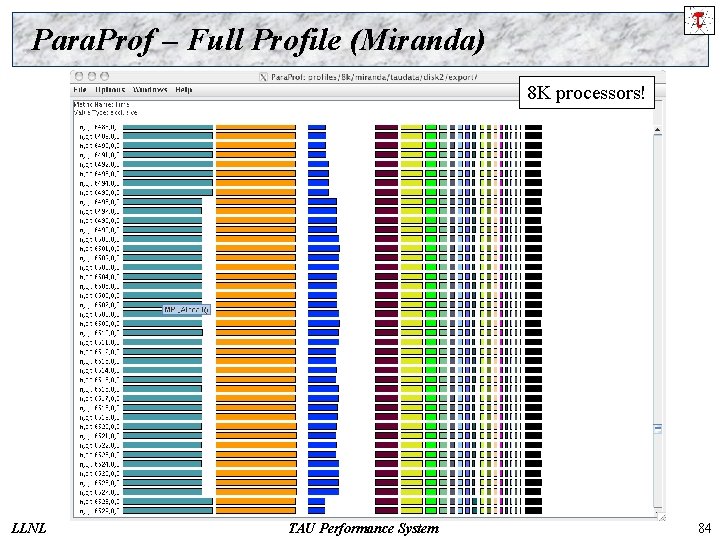
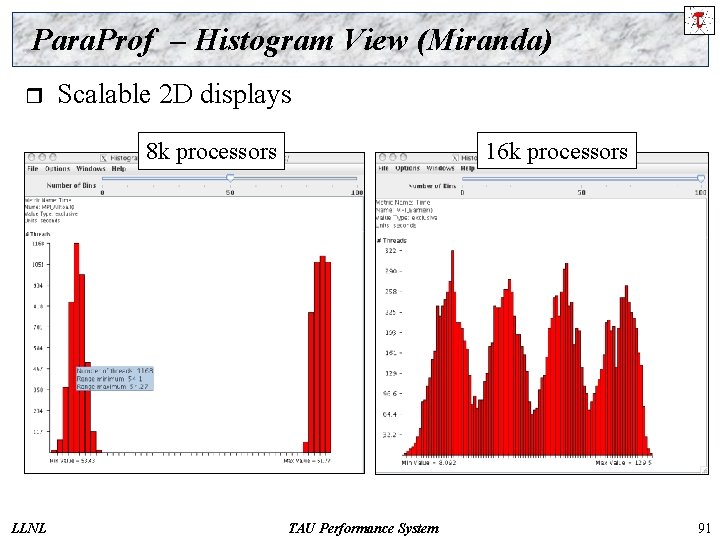
Para. Prof – Full Profile (Miranda) 8 K processors! LLNL TAU Performance System 84

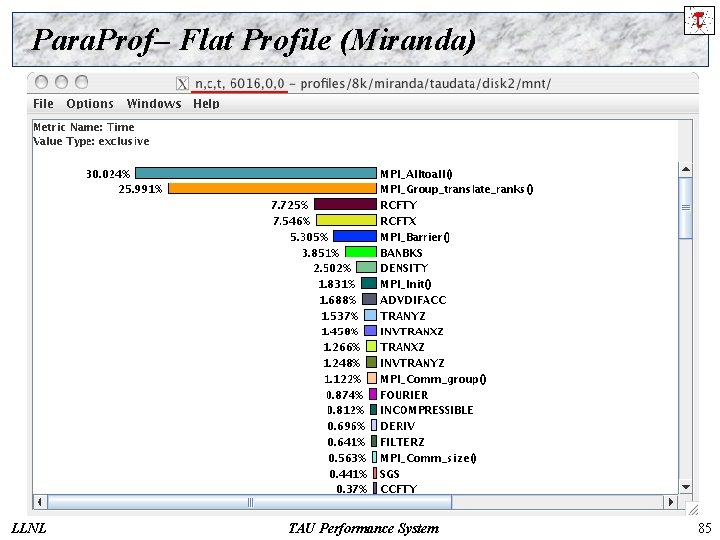
Para. Prof– Flat Profile (Miranda) LLNL TAU Performance System 85

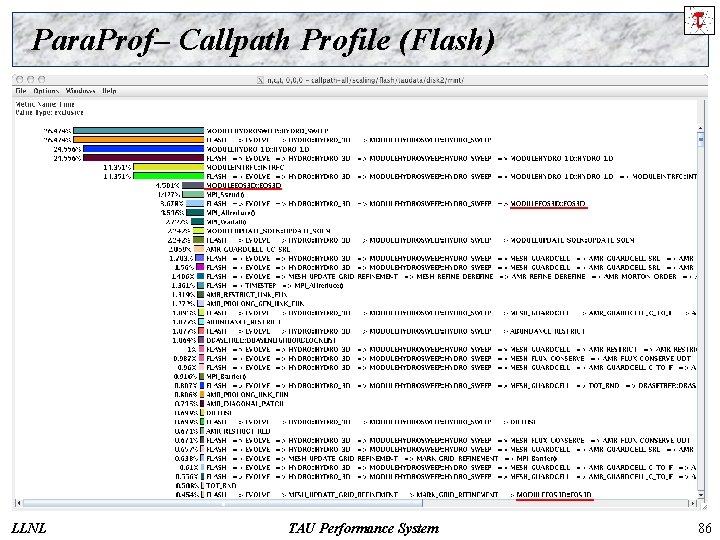
Para. Prof– Callpath Profile (Flash) LLNL TAU Performance System 86

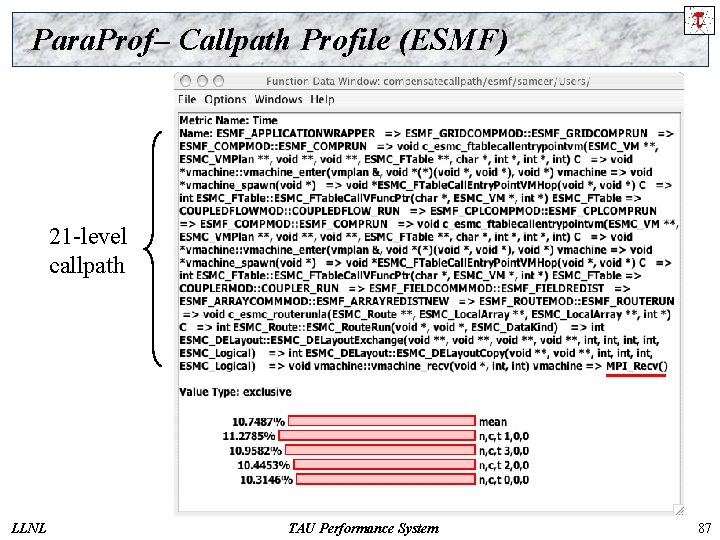
Para. Prof– Callpath Profile (ESMF) 21 -level callpath LLNL TAU Performance System 87

Gprof Style Callpath View in Paraprof (SAGE) LLNL TAU Performance System 88

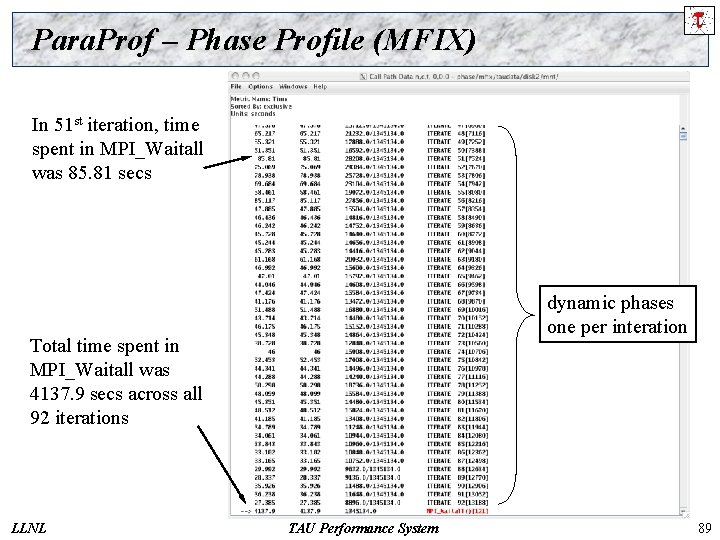
Para. Prof – Phase Profile (MFIX) In 51 st iteration, time spent in MPI_Waitall was 85. 81 secs dynamic phases one per interation Total time spent in MPI_Waitall was 4137. 9 secs across all 92 iterations LLNL TAU Performance System 89

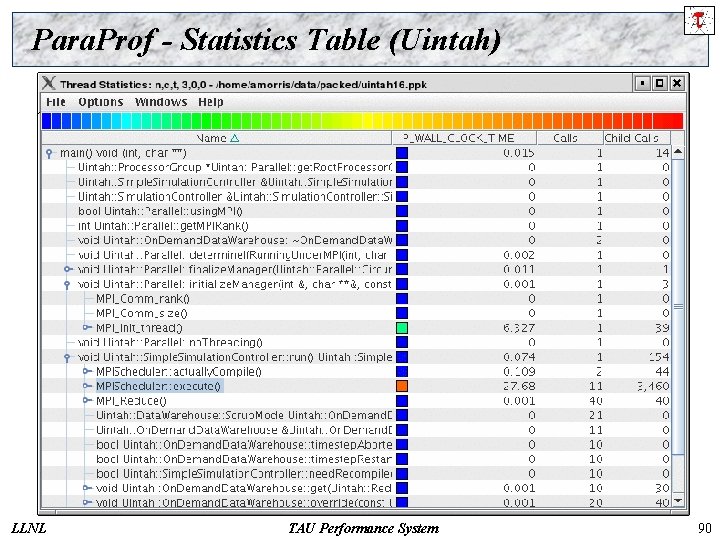
Para. Prof - Statistics Table (Uintah) LLNL TAU Performance System 90

Para. Prof – Histogram View (Miranda) r Scalable 2 D displays 16 k processors 8 k processors LLNL TAU Performance System 91

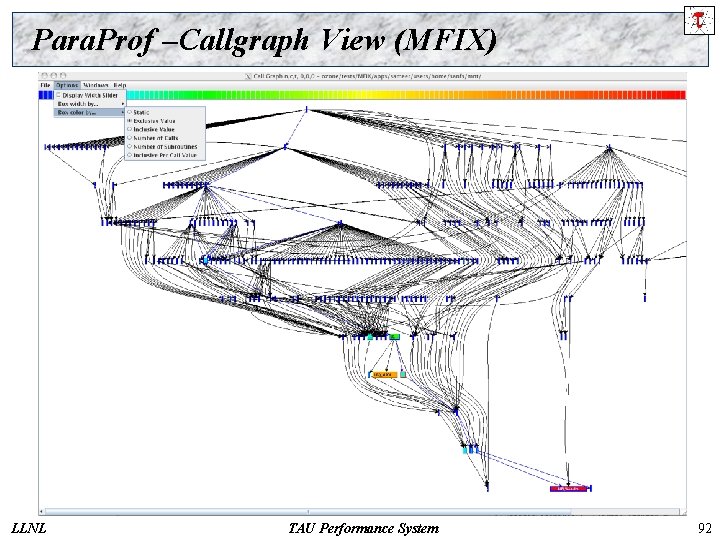
Para. Prof –Callgraph View (MFIX) LLNL TAU Performance System 92

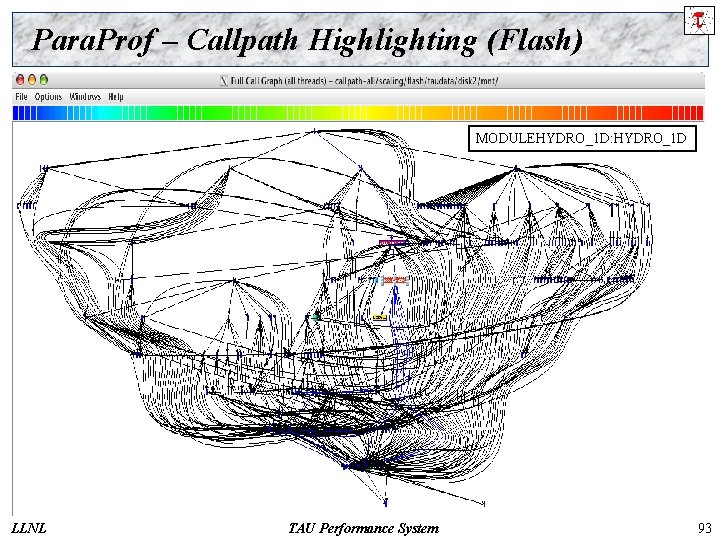
Para. Prof – Callpath Highlighting (Flash) MODULEHYDRO_1 D: HYDRO_1 D LLNL TAU Performance System 93

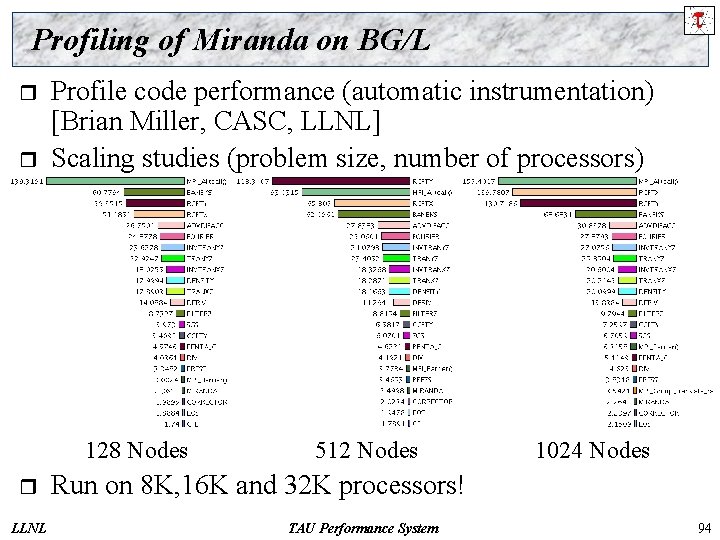
Profiling of Miranda on BG/L r r Profile code performance (automatic instrumentation) [Brian Miller, CASC, LLNL] Scaling studies (problem size, number of processors) 128 Nodes r LLNL 512 Nodes 1024 Nodes Run on 8 K, 16 K and 32 K processors! TAU Performance System 94

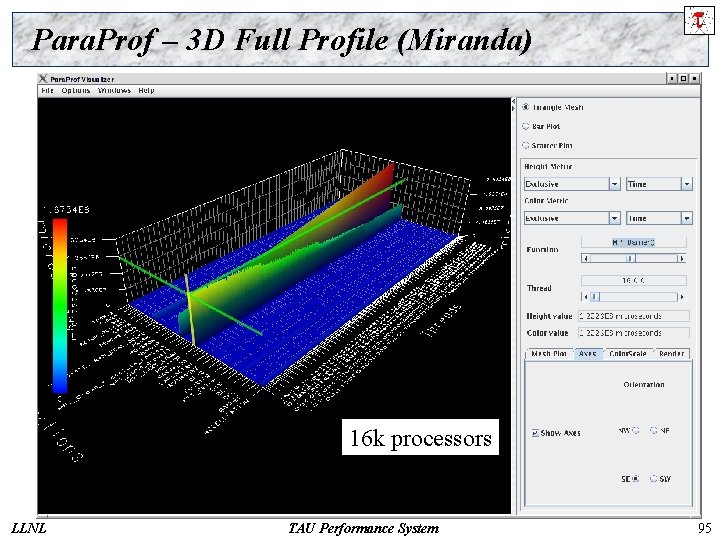
Para. Prof – 3 D Full Profile (Miranda) 16 k processors LLNL TAU Performance System 95

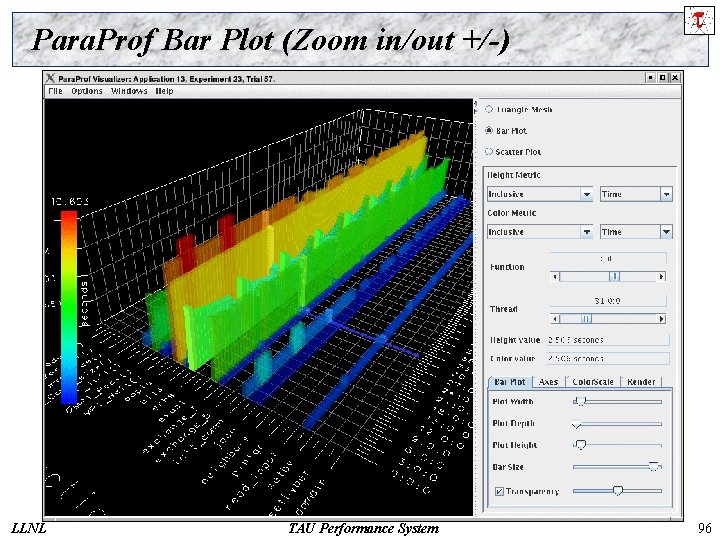
Para. Prof Bar Plot (Zoom in/out +/-) LLNL TAU Performance System 96

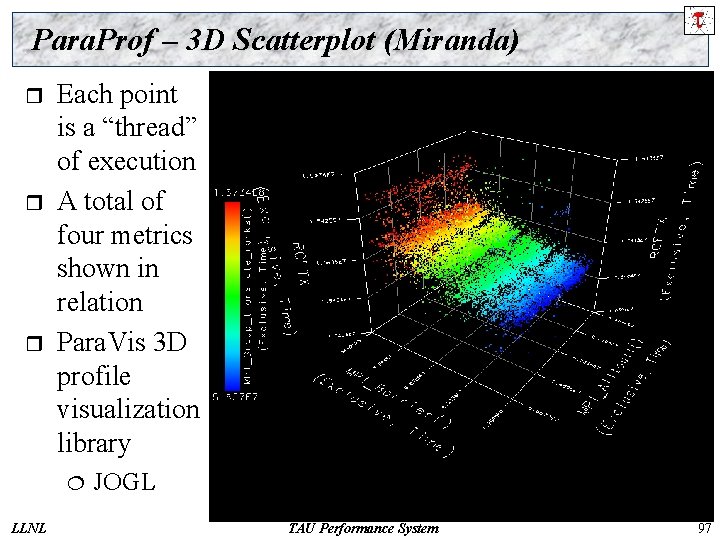
Para. Prof – 3 D Scatterplot (Miranda) r r r Each point is a “thread” of execution A total of four metrics shown in relation Para. Vis 3 D profile visualization library ¦ LLNL JOGL TAU Performance System 97

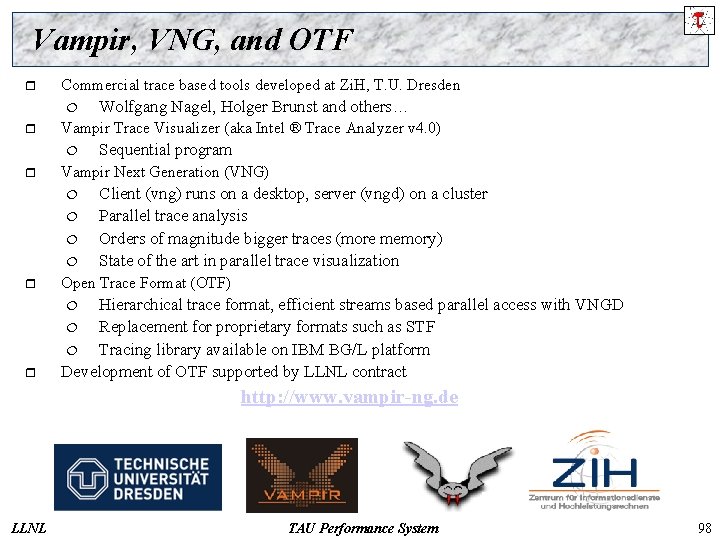
Vampir, VNG, and OTF r Commercial trace based tools developed at Zi. H, T. U. Dresden ¦ r Vampir Trace Visualizer (aka Intel ® Trace Analyzer v 4. 0) ¦ r Wolfgang Nagel, Holger Brunst and others… Sequential program Vampir Next Generation (VNG) ¦ ¦ Client (vng) runs on a desktop, server (vngd) on a cluster Parallel trace analysis Orders of magnitude bigger traces (more memory) State of the art in parallel trace visualization r Open Trace Format (OTF) r Hierarchical trace format, efficient streams based parallel access with VNGD ¦ Replacement for proprietary formats such as STF ¦ Tracing library available on IBM BG/L platform Development of OTF supported by LLNL contract ¦ http: //www. vampir-ng. de LLNL TAU Performance System 98

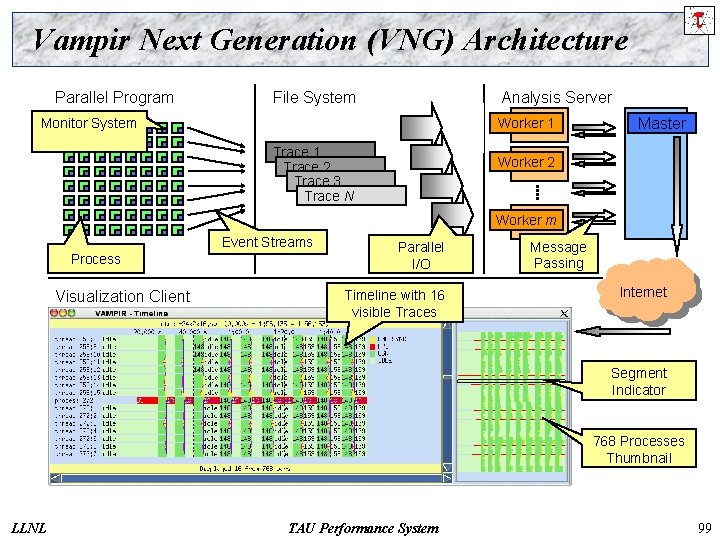
Vampir Next Generation (VNG) Architecture Parallel Program File System Monitor System Trace 1 Trace 2 Trace 3 Trace N Analysis Server Merged Traces Master Worker 1 Classic Analysis: Worker 2 § monolithic § sequential Worker m Event Streams Process Visualization Client Parallel I/O Timeline with 16 visible Traces Message Passing Internet Segment Indicator 768 Processes Thumbnail LLNL TAU Performance System 99

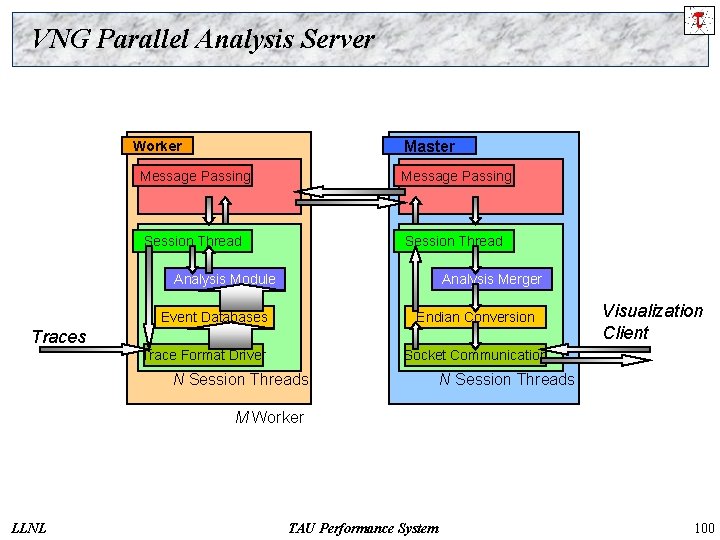
VNG Parallel Analysis Server Master Worker Message Passing Worker 1 Session Thread Worker 2 Master Session Thread Analysis Module Event Databases Analysis Merger Worker m Endian Conversion Traces Trace Format Driver Visualization Client Socket Communication N Session Threads M Worker LLNL TAU Performance System 100

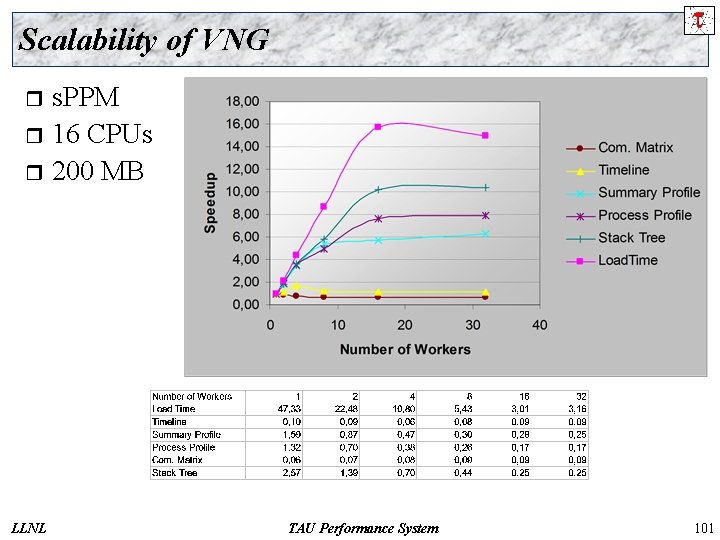
Scalability of VNG s. PPM r 16 CPUs r 200 MB r LLNL TAU Performance System 101

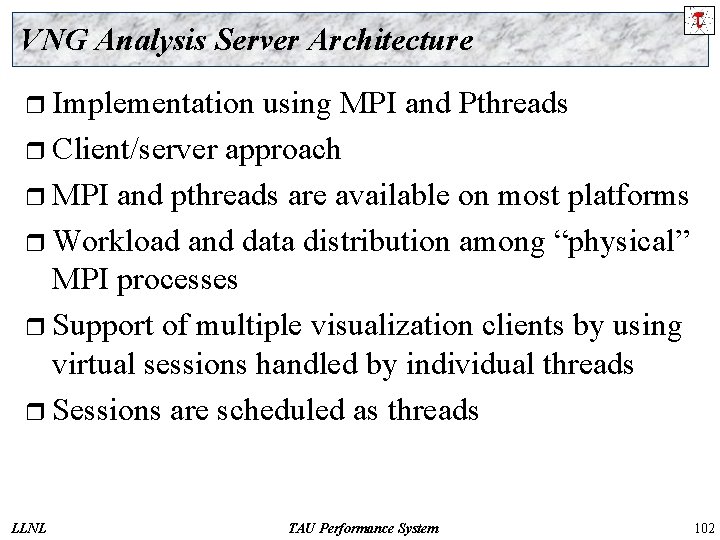
VNG Analysis Server Architecture r Implementation using MPI and Pthreads r Client/server approach r MPI and pthreads are available on most platforms r Workload and data distribution among “physical” MPI processes r Support of multiple visualization clients by using virtual sessions handled by individual threads r Sessions are scheduled as threads LLNL TAU Performance System 102

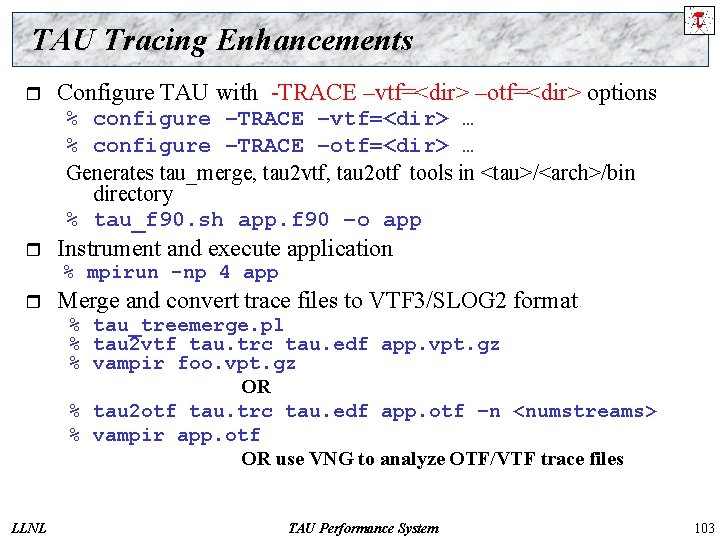
TAU Tracing Enhancements r Configure TAU with -TRACE –vtf=<dir> –otf=<dir> options % configure –TRACE –vtf=<dir> … % configure –TRACE –otf=<dir> … Generates tau_merge, tau 2 vtf, tau 2 otf tools in <tau>/<arch>/bin directory % tau_f 90. sh app. f 90 –o app r Instrument and execute application % mpirun -np 4 app r Merge and convert trace files to VTF 3/SLOG 2 format % tau_treemerge. pl % tau 2 vtf tau. trc tau. edf app. vpt. gz % vampir foo. vpt. gz OR % tau 2 otf tau. trc tau. edf app. otf –n <numstreams> % vampir app. otf OR use VNG to analyze OTF/VTF trace files LLNL TAU Performance System 103

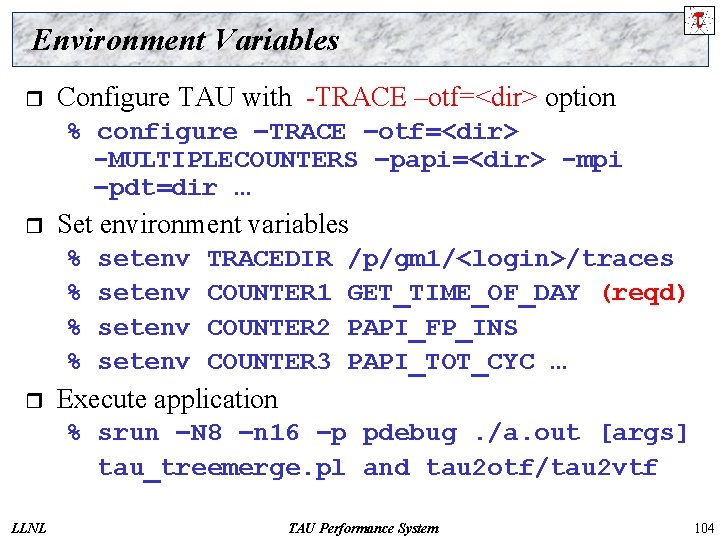
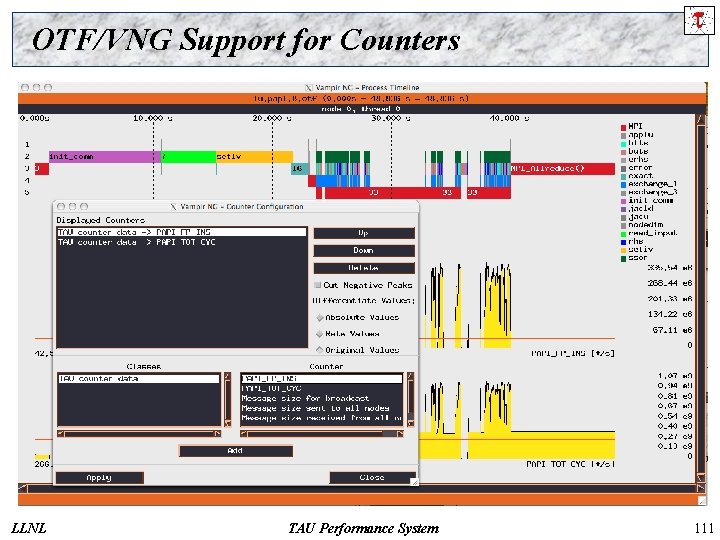
Environment Variables r Configure TAU with -TRACE –otf=<dir> option % configure –TRACE –otf=<dir> -MULTIPLECOUNTERS –papi=<dir> -mpi –pdt=dir … r Set environment variables % % r setenv TRACEDIR COUNTER 1 COUNTER 2 COUNTER 3 /p/gm 1/<login>/traces GET_TIME_OF_DAY (reqd) PAPI_FP_INS PAPI_TOT_CYC … Execute application % srun –N 8 –n 16 –p pdebug. /a. out [args] tau_treemerge. pl and tau 2 otf/tau 2 vtf LLNL TAU Performance System 104

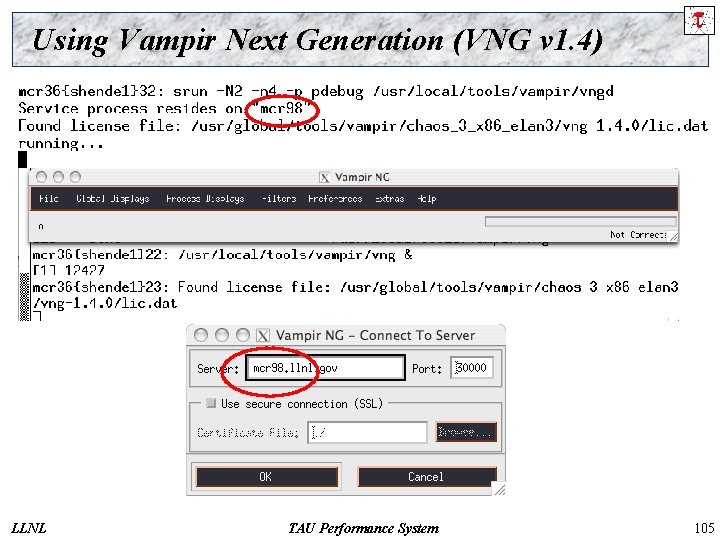
Using Vampir Next Generation (VNG v 1. 4) LLNL TAU Performance System 105

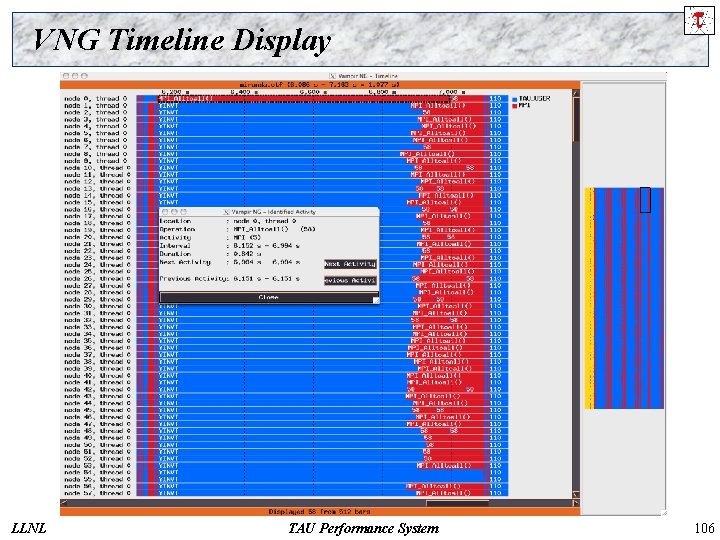
VNG Timeline Display LLNL TAU Performance System 106

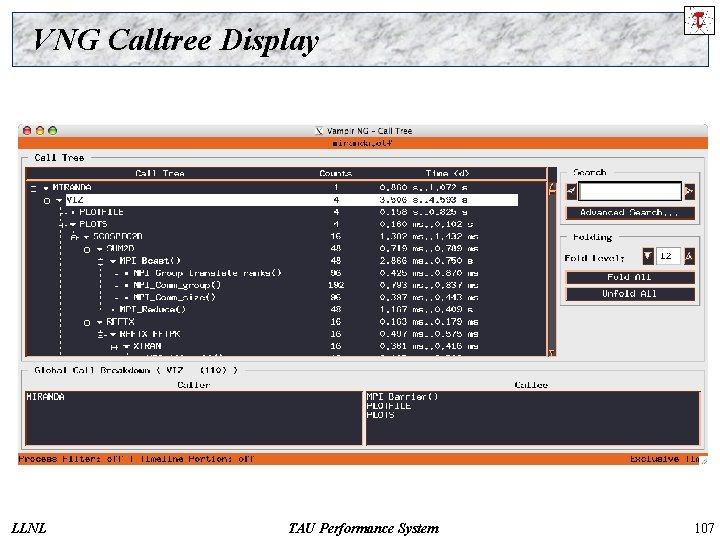
VNG Calltree Display LLNL TAU Performance System 107

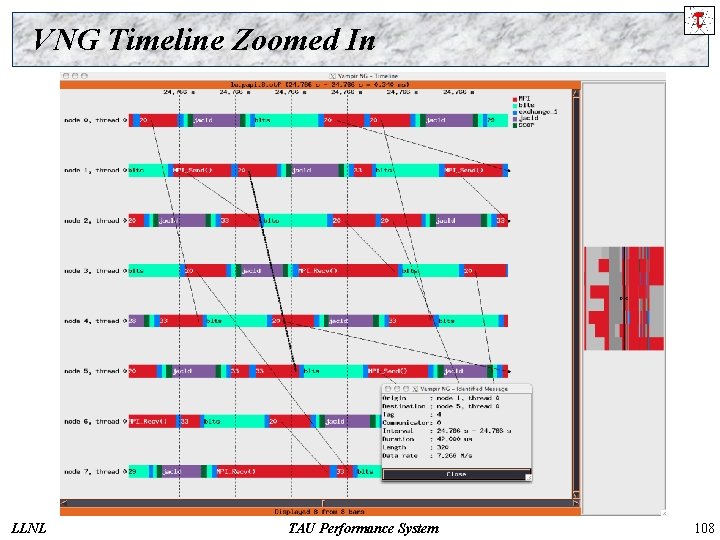
VNG Timeline Zoomed In LLNL TAU Performance System 108

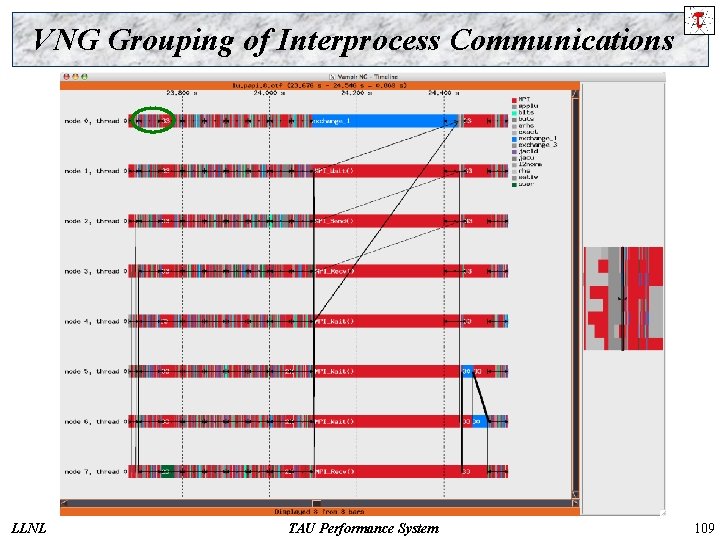
VNG Grouping of Interprocess Communications LLNL TAU Performance System 109

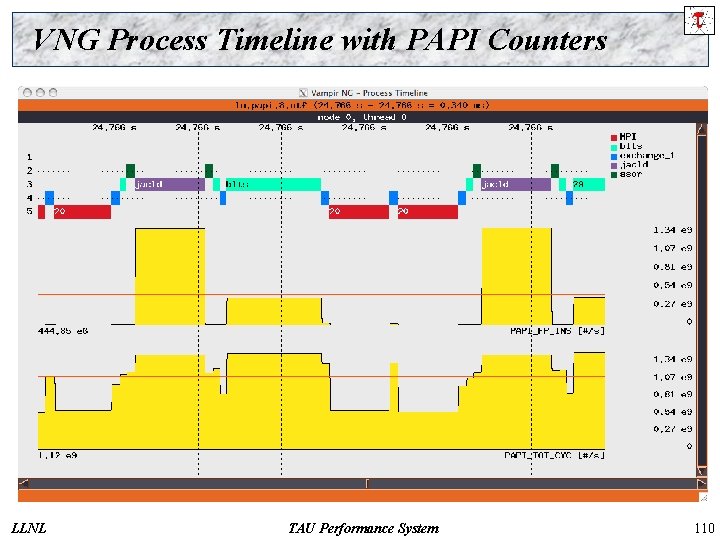
VNG Process Timeline with PAPI Counters LLNL TAU Performance System 110

OTF/VNG Support for Counters LLNL TAU Performance System 111

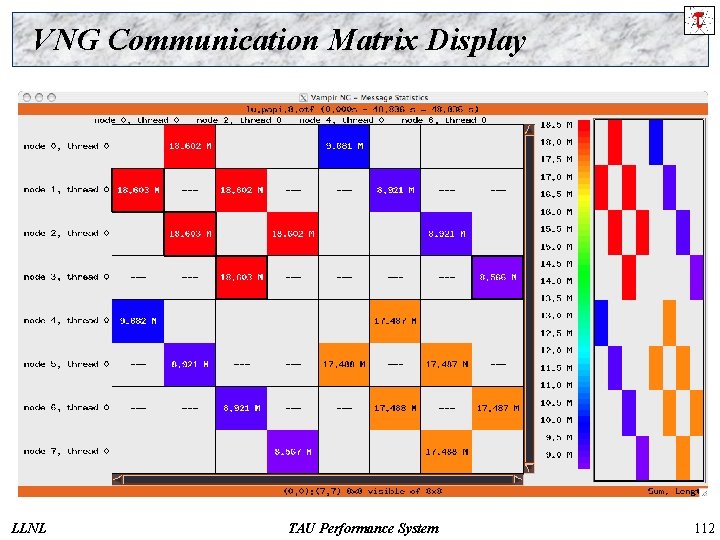
VNG Communication Matrix Display LLNL TAU Performance System 112

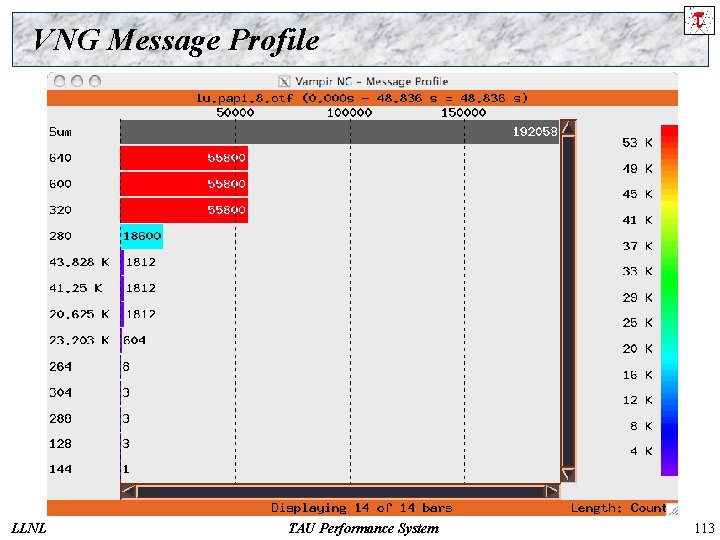
VNG Message Profile LLNL TAU Performance System 113

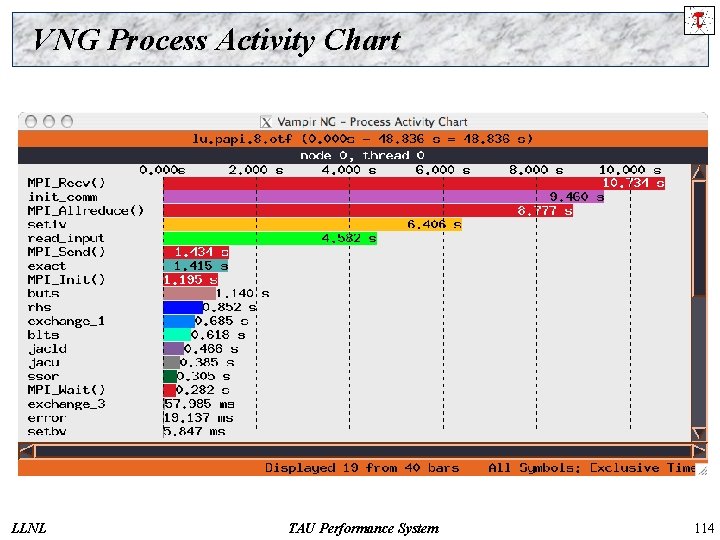
VNG Process Activity Chart LLNL TAU Performance System 114

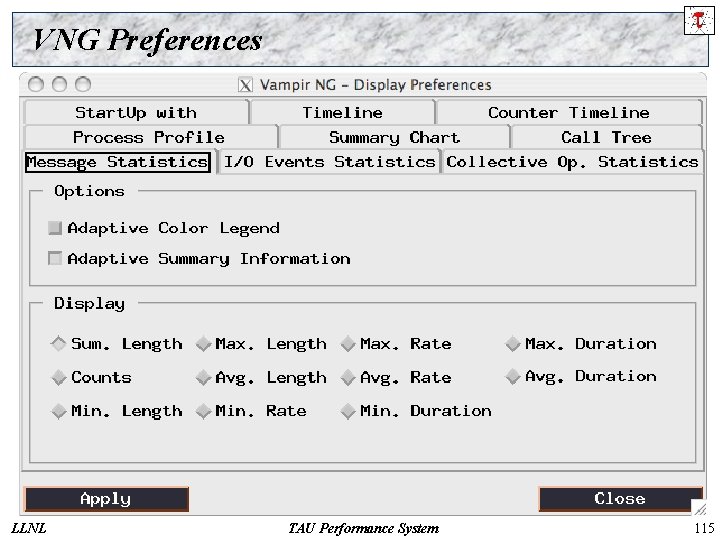
VNG Preferences LLNL TAU Performance System 115

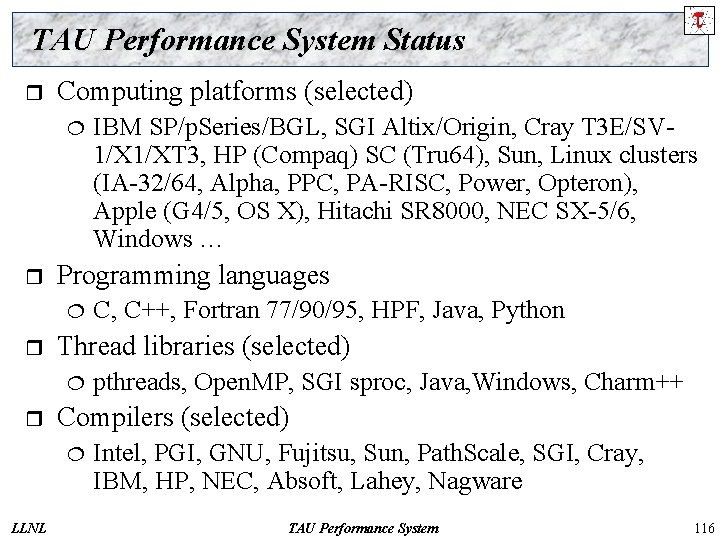
TAU Performance System Status r Computing platforms (selected) ¦ r Programming languages ¦ r pthreads, Open. MP, SGI sproc, Java, Windows, Charm++ Compilers (selected) ¦ LLNL C, C++, Fortran 77/90/95, HPF, Java, Python Thread libraries (selected) ¦ r IBM SP/p. Series/BGL, SGI Altix/Origin, Cray T 3 E/SV 1/XT 3, HP (Compaq) SC (Tru 64), Sun, Linux clusters (IA-32/64, Alpha, PPC, PA-RISC, Power, Opteron), Apple (G 4/5, OS X), Hitachi SR 8000, NEC SX-5/6, Windows … Intel, PGI, GNU, Fujitsu, Sun, Path. Scale, SGI, Cray, IBM, HP, NEC, Absoft, Lahey, Nagware TAU Performance System 116

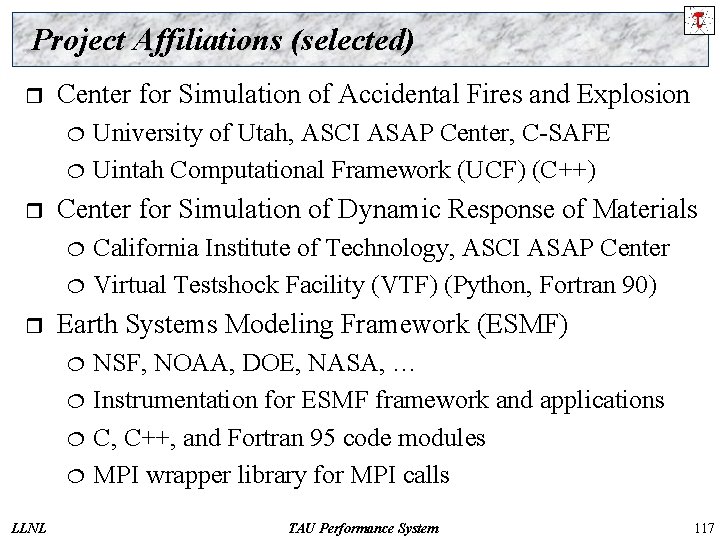
Project Affiliations (selected) r Center for Simulation of Accidental Fires and Explosion ¦ ¦ r Center for Simulation of Dynamic Response of Materials ¦ ¦ r California Institute of Technology, ASCI ASAP Center Virtual Testshock Facility (VTF) (Python, Fortran 90) Earth Systems Modeling Framework (ESMF) ¦ ¦ LLNL University of Utah, ASCI ASAP Center, C-SAFE Uintah Computational Framework (UCF) (C++) NSF, NOAA, DOE, NASA, … Instrumentation for ESMF framework and applications C, C++, and Fortran 95 code modules MPI wrapper library for MPI calls TAU Performance System 117

Project Affiliations (selected) (continued) r Lawrence Livermore National Laboratory ¦ r Sandia National Lab and Los Alamos National Lab ¦ ¦ r ¦ ¦ Jumpshot SLOG 2 SDK project Zepto. OS - scalable components for petascale architectures KTAU - integration of TAU infrastructure in Linux kernel Oak Ridge National Lab ¦ LLNL DOE CCTTSS Sci. DAC project Common component architecture (CCA) integration Argonne National Lab ¦ r Hydrodynamics (Miranda) Contribution to the Joule Report: S 3 D, AORSA 3 D TAU Performance System 118

Important Questions for Application Developers r r r r r LLNL How does performance vary with different compilers? Is poor performance correlated with certain OS features? Has a recent change caused unanticipated performance? How does performance vary with MPI variants? Why is one application version faster than another? What is the reason for the observed scaling behavior? Did two runs exhibit similar performance? How are performance data related to application events? Which machines will run my code the fastest and why? Which benchmarks predict my code performance best? TAU Performance System 119

Performance Problem Solving Goals r Answer questions at multiple levels of interest ¦ Data from low-level measurements and simulations Ø use ¦ to predict application performance High-level performance data spanning dimensions Ø machine, applications, code revisions, data sets Ø examine broad performance trends r r r LLNL Discover general correlations application performance and features of their external environment Develop methods to predict application performance on lower-level metrics Discover performance correlations between a small set of benchmarks and a collection of applications that represent a typical workload for a given system TAU Performance System 120

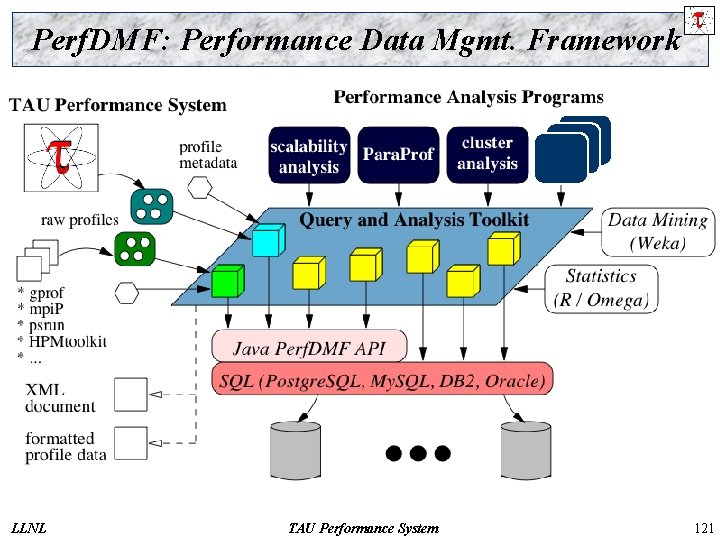
Perf. DMF: Performance Data Mgmt. Framework LLNL TAU Performance System 121

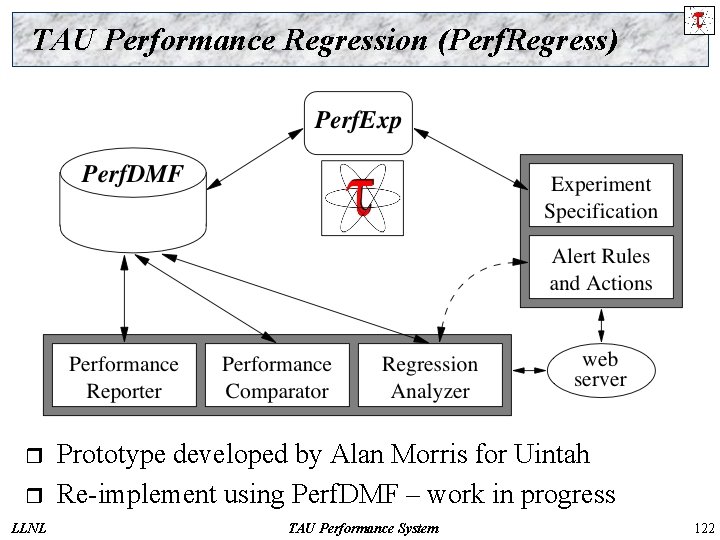
TAU Performance Regression (Perf. Regress) r r LLNL Prototype developed by Alan Morris for Uintah Re-implement using Perf. DMF – work in progress TAU Performance System 122

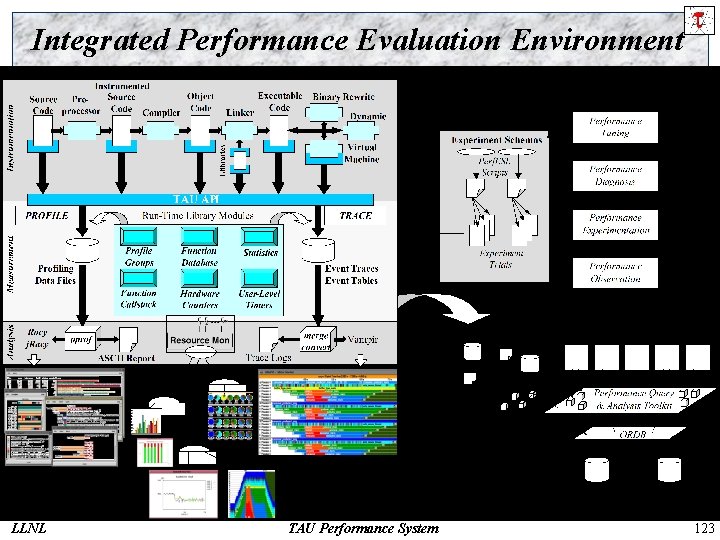
Integrated Performance Evaluation Environment LLNL TAU Performance System 123

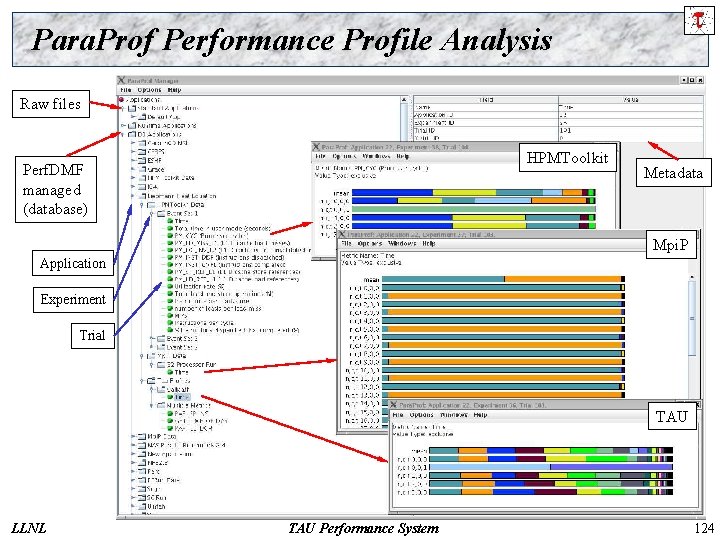
Para. Prof Performance Profile Analysis Raw files HPMToolkit Perf. DMF managed (database) Metadata Mpi. P Application Experiment Trial TAU LLNL TAU Performance System 124

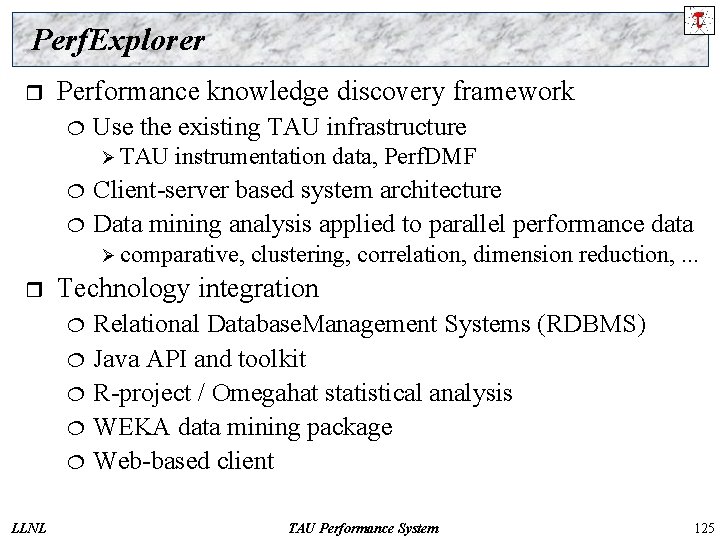
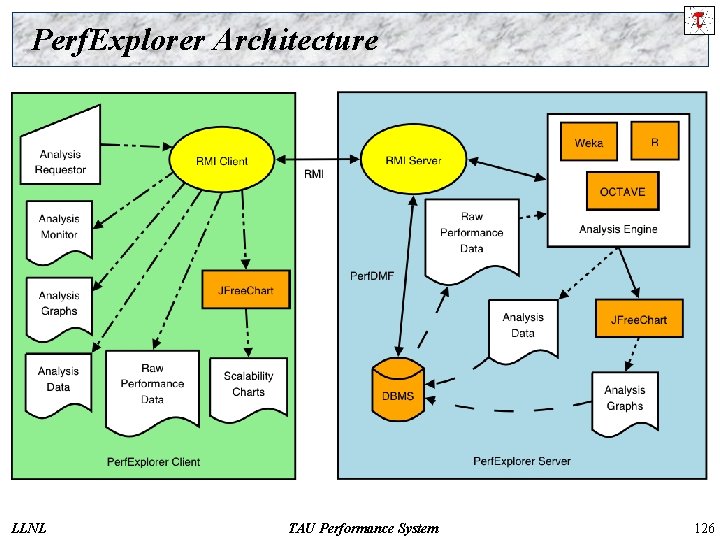
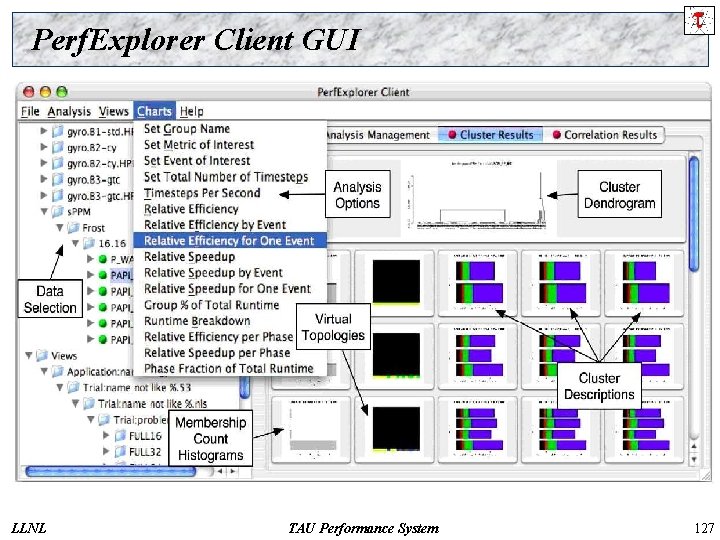
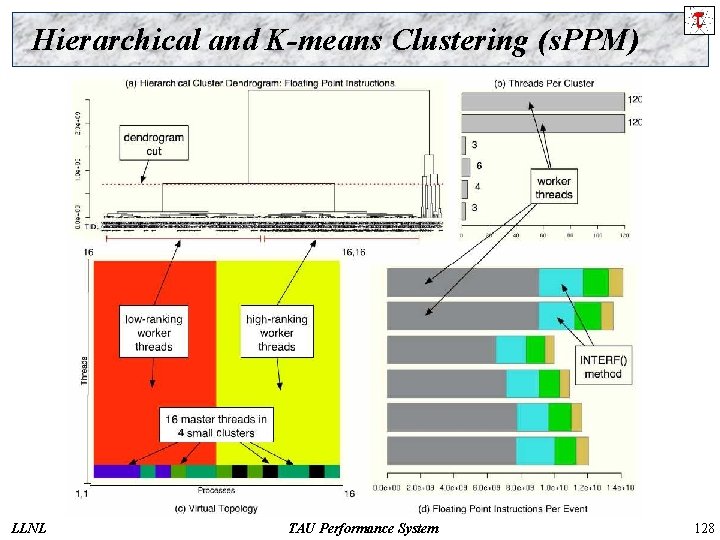
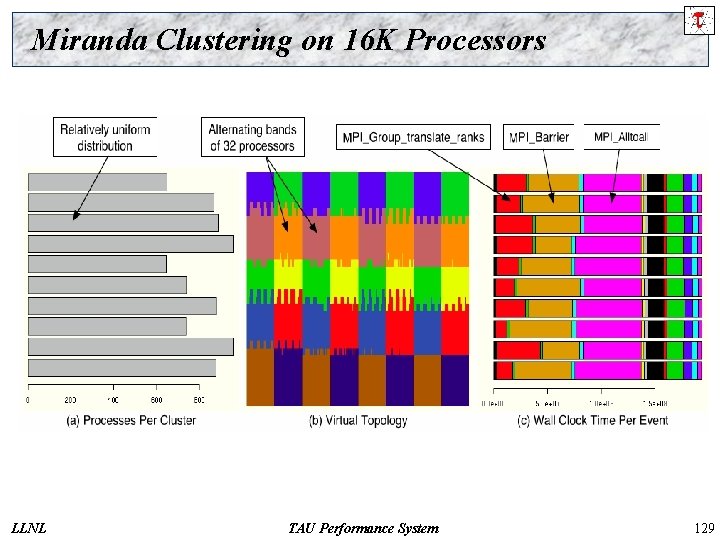
Perf. Explorer r Performance knowledge discovery framework ¦ Use the existing TAU infrastructure Ø TAU ¦ ¦ instrumentation data, Perf. DMF Client-server based system architecture Data mining analysis applied to parallel performance data Ø comparative, r Technology integration ¦ ¦ ¦ LLNL clustering, correlation, dimension reduction, . . . Relational Database. Management Systems (RDBMS) Java API and toolkit R-project / Omegahat statistical analysis WEKA data mining package Web-based client TAU Performance System 125

Perf. Explorer Architecture LLNL TAU Performance System 126

Perf. Explorer Client GUI LLNL TAU Performance System 127

Hierarchical and K-means Clustering (s. PPM) LLNL TAU Performance System 128

Miranda Clustering on 16 K Processors LLNL TAU Performance System 129

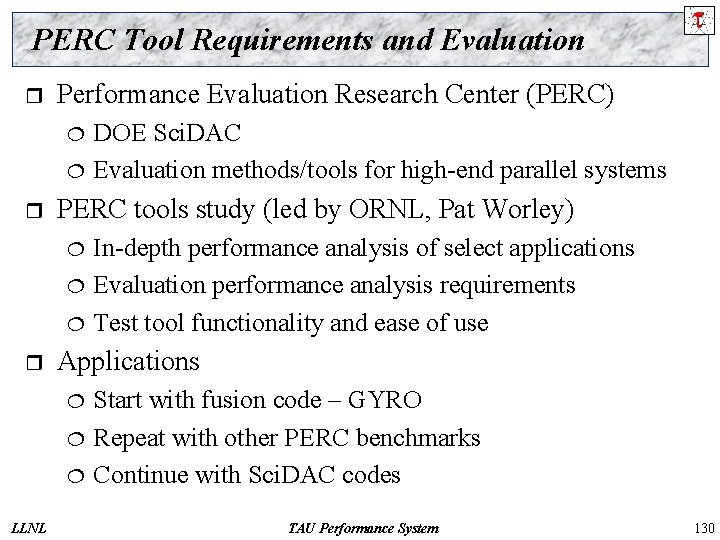
PERC Tool Requirements and Evaluation r Performance Evaluation Research Center (PERC) ¦ ¦ r PERC tools study (led by ORNL, Pat Worley) ¦ ¦ ¦ r In-depth performance analysis of select applications Evaluation performance analysis requirements Test tool functionality and ease of use Applications ¦ ¦ ¦ LLNL DOE Sci. DAC Evaluation methods/tools for high-end parallel systems Start with fusion code – GYRO Repeat with other PERC benchmarks Continue with Sci. DAC codes TAU Performance System 130

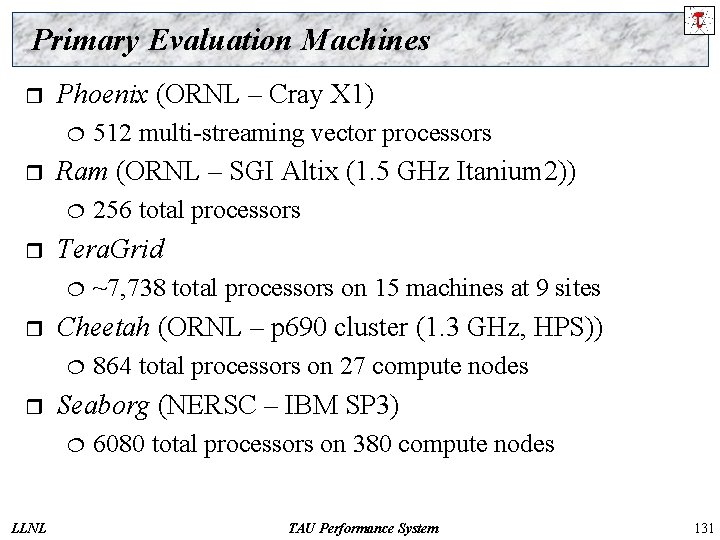
Primary Evaluation Machines r Phoenix (ORNL – Cray X 1) ¦ r Ram (ORNL – SGI Altix (1. 5 GHz Itanium 2)) ¦ r 864 total processors on 27 compute nodes Seaborg (NERSC – IBM SP 3) ¦ LLNL ~7, 738 total processors on 15 machines at 9 sites Cheetah (ORNL – p 690 cluster (1. 3 GHz, HPS)) ¦ r 256 total processors Tera. Grid ¦ r 512 multi-streaming vector processors 6080 total processors on 380 compute nodes TAU Performance System 131

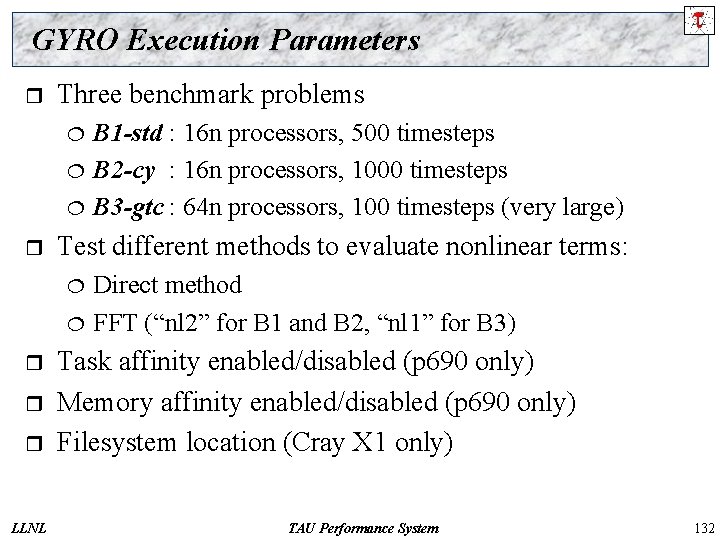
GYRO Execution Parameters r Three benchmark problems ¦ ¦ ¦ r Test different methods to evaluate nonlinear terms: ¦ ¦ r r r LLNL B 1 -std : 16 n processors, 500 timesteps B 2 -cy : 16 n processors, 1000 timesteps B 3 -gtc : 64 n processors, 100 timesteps (very large) Direct method FFT (“nl 2” for B 1 and B 2, “nl 1” for B 3) Task affinity enabled/disabled (p 690 only) Memory affinity enabled/disabled (p 690 only) Filesystem location (Cray X 1 only) TAU Performance System 132

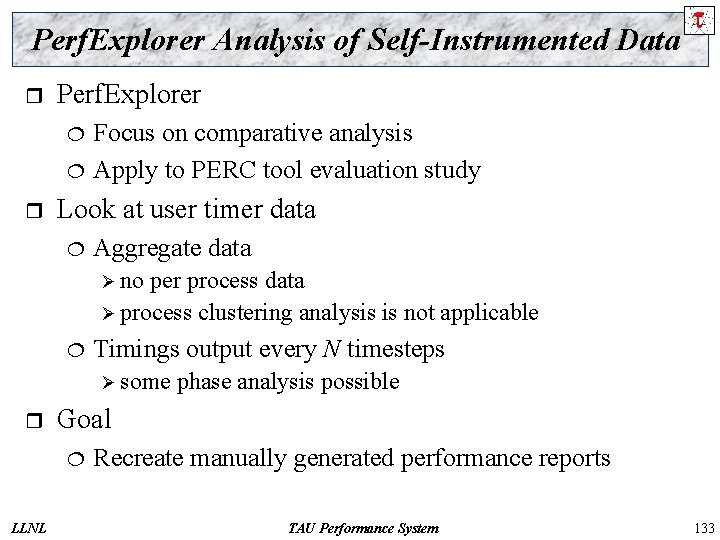
Perf. Explorer Analysis of Self-Instrumented Data r Perf. Explorer ¦ ¦ r Focus on comparative analysis Apply to PERC tool evaluation study Look at user timer data ¦ Aggregate data Ø no per process data Ø process clustering analysis is not applicable ¦ Timings output every N timesteps Ø some r Goal ¦ LLNL phase analysis possible Recreate manually generated performance reports TAU Performance System 133

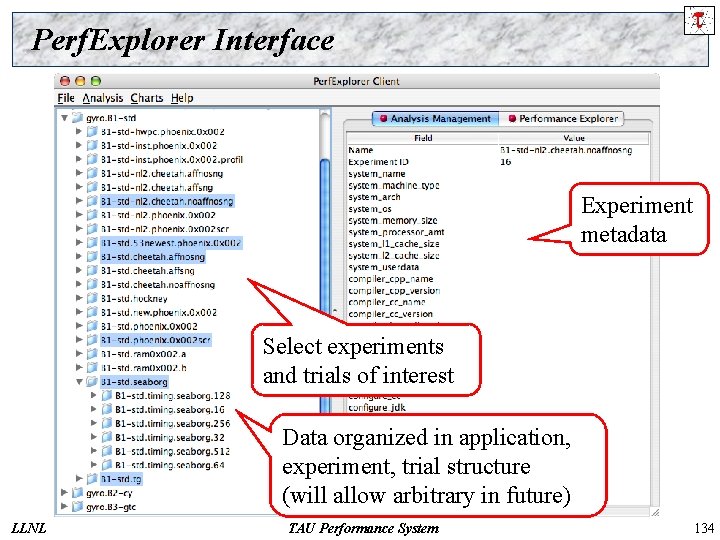
Perf. Explorer Interface Experiment metadata Select experiments and trials of interest Data organized in application, experiment, trial structure (will allow arbitrary in future) LLNL TAU Performance System 134

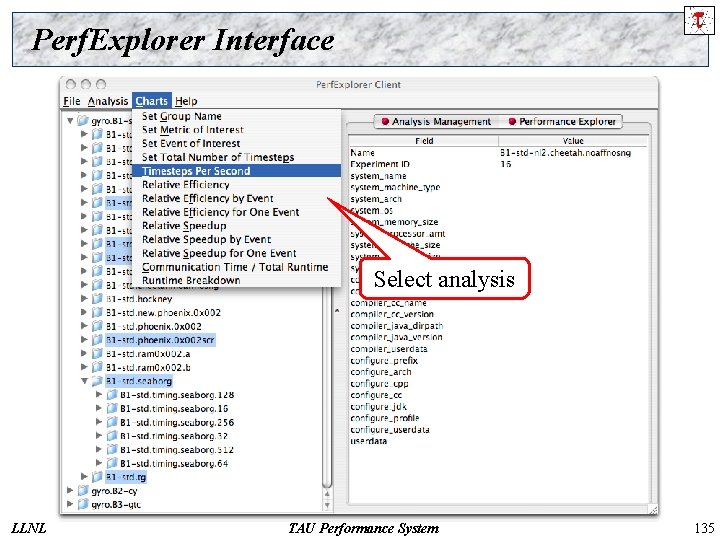
Perf. Explorer Interface Select analysis LLNL TAU Performance System 135

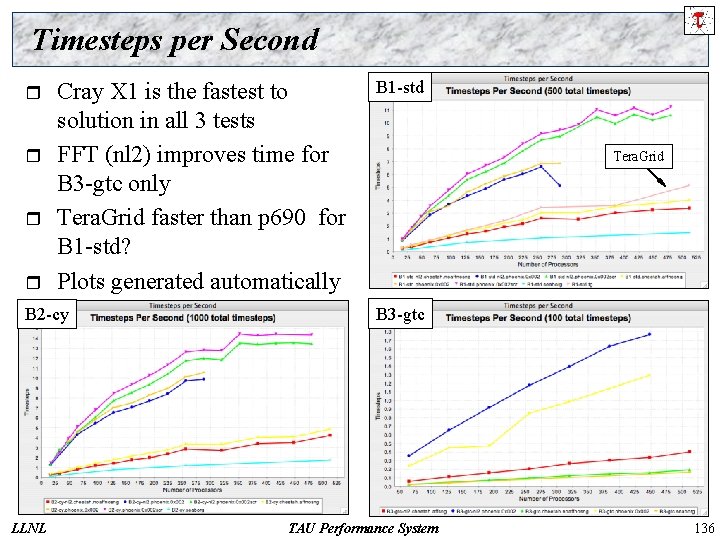
Timesteps per Second r r Cray X 1 is the fastest to solution in all 3 tests FFT (nl 2) improves time for B 3 -gtc only Tera. Grid faster than p 690 for B 1 -std? Plots generated automatically B 2 -cy B 1 -std Tera. Grid B 3 -gtc LLNL TAU Performance System 136

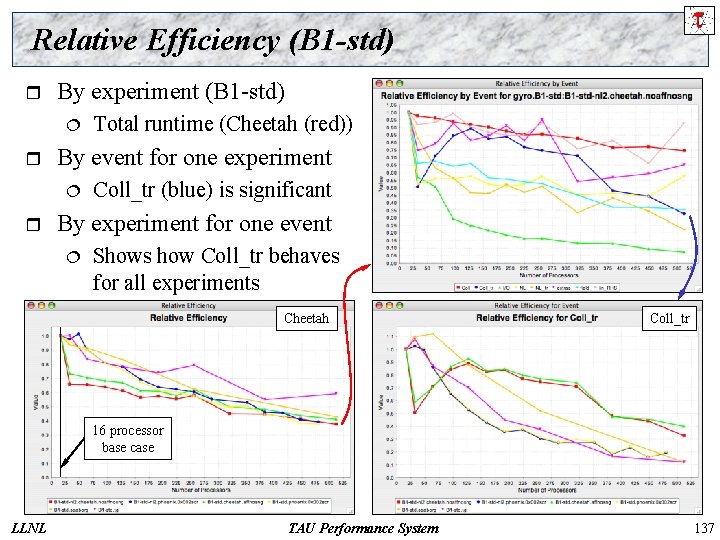
Relative Efficiency (B 1 -std) r By experiment (B 1 -std) ¦ r By event for one experiment ¦ r Total runtime (Cheetah (red)) Coll_tr (blue) is significant By experiment for one event ¦ Shows how Coll_tr behaves for all experiments Cheetah Coll_tr 16 processor base case LLNL TAU Performance System 137

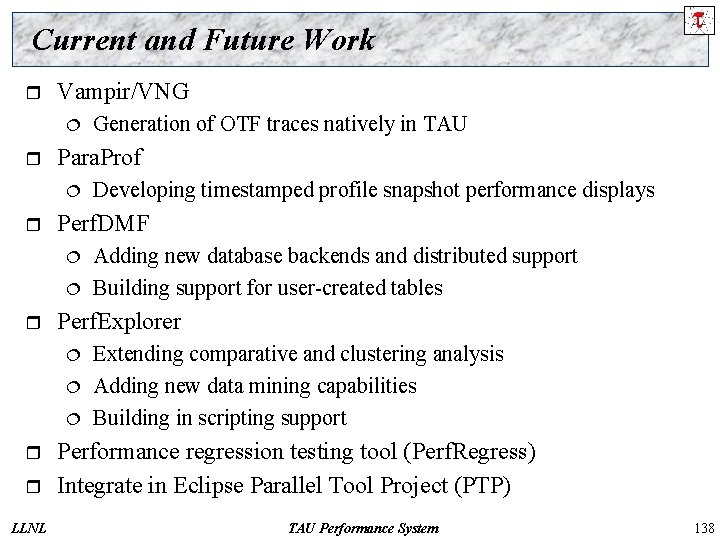
Current and Future Work r Vampir/VNG ¦ r Para. Prof ¦ r ¦ ¦ ¦ r LLNL Adding new database backends and distributed support Building support for user-created tables Perf. Explorer ¦ r Developing timestamped profile snapshot performance displays Perf. DMF ¦ r Generation of OTF traces natively in TAU Extending comparative and clustering analysis Adding new data mining capabilities Building in scripting support Performance regression testing tool (Perf. Regress) Integrate in Eclipse Parallel Tool Project (PTP) TAU Performance System 138

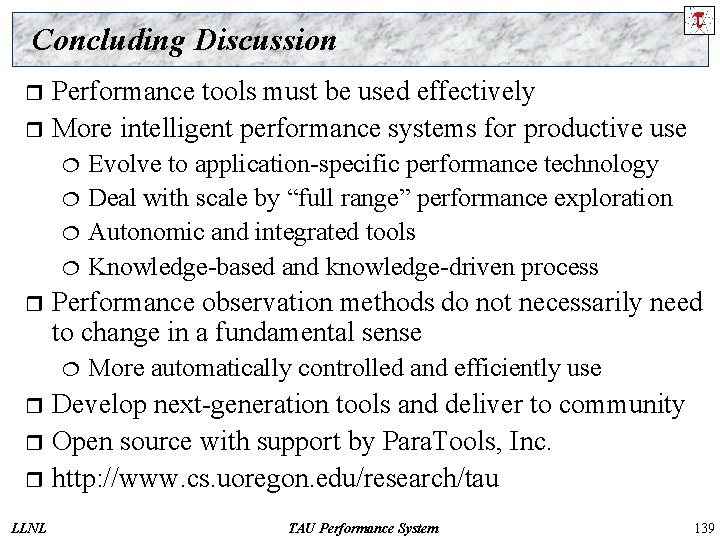
Concluding Discussion Performance tools must be used effectively r More intelligent performance systems for productive use r Evolve to application-specific performance technology ¦ Deal with scale by “full range” performance exploration ¦ Autonomic and integrated tools ¦ Knowledge-based and knowledge-driven process ¦ r Performance observation methods do not necessarily need to change in a fundamental sense ¦ More automatically controlled and efficiently use Develop next-generation tools and deliver to community r Open source with support by Para. Tools, Inc. r http: //www. cs. uoregon. edu/research/tau r LLNL TAU Performance System 139

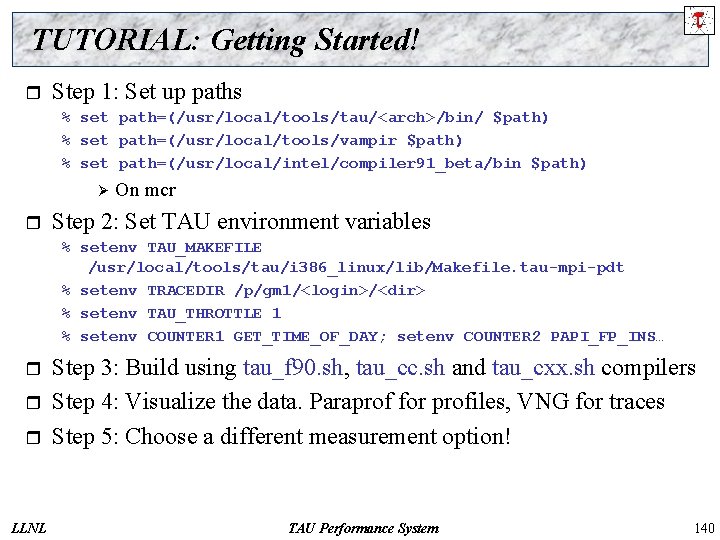
TUTORIAL: Getting Started! r Step 1: Set up paths % set path=(/usr/local/tools/tau/<arch>/bin/ $path) % set path=(/usr/local/tools/vampir $path) % set path=(/usr/local/intel/compiler 91_beta/bin $path) Ø r On mcr Step 2: Set TAU environment variables % setenv TAU_MAKEFILE /usr/local/tools/tau/i 386_linux/lib/Makefile. tau-mpi-pdt % setenv TRACEDIR /p/gm 1/<login>/<dir> % setenv TAU_THROTTLE 1 % setenv COUNTER 1 GET_TIME_OF_DAY; setenv COUNTER 2 PAPI_FP_INS… r r r LLNL Step 3: Build using tau_f 90. sh, tau_cc. sh and tau_cxx. sh compilers Step 4: Visualize the data. Paraprof for profiles, VNG for traces Step 5: Choose a different measurement option! TAU Performance System 140

Support Acknowledgements Department of Energy (DOE) ¦ Office of Science contracts ¦ University of Utah ASC Level 1 sub-contract ¦ LLNL ASC/NNSA Level 3 contract ¦ LLNL Para. Tools/GWT contract r NSF ¦ High-End Computing Grant r T. U. Dresden, GWT ¦ Dr. Wolfgang Nagel and Holger Brunst r Research Centre Juelich ¦ Dr. Bernd Mohr r Los Alamos National Laboratory contracts r LLNL TAU Performance System 141