
Talking about the Flint Lead crisis Nairanjana DasguptaJan

Talking about the Flint Lead crisis Nairanjana Dasgupta(Jan) Professor, Dept of Math and Stat Director, CISER WSU
Content v. A few words about CISER and how it works v The Crisis at Flint Michigan v How an outlier changed things v Analysis of the current data v Some thoughts about dealing with sensitive and high focus data
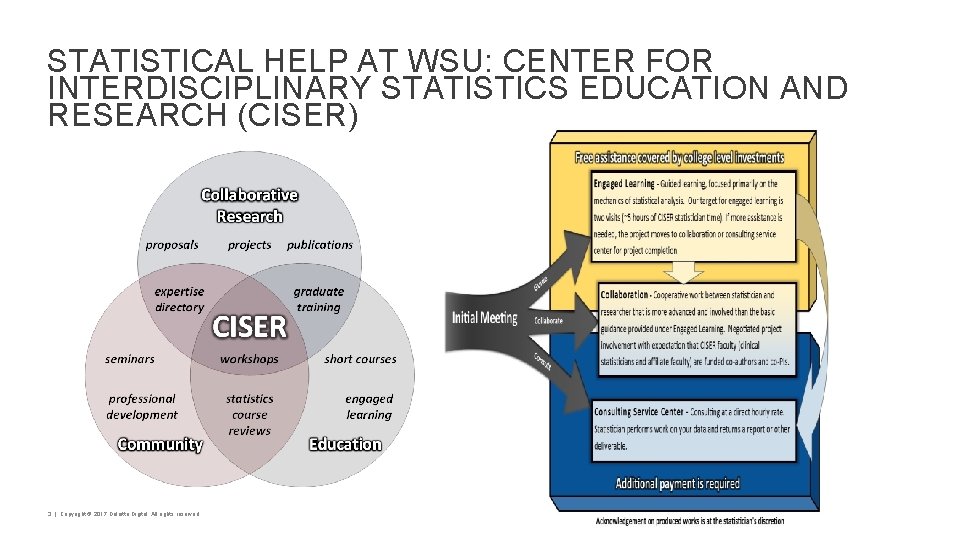
STATISTICAL HELP AT WSU: CENTER FOR INTERDISCIPLINARY STATISTICS EDUCATION AND RESEARCH (CISER) 3 | Copyright © 2017 Deloitte Digital. All rights reserved.
THE FLINT MICHIGAN LEAD CONTAMINATION PROBLEM • Step 1: What was the problem? 4 | Copyright © 2017 Deloitte Digital. All rights reserved.
CASE STUDY: WATER SAFETY IN FLINT • Brief history of the issue: Flint water • • • April 2014: Flint switches water source to Flint River Lead and Copper Rule: 15 ppb in 10% of homes tested OR 90 th percentile of total sample Action Methodological controversies, including exclusion of two outliers that change the outcome of the action Langkjær-Bain, R. (2017), The murky tale of Flint's deceptive water data. Significance, 14: 16– 21. doi: 10. 1111/j. 1740 -9713. 2017. 01016. x 5 | Copyright © 2017 Deloitte Digital. All rights reserved. https: //en. wikipedia. org/wiki/Rashomon
The Flint Water Crisis The Flint water crisis began in 2014 when the Flint River became the drinking water source for the city of Flint, Michigan. Due to insufficient water treatment, over 100, 000 residents were potentially exposed to high levels of lead in the drinking water. A federal state of emergency was declared in January 2016 and Flint residents were instructed to use only bottled or filtered water for drinking, cooking, cleaning, and bathing. As of early 2017, the water quality had returned to acceptable levels; however, residents were instructed to continue to use bottled or filtered water until all the lead pipes have been replaced, which is expected to be completed no sooner than 2020.
Lead and Copper Rule (LCR) of 1991 • EPA federal regulation • Limit allowed for lead is 15 parts per billion (ppb) • If the limit is exceeded in more than 10% of homes tested (90 th percentile ≥ 15), action is required • To make sure problems are caught, sampling is supposed to target the “worst-case” homes – those in areas served by lead pipes.
Flint Sampling Errors • Did not target worst case homes • They instructed residents to flush cold water for at least 5 minutes before sampling – which potentially decreases levels • Small openings in sampling bottles required gently running water • Regulations required 100 samples (pop >100, 000) but decided to use minimum sample size of 60 due to recent population estimates • Removed 2 outliers from the sample of 71 because one came from a home that was “fitted with filters” and one came from a business so don’t qualify although they were both over the limit (104 and 20 ppb respectively).
Flint Lead Testing Quantiles • According to this analysis of the full data, the 90 th percentile of the sample is 18 ppb, which exceeds the federal limit of 15 ppb. Consequently, the Flint water fails the safety test, and the city must take action to improve the water. • But that is not what happened. Instead, "the MDEQ told the city's water quality supervisors to remove two of the samples" (Langkjaer. Bain, p. 19) that were over 15 ppb. The MDEQ claimed that these data were improperly collected. The two data points that were excluded have the values 20 and 104. Because these values are both higher than the 90 th percentile, excluding these observations lowered the 90 th percentile of the modified sample, which has 69 observations.
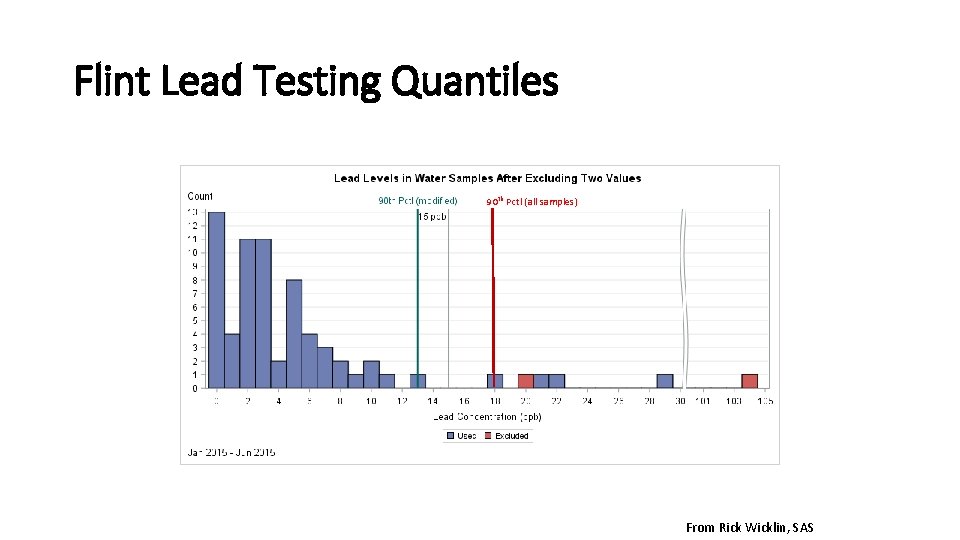
Flint Lead Testing Quantiles 90 th Pctl (all samples) From Rick Wicklin, SAS
Confidence Limits • The 95% confidence interval for P 90 is [8, 43], which is very wide and includes the critical value 15 ppb in its interior. If someone asks, "how confident are you that the 90 th percentile does not exceed 15 ppb, " you should respond, "based on these data, I am not confident at all. "
Step 2: Flint Michigan, a follow-up • More data is now available • Let us see what the data says and if things have changed? • Is there any socio-economic relationship we need to think about.
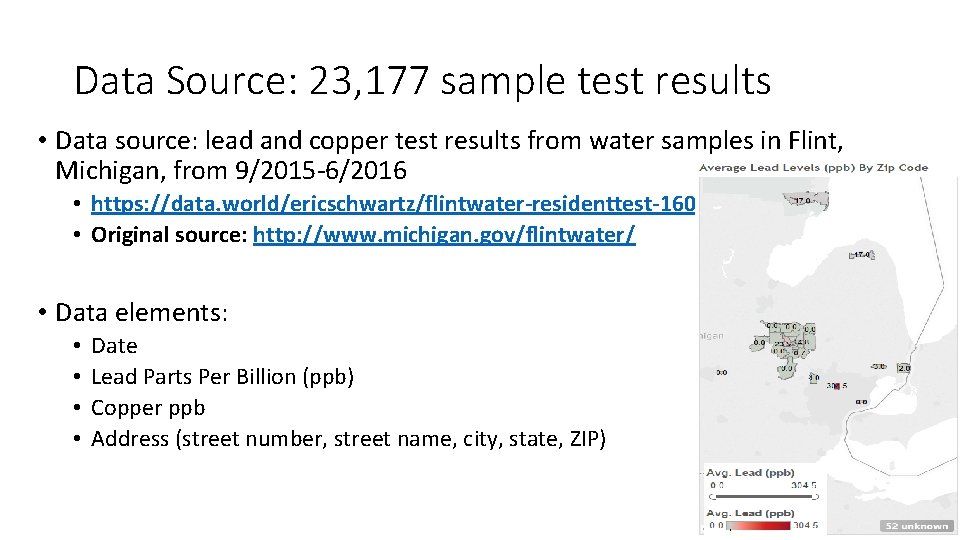
Data Source: 23, 177 sample test results • Data source: lead and copper test results from water samples in Flint, Michigan, from 9/2015 -6/2016 • https: //data. world/ericschwartz/flintwater-residenttest-160630 • Original source: http: //www. michigan. gov/flintwater/ • Data elements: • • Date Lead Parts Per Billion (ppb) Copper ppb Address (street number, street name, city, state, ZIP)
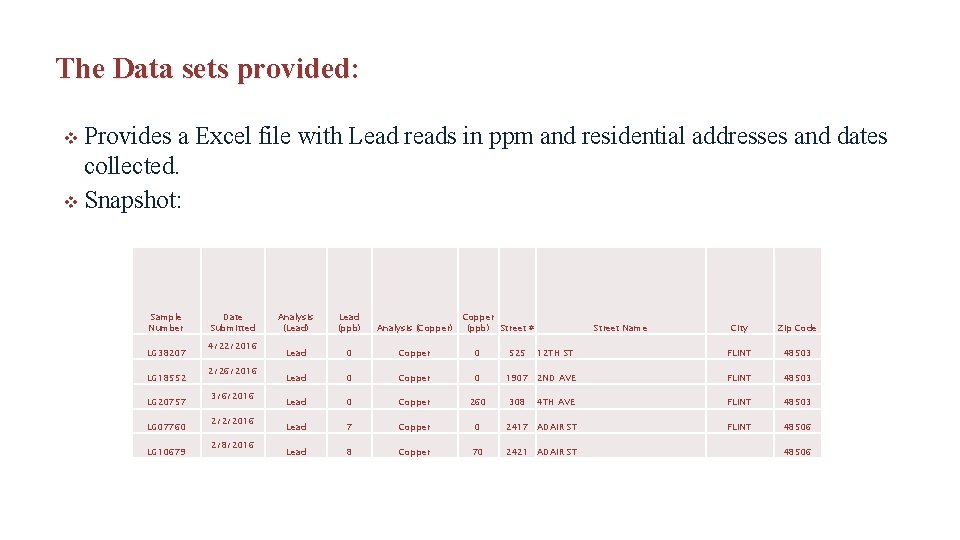
The Data sets provided: v Provides a Excel file with Lead reads in ppm and residential addresses and dates collected. v Snapshot: Sample Number LG 38207 LG 18552 LG 20757 LG 07760 LG 10679 Date Submitted 4/22/2016 2/26/2016 3/6/2016 2/2/2016 2/8/2016 Analysis (Lead) Lead (ppb) Analysis (Copper) Copper (ppb) Street # Lead 0 Copper 0 Lead 0 Copper 260 Lead 7 Copper 0 Lead 8 Copper 70 City Zip Code 12 TH ST FLINT 48503 1907 2 ND AVE FLINT 48503 2417 ADAIR ST FLINT 48506 2421 ADAIR ST 48506 525 308 Street Name 4 TH AVE
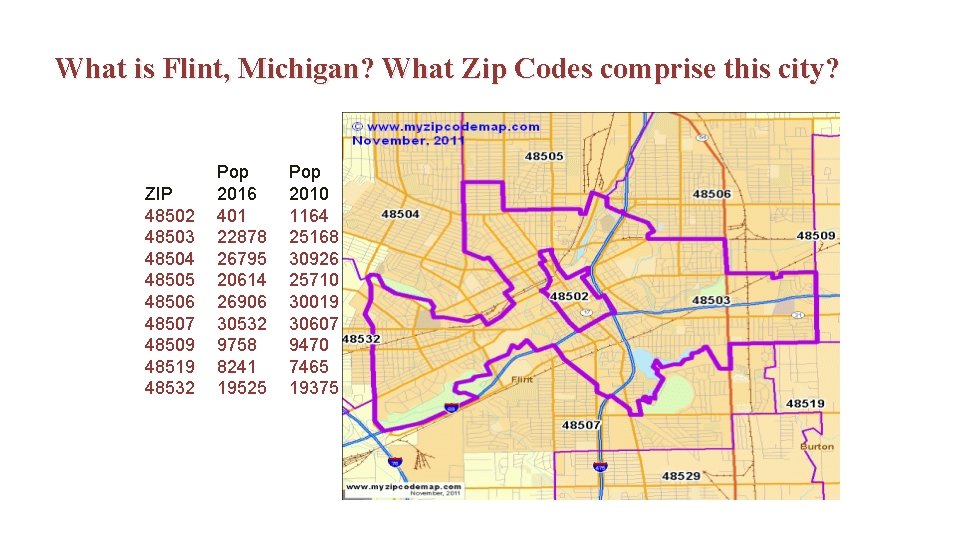
What is Flint, Michigan? What Zip Codes comprise this city? ZIP 48502 48503 48504 48505 48506 48507 48509 48519 48532 Pop 2016 401 22878 26795 20614 26906 30532 9758 8241 19525 Pop 2010 1164 25168 30926 25710 30019 30607 9470 7465 19375
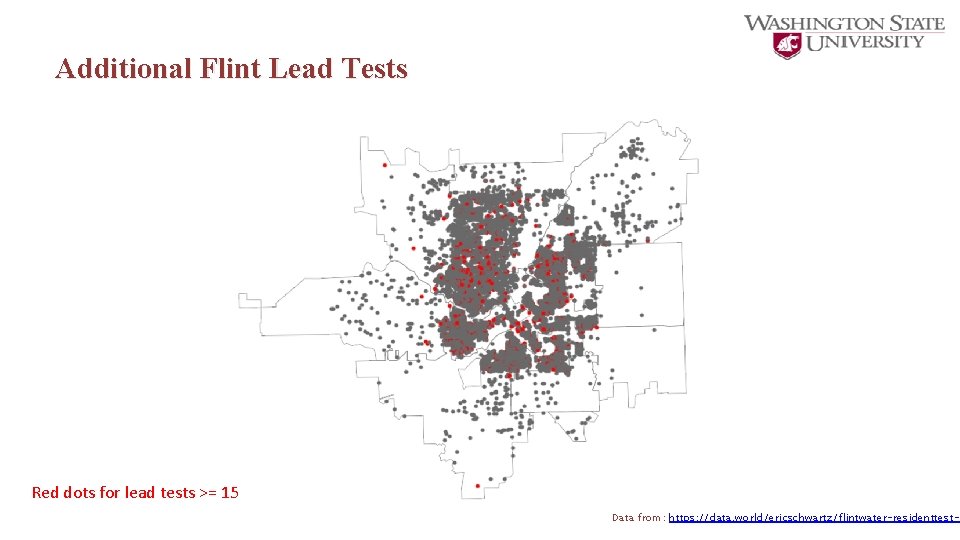
Additional Flint Lead Tests Red dots for lead tests >= 15 Data from: https: //data. world/ericschwartz/flintwater-residenttest-1
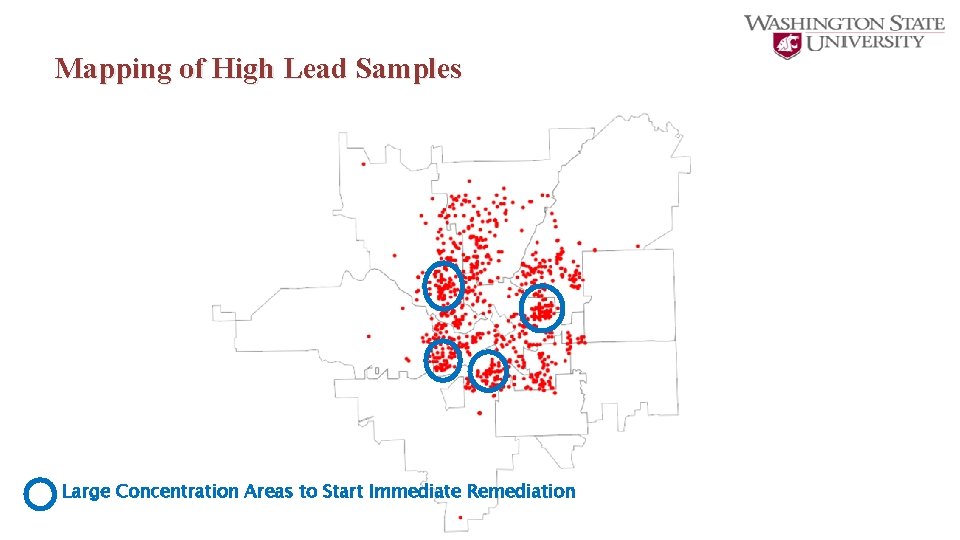
Mapping of High Lead Samples Large Concentration Areas to Start Immediate Remediation
Step 1: Plots and EDA v The most crucial step: understanding the data v This involves: plotting and asking background questions (if allowed) v Look at potential issues of the data, using plots v Our focus will be Max Lead and we will look at the aggregated data over each zip code. v Zip code rather than street addresses v We would like to see what how high lead concentrations are related to socio economic variables.
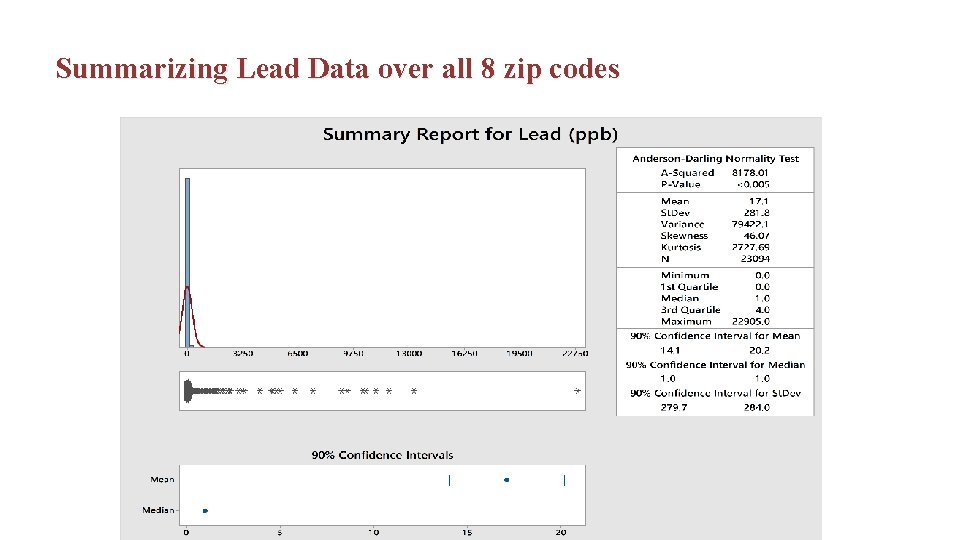
Summarizing Lead Data over all 8 zip codes
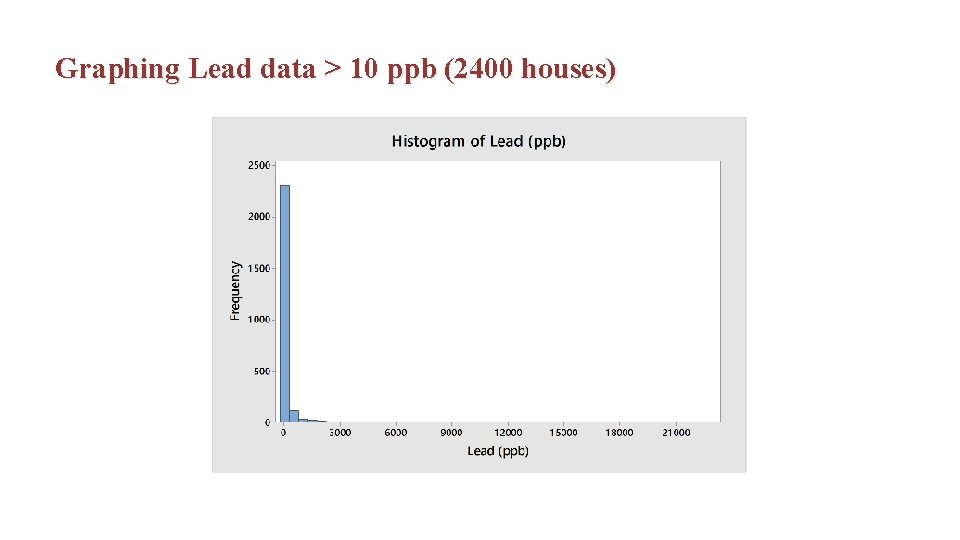
Graphing Lead data > 10 ppb (2400 houses)
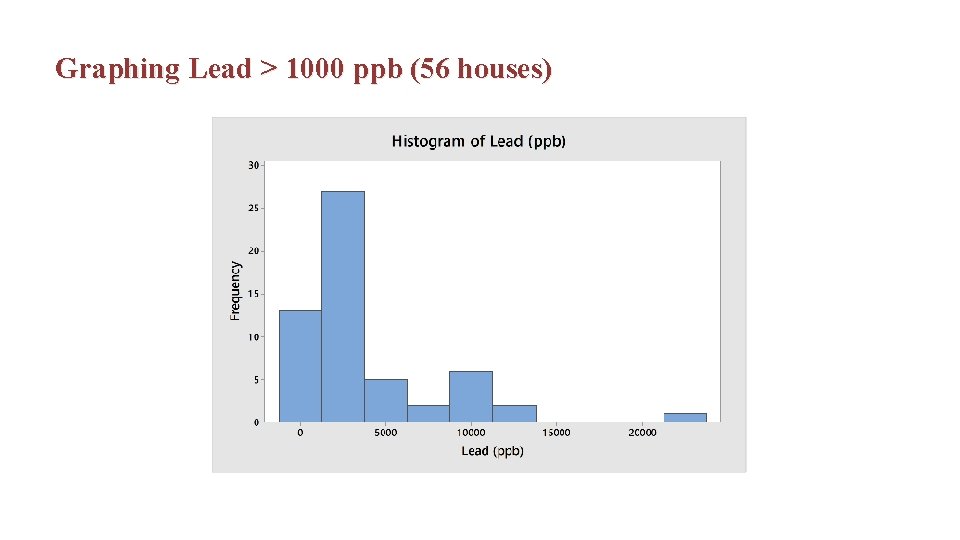
Graphing Lead > 1000 ppb (56 houses)
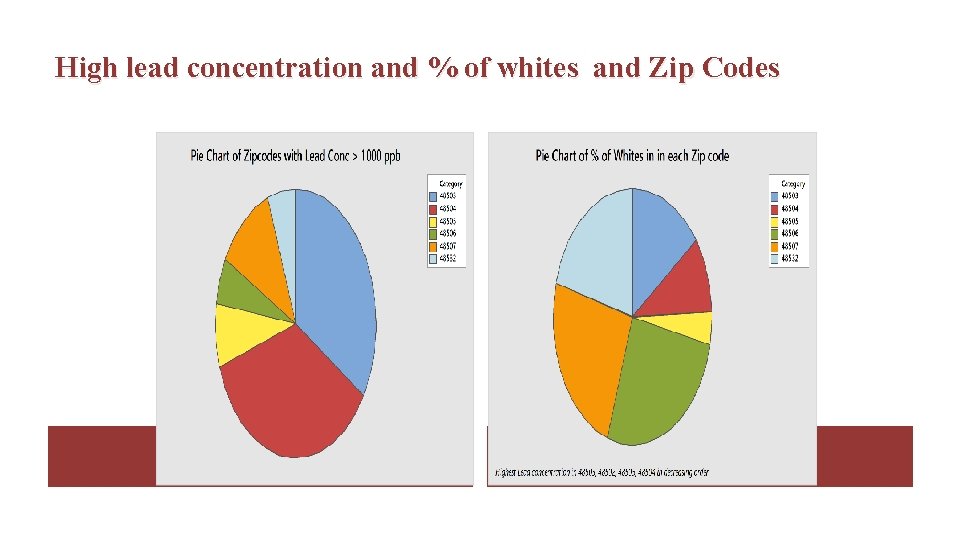
High lead concentration and % of whites and Zip Codes
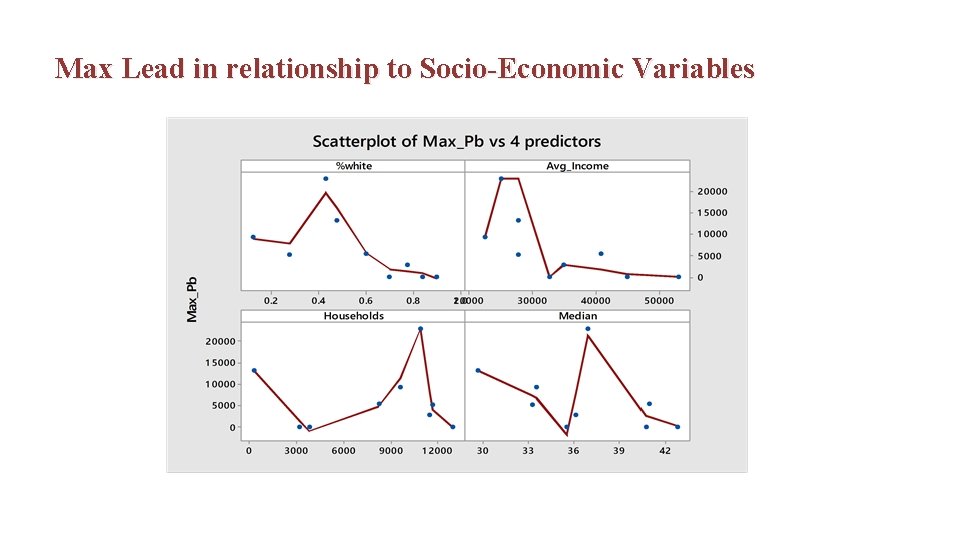
Max Lead in relationship to Socio-Economic Variables
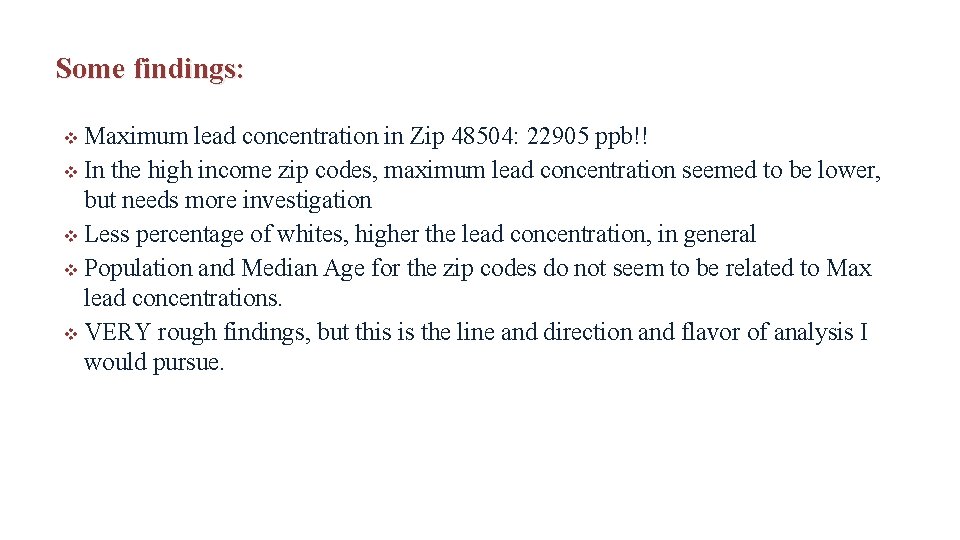
Some findings: v Maximum lead concentration in Zip 48504: 22905 ppb!! v In the high income zip codes, maximum lead concentration seemed to be lower, but needs more investigation v Less percentage of whites, higher the lead concentration, in general v Population and Median Age for the zip codes do not seem to be related to Max lead concentrations. v VERY rough findings, but this is the line and direction and flavor of analysis I would pursue.
Flint Sources • The murky tale of Flint’s deceptive water Data by Robert Langkjaer. Bain in Significance Magazine April 2017 • Quantiles and the Flint water crisis in The Do Loop by Rick Wicklin 5/17/2017 • An overview of the Flint Water Crisis on Wikipedia • Data downloaded from https: //data. world/ericschwartz/flintwaterresidenttest-160630
Some work policies if we are working on a post-research review or policy work v Try to stay away from media reports on the matter v TRY to focus on the data and not on opinions v Stay as unbiased as possible v ONLY use the data source provided or other government sponsored data source v We look at the numbers and also beyond the numbers.
My own research v How do you try to account for and reduce false positives in any study? v Will the addition of a neutral zone help false positives when trying to classify data into groups? v How do you deal with ordinal data?
- Slides: 27