
Take Solutions Starters Shriram Group founded enterprise Promoters


- Slides: 8
Take Solutions
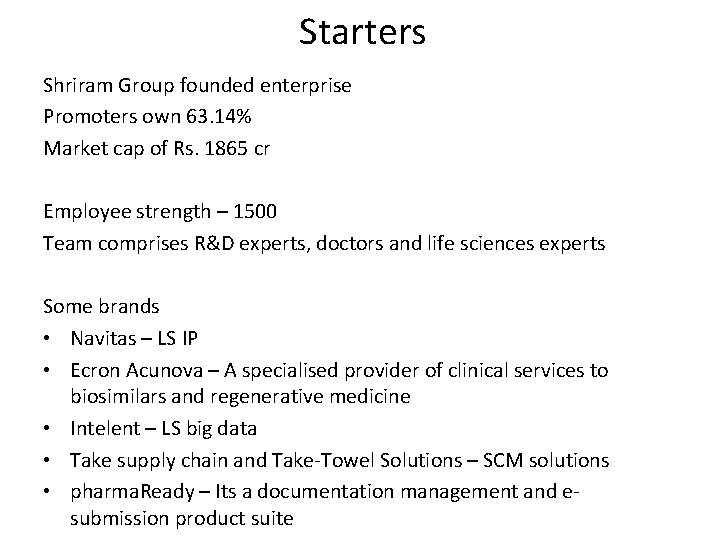
Starters Shriram Group founded enterprise Promoters own 63. 14% Market cap of Rs. 1865 cr Employee strength – 1500 Team comprises R&D experts, doctors and life sciences experts Some brands • Navitas – LS IP • Ecron Acunova – A specialised provider of clinical services to biosimilars and regenerative medicine • Intelent – LS big data • Take supply chain and Take-Towel Solutions – SCM solutions • pharma. Ready – Its a documentation management and esubmission product suite
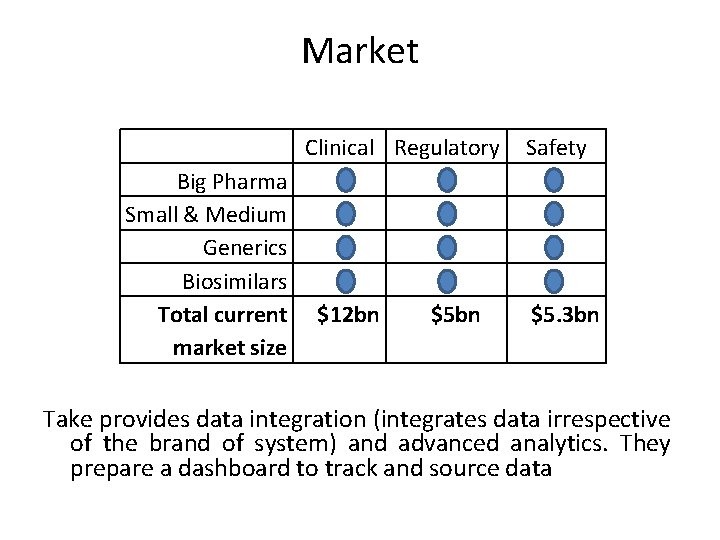
Market Clinical Regulatory Big Pharma Small & Medium Generics Biosimilars Total current market size $12 bn $5 bn Safety $5. 3 bn Take provides data integration (integrates data irrespective of the brand of system) and advanced analytics. They prepare a dashboard to track and source data
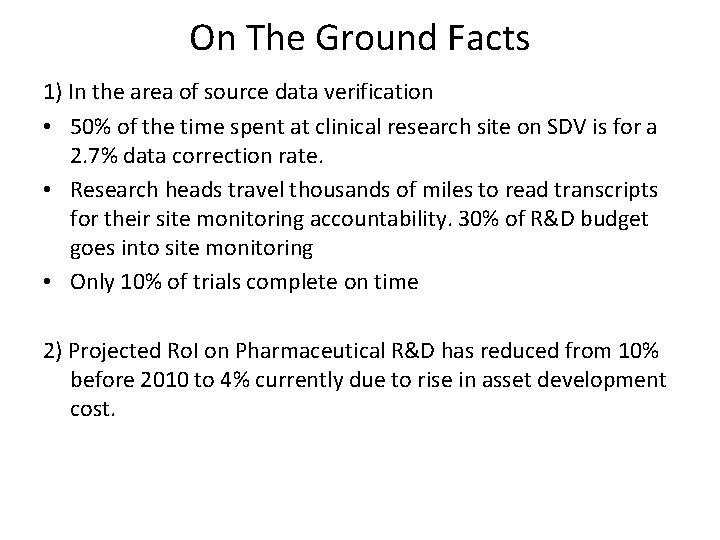
On The Ground Facts 1) In the area of source data verification • 50% of the time spent at clinical research site on SDV is for a 2. 7% data correction rate. • Research heads travel thousands of miles to read transcripts for their site monitoring accountability. 30% of R&D budget goes into site monitoring • Only 10% of trials complete on time 2) Projected Ro. I on Pharmaceutical R&D has reduced from 10% before 2010 to 4% currently due to rise in asset development cost.
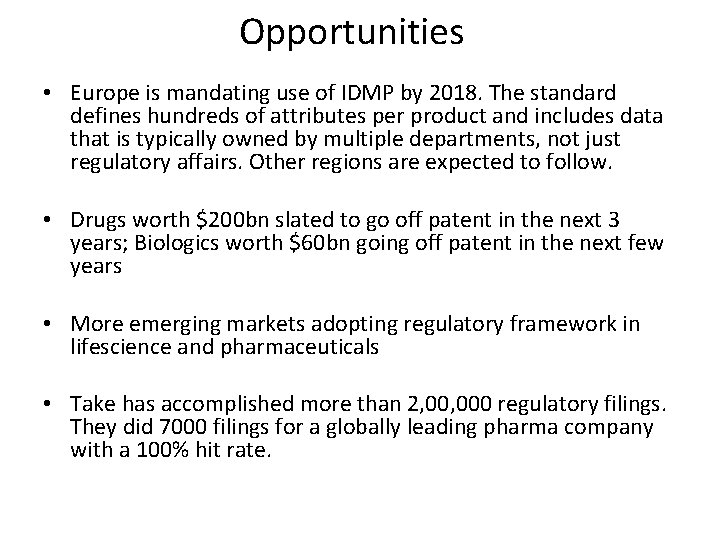
Opportunities • Europe is mandating use of IDMP by 2018. The standard defines hundreds of attributes per product and includes data that is typically owned by multiple departments, not just regulatory affairs. Other regions are expected to follow. • Drugs worth $200 bn slated to go off patent in the next 3 years; Biologics worth $60 bn going off patent in the next few years • More emerging markets adopting regulatory framework in lifescience and pharmaceuticals • Take has accomplished more than 2, 000 regulatory filings. They did 7000 filings for a globally leading pharma company with a 100% hit rate.
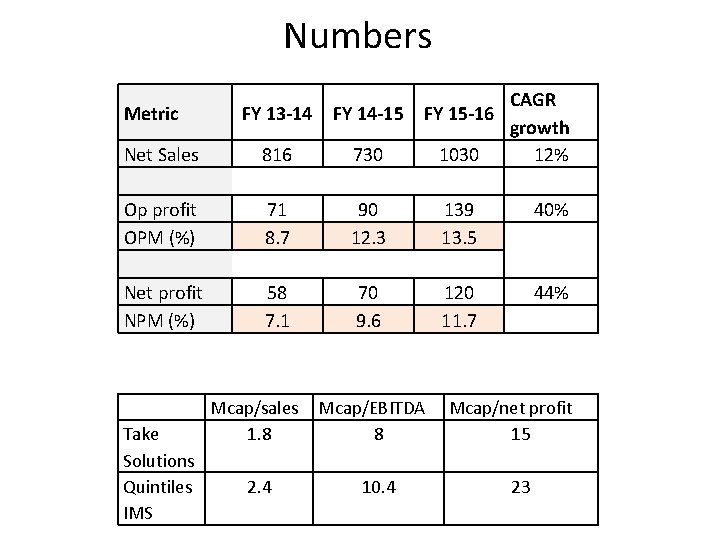
Numbers Metric Net Sales Op profit OPM (%) Net profit NPM (%) Take Solutions Quintiles IMS FY 13 -14 816 71 8. 7 58 7. 1 Mcap/sales 1. 8 2. 4 FY 14 -15 FY 15 -16 730 90 12. 3 70 9. 6 Mcap/EBITDA 8 10. 4 1030 139 13. 5 120 11. 7 CAGR growth 12% 40% 44% Mcap/net profit 15 23
Risks • Debtor days = 100 days • Execution risks due to shortage of skilled manpower • Stronger rupee