Taint Analysis Contents Pin Tool Introduction Instrumentation granularity


")


![Detect Use After Free[4] • For every object, dynamically record all the pointers that](https://slidetodoc.com/presentation_image_h/e87a6e1f1b6beeb8b0297d848ffbc32e/image-54.jpg "Detect Use After Free[4] • For every object, dynamically record all the pointers that")
![Reference: PIN introduce [1]https: //software. intel. com/sites/landingpage/pintool/docs/71313/Pin/html/ index. html PIN的API文档: [2]https: //software. intel. com/sites/landingpage/pintool/docs/71313/Pin/html/](https://slidetodoc.com/presentation_image_h/e87a6e1f1b6beeb8b0297d848ffbc32e/image-55.jpg "Reference: PIN introduce [1]https: //software. intel. com/sites/landingpage/pintool/docs/71313/Pin/html/ index. html PIN的API文档: [2]https: //software. intel. com/sites/landingpage/pintool/docs/71313/Pin/html/")
- Slides: 55
Taint Analysis
Contents • Pin Tool Ø Ø Ø Introduction Instrumentation granularity Trace instrumentation Example Other important features • Dynamic Taint Analysis Ø Ø Introduction Classify of taint analysis Taint procedure Taint analysis for security 2
Pin tools 3
Instrumentation • A technique that inserts code into a program to collect runtime information Ø Ø Program analysis : performance profiling, error detection, capture & replay Architectural study : processor and cache simulation, trace collection • Source-Code Instrumentation • Static Binary Instrumentation • Dynamic Binary Instrumentation Ø Instrument code just before it runs ( Just In Time - JIT) ü ü ü No need to recompile or re-link Discover code at runtime Handle dynamically-generated code -Attach to running processes 4
Pin Instrumentation Capability Use Pin APIs to write Pin. Tools that: • Replace application functions with your own Ø Call the original application function from within your replacement function • Fully examine any application instruction, and insert a call to your instrumenting function to be executed whenever that instruction executes Ø Pass parameters to your instrumenting function from a large set of supported parameters ü ü • • • Register values (including IP), Register values by reference (for modification) Memory addresses read/written by the instruction Full register context …… Track function calls including syscalls and examine/change arguments Track application threads Intercept signals Instrument a process tree 5 Many other capabilities. . .
Modifying Program Behavior Pin allows you not only to observe but also change program behavior • Ways to change program behavior: Ø Ø Add/delete instructions Change register values Change control flow Change memory values 6
Pin Invocation Launcher Process pin. exe –t inscount. dll – gzip. exe input. txt Count 258743109 gzip. exe input. txt PIN. EXE Read aat. Trace from Application Code Starting first application IP Read a Trace Pin. Tool that Jit it, adding instrumentation codecounts fromapplication instructions executed, from Application Code prints Count at end Source Trace exit branch is modified to Start PINVM. DLL Execution of Trace ends inscount. dll Jit it, adding instrumentation code from directly branch to trace Destination Trace running Call into PINVM. DLL to Jit next Load Encode the jitted into thetrace Code inscount. dll Load PINVM. DLL (first. App. Ip, Pass in app IP of Trace’s target inscount. dll and Cachethe trace into the Code Cache Encode “inscount. dll”) run its main() Execute Jitted code Launcher Write. Process. Memory(Boot. Routine, Boot. Data) Resume atand Boot. Routine Get. Context(&first. App. Ip) Inject Pin Boot. Routine Data into application Set. Context(Boot. Routine. Ip) Create. Process (gzip. exe, input. txt, suspended) Boot Routine + Data: first. App. Ip, “Inscount. dll” First app IP Application Process PIN. LIB System Call Dispatcher Event Dispatcher Encoder PINVM. DLL Decoder Application Code and Data inscount. dll Code Cache Thread Dispatcher NTDLL. DLL app Ip of Trace’s target Windows kernel
Instrumentation Granularity • Instruction instrumentation • Basic block Ø Ø A sequence of instructions terminated at a control-flow changing instruction Single entry, single exit • Trace instrumentation Ø Ø A sequence of basic blocks terminated at an unconditional control-flow changing instruction Single entry, multiple exits • Routine instrumentation • Image instrumentation 8
Trace 9
Example: Instruction Counting Tool 10
Multi-threading support • Pin supports multi-threading • Application threads execute jit code including instrumentation code (inlined and not inlined), without any serialization introduced by Pin Ø Instrumentation code can use Pin and/or OS synchronization constructs to introduce serialization if needed. ü Will see examples of this in Part 4 Ø Pin provides APIs for thread local storage. ü Will see examples in Part 3 • Pin callbacks are serialized • Jitting is serialized Ø Only one application thread can be jitting code at any time 11
Pin Probe-Mode • Probe mode is a method of using Pin to wrap or replace application functions with functions in the tool. A jump instruction (probe), which redirects the flow of control to the replacement function is placed at the start of the specified function. • The bytes being overwritten are relocated, so that Pin can provide the replacement function with the address of the first relocated byte. This enables the replacement function to call the replaced (original) function. • In probe mode, the application and the replacement routine are run native (not Jitted). This improves performance, but puts more responsibility on the tool writer. Probes can only be placed on RTN boundaries, and should inserted within the Image load callback. Pin will automatically remove the probes when an image is unloaded. • Many of the PIN APIs that are available in JIT mode are not available in Probe mode. 12
Pin Probe-Mode 13
Performance Pin in Windows v. s. Pin in Linux Without Instrumentation 14
Taint Analysis • Introduction Ø Ø Ø Basic concept Shadow Memory Introduction • Classify of taint analysis Ø Statistic Taint Analysis Ø Dynamic Taint Analysis Byte or bit Ø • Taint procedure Ø Ø Catch the syscalls Spread the taint • Taint analysis for security 15
Classify Of taint Analysis • Static Taint Analysis Ø Ø The advantage of using static analysis is the fact that it provides better code coverage than dynamic analysis. On the other hand, the principal disadvantage of the static analysis is that it's not as accurate than the dynamic analysis - It cannot access the runtime information for example. We can't retrieve registers or memory values. • Dynamic Taint Analysis Ø Dynamic analysis we can't cover all the code but you will be more reliable. 16
Basic concept Taint propagation: Ø Taint If an operation uses the value of some tainted object, say X, to derive a value for another, say Y, then object Y becomes tainted. Object X tainted the object Y 17
Taint propagation 18
Basic concept • Taint Sources: program, or memory locations, where data of interest enter the system and subsequently get tagged. For the convenience of description, we use the user input as the taint source in this course. • Taint Tracking: process of propagating data tags according to program semantics • Taint Sinks: program, or memory locations, where checks for tagged data can be made 19
Introduction Taint analysis is used to know at a program point what part of memory or register are controllable by the some data we are interested, for example: user input. According to the instruction semantics the taint is spread over the execution. 20
Introduction For example see the following code. In the example 1, at the beginning, the 'a' and 'b' variables are not tainted. When the atoi function is called the 'a' variable is tainted. Then 'b' is tainted when assigned by the 'a' value. Now we know that the foo 2 function argument can be controlled by the user. 21
Introduction In the example 2, when the buffer is allocated via malloc the content is not tainted. Then when the allocated area is initiazlied by user inputs, we need to taint the bytes 'buffer+2', 'buffer+12' and 'buffer+30'. Later, when one of those bytes is read, we know it can be controlled by the user. 22
Byte or bit ? One of these problems is to determine what method is the more accurate to do a taint with a great precision. For example, what are we supposed to do when a controlled byte is multiplied and stored somewhere in memory ? Should we taint the destination variable ? See the following code. call mov cmp jse cmp jne shl sub mov next: mov leave ret atoi@plt eax, edx eax, $0 next eax, $4 next eax, 0 x 3 eax, edx eax, DWORD PTR[rbp-0 x 4], eax 23
Byte or bit ? In the previous code, we can control only 5 bits of the variable 'num' ; not the whole integer. So, we can't say that we control the totality of this variable when it is returned and used somewhere else. 24
Byte or bit ? Byte taint analysis assert b is tainted. Bit taint analysis assert b is not tainted. 25
Byte or bit ? So, what to do? Tainting bytes is easier and light or tainting bits controlled by the user? If you taint bytes, it will be easier but not reliable. If we taint bits, it will be harder and more difficult to manage the taint tree but it will be 99% reliable. Taint bytes is enough for most situation. 26
Dynamic Taint Analysis How to do the dynamic taint analysis? 27
Dynamic Taint Analysis In order to do this, we need a dynamic binary instrumentation(DBI) framework. The purpose of the DBI is to add a pre/post handler on each instruction. When a handler is called, you are able to retrieve all the information you want about the instruction or the environment (memory). I choose to use Pin: a C++ dynamic binary instrumentation framework (without IR) written by Intel. 28
Shadow Memory We user shadow memory to mark all address can be tainted by originate data we interested. 29
Shadow Memory • Shadow Memory: Shadow memory describes a computer science technique in which potentially every byte used by a program during its execution has a shadow byte or bytes. • These shadow bytes are typically invisible to the original program and are used to record information about the original piece of data. • The program is typically kept unaware of the existence of shadow memory by using a dynamic binary translator /instrumentor, which, among other things, may translate the original programs memory read and write operations into operations that do the original read and write and also update the shadow memory as necessary. 30
Shadow Memory • Shadow Memory Ø We need a mapping ü ü Addr → Abstract State Register → Abstract 31
Shadow Memory • Shadow Memory Ø We need a mapping ü ü Addr → Abstract State Register → Abstract 32
Shadow Memory • Shadow Memory Ø We need a mapping ü ü Addr → Abstract State Register → Abstract 33
Shadow Memory • Shadow Memory Ø We need a mapping ü ü Addr → Abstract State Register → Abstract 34
Shadow Memory • Shadow Memory Ø We need a mapping ü ü Addr → Abstract State Register → Abstract 35
Dynamic taint Analysis Firstly we need to determinate all user inputs like environment and syscalls. We begin to taint these inputs and we spread/remove the taint when we have instructions like GET/PUT, LOAD/STORE. 36
Dynamic Taint Analysis • For this first example, we are going to taint the 'read' memory area and we will see a brief overview of the Pin API. For this first test we will : Ø Ø Catch the sys_read syscall. Get the second and the third argument for taint area. Call an handler when we have an instruction like LOAD or STORE in this area. Spread the taint. 37
Catch the syscalls When a syscall occurs, we will check if the syscall is read. Then, we save the second and third argument which describe our memory area. The second argument is the start of memory address which the syscall is writing to. The third argument is the length of data to write to the memeory. 38
Catch the syscalls 39
Catch the LOAD and STORE instructions Now we need to catch all instructions that read (LOAD) or write (STORE) in the tainted area. To do that, we will add a function called each time an access to this area is made. 40
Catch the LOAD and STORE instructions 41
Hook Load Instruction 42
Hook Store Instruction 43
Spread the taint Imagine you LOAD a value in a register from the tainted memory, then you STORE this register in another memory location. In this case, we need to taint the register and the new memory location. Same way, if a constant is STORED in the memory area tainted, we need to delete the taint because the user can't control this memory location anymore. 44
Spread the taint Imagine you LOAD a value in a register from the tainted memory, then you STORE this register in another memory location. In this case, we need to taint the register and the new memory location. Same way, if a constant is STORED in the memory area tainted, we need to delete the taint because the user can't control this memory location anymore. 45
Spread the taint 46
Spread the taint 47
Taint analysis for security • Detect Overflow-Return-Address • Detect Use After Free 48
Detect overflow-Return-Value • How to check if the return address is overflowed? • How to get the esp value pointed to return address?
Check the return address Before every return esp pop %esp if %esp tainted ret addr overflowed
Get esp value instrument get cpu context get esp value check the esp value
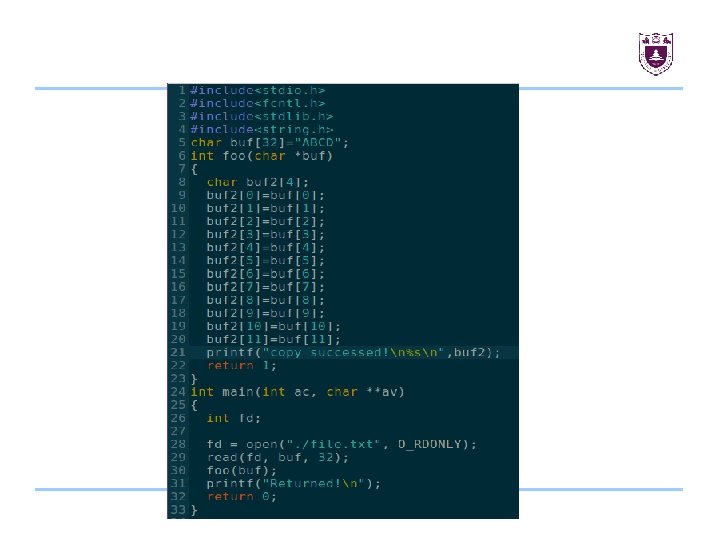
Example
Detect Use After Free[4] • For every object, dynamically record all the pointers that point to it, and all the object that pointers in it point to. • For every free() operation, assignment pointer to NULL if there exists pointers point to it.
Reference: PIN introduce [1]https: //software. intel. com/sites/landingpage/pintool/docs/71313/Pin/html/ index. html PIN的API文档: [2]https: //software. intel. com/sites/landingpage/pintool/docs/71313/Pin/html/ group__PIN__SYSCALL__API. html PIN tool 下载: [3] https : //software. intel. com/en-us/articles/pin-a-binary-instrumentation-tooldownloads [4] Free. Sentry: Protecting Against Use-After-Free Vulnerabilities Due to Dangling Pointers