Tabular Presentation A statistical table is a systematic

Tabular Presentation

A statistical table is a systematic organization of data in columns and rows. There are many advantages in making a table. Some of them are : 1. Simple and Brief Presentation 2. Enables Comparison 3. Easy Analysis 4. Highlights Characteristics of Data 5. Economical
 Qualitative b)")
Classification of Table Classification used in tabulation is of four kinds. a) Qualitative b) Quantitative c) Temporal d) Spatial

Qualitative Classification – This occurs when data is classified on basis of qualitative characteristics of an item. Example : Data of unemployment may relate to rural-urban areas, skilled and unskilled workers, etc.

Quantitative Classification – This occurs when data is classified on basis of quantitative characteristics of an item. Example : Data on distribution of respondents by their age in an election.

Temporal Classification – In this type of classification data should be classified according to time. Example : Yearly sales of a tea shop.

Spatial Classification – In this type of classification data is classified according to place/location. Example : Data on export of India to rest of the world.

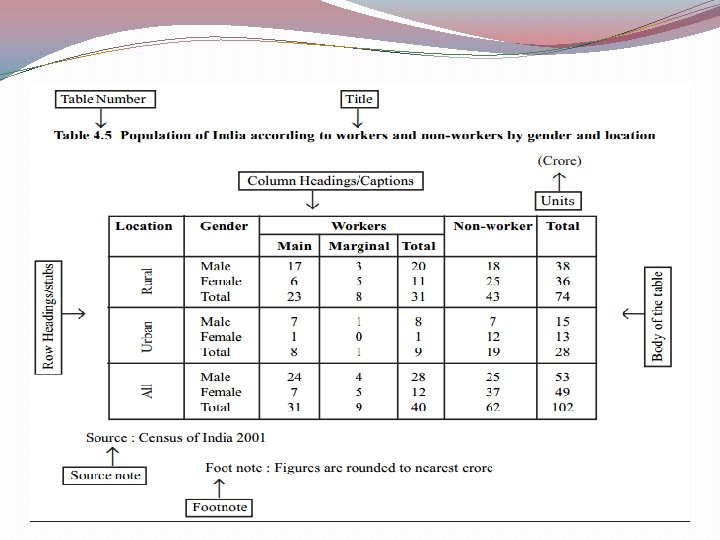
Components of a Table v. Table Number : A table must always be numbered. These numbers facilitate location of the tables. v. Title : A table must always have a title. The title should attract attention of the readers. It must be clear, simple and short. v. Head Note : If the title doesn’t give enough information it’s supplemented with a head note. v. Stubs : These are the titles of the rows of a table.

v Caption : These are the titles of the columns of a table. v Body of the Table : It means sum total of the items in a table. It’s the most important part of a table. Each item in the body is called a cell. v Foot Notes : These are given when information in the table needs to be supplemented. v Source : When table is based on secondary data source of information is to be given. This should be specified below the footnote.
- Slides: 10