Table S 1 Results of the kinase panel
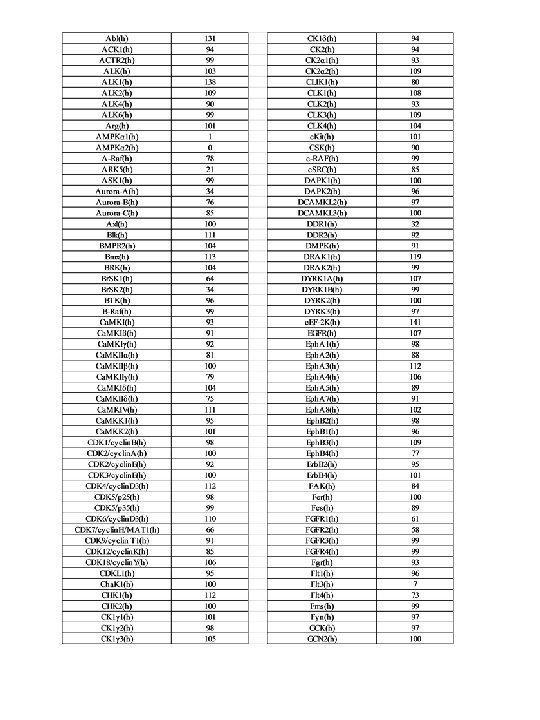
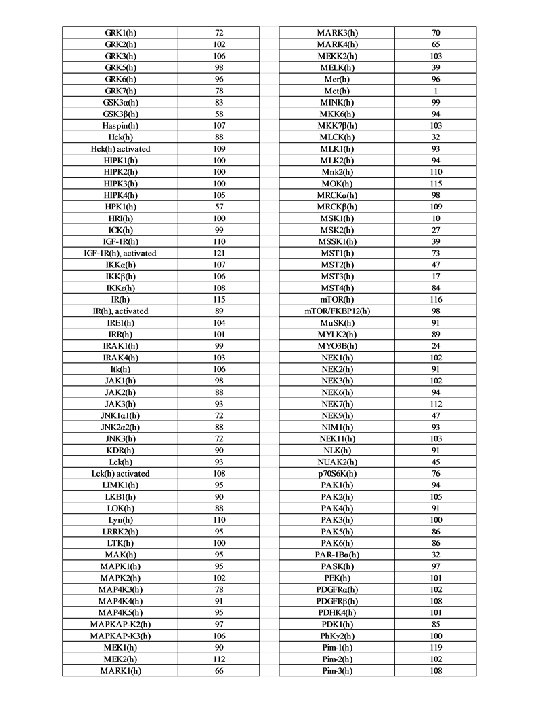

Table S 1 Results of the kinase panel tested at 10 µM ATP concentration. Percentage activity compared to buffer control is given. (h): human.

Cell line Oci-Ly-7 Ramos REC-1 RAJI Daudi L-363 lymphoblast SU-DHL 10 lymph node Origin B cell lympho ma plasma cell Treatment duration (days) 3 3 3 3 IC 50 (µM) 12. 2 12. 1 3. 3 > 33. 0 12. 5 22. 9 10. 8 Cell line JJN-3 AMO-1 SK-N-F-1 LP-1 OPM-2 SW 780 U 2 -OS Origin plasma cell plasmacytoma bone marrow multiple myeloma bladder bone Treatment duration (days) 3 3 6 3 3 IC 50 (µM) > 20. 0 > 33. 0 21. 2 1. 9 1. 5 10. 3 18. 7 Cell line IMR 32 U 251 IMR-5/75 Colo 201 brain neuroblas toma MDA-MB 453 breast He. La Origin MDA-MB 231 breast cervix colon Treatment duration (days) 6 3 3 3 3 IC 50 (µM) > 11. 5 20. 9 21. 3 > 30. 0 14. 6 25. 7 16. 0 Cell line Colo 320 LS 174 T SW 480 Snu 398 A 549 Origin colon liver lung NCIH 292 lung NCIH 460 lung Treatment duration (days) 3 3 3 3 IC 50 (µM) > 22. 2 > 30. 0 27. 8 7. 3 25. 8 17. 1 > 33. 0 Cell line NCIH 520 lung A 2780 Bx. PC 3 PANC-1 A 375 Snu 16 ovary pancreas skin stomach Treatment duration (days) 3 3 3 IC 50 (µM) 24. 1 > 33. 0 11. 4 17. 1 22. 8 11. 6 Origin Table S 2 Anti-proliferative activity of BAY-3827. Cancer cell viability was determined by Cell. Titer-Glo® after treatment with BAY-3827 for the indicated time. Mean IC 50 values are given.

normal 10 n. M R 1881 10 n. M R 1881 normal + c. FCS 0 n. M R 1881 0. 1 n. M R 1881 1 n. M R 1881 10 n. M R 1881 24 hours 72 hours 144 hours 1 n. M R 1881 24 hours 72 hours 144 hours 0 n. M R 1881 0. 1 n. M R 1881 10 n. M R 1881 0. 1 n. M R 1881 normal + c. FCS 0 n. M R 1881 0. 1 n. M R 1881 10 n. M R 1881 normal + c. FCS 0 n. M R 1881 0. 1 n. M R 1881 10 n. M R 1881 0. 1 n. M R 1881 24 hours 72 hours 144 hours + c. FCS 0 n. M R 1881 0. 1 n. M R 1881 10 n. M R 1881 normal 10 n. M R 1881 1 n. M R 1881 0. 1 n. M R 1881 10 n. M R 1881 0. 1 n. M R 1881 + c. FCS 0 n. M R 1881 0. 1 n. M R 1881 10 n. M R 1881 normal + c. FCS 0 n. M R 1881 0. 1 n. M R 1881 10 n. M R 1881 0. 1 n. M R 1881 24 hours 72 hours 144 hours ACC 1 (280 k. Da) HSP 90 (90 k. Da) AMPKa (62 k. Da) 24 hours 72 hours 144 hours p. ACC 1 (280 k. Da) HSP 90 (90 k. Da) p. AMPKa (62 k. Da) 24 hours 72 hours 144 hours Ca. MKK 2 (68 k. Da) HSP 90 (90 k. Da) Figure S 1 Western blot analysis of ACC 1, AMPKa, Ca. MKK 2 protein levels, and of ACC 1 and AMPKa phosphorylation in LNCa. P cells. HSP 90 protein levels were determined as loading control.

Table S 3 Impact of androgen treatment on the expression of genes linked to AMPK signaling. RNA was extracted from LNCa. P or VCa. P cells treated with DMSO only or with 1 n. M R 1881, and analyzed using the AMPK signaling RT 2 array.

Table S 4 Impact of BAY-3827 treatment on the expression of genes linked to AMPK signaling. RNA was extracted from LNCa. P or VCa. P cells grown in the presence of R 1881 and treated with BAY-3827, and analyzed using the AMPK signaling RT 2 array.

B Correlation R = 0. 10 p = 0. 4 log 2 FC R 1881 effect C VCa. P cells (24 hours) log 2 FC R 1881 + BAY-3827 effect LNCa. P cells (24 hours) Correlation R = 0. 29 p = 0. 01 log 2 FC R 1881 effect VCa. P cells (48 hours) log 2 FC R 1881 + BAY-3827 effect A CPT 1 A PRKAR 2 B Correlation R = 0. 11 p = 0. 3 log 2 FC R 1881 effect Figure S 2 Scatter plot of log 2 fold changes (log 2 FC) in gene expression comparing genes regulated by R 1881 (x-axis) and by R 1881 plus BAY-3827 (y-axis). A LNCa. P cells treated for 24 hours. B VCa. P cells treated for 24 hours. C VCa. P cells treated for 48 hours.
- Slides: 8