t test Student t test is a statistical


 is greater than")


- Slides: 31
t test • Student t test is a statistical test which is widely used to compare the mean of two groups of samples. It is therefore to evaluate whether the means of the two sets of data are statistically significantly different from each other. • There are many types of t test : • The one-sample t-test, used to compare the mean of a population with a theoretical value. • The unpaired two sample t-test, used to compare the mean of two independent samples. • The paired t-test, used to compare the means between two related groups of samples.
• One-sample t-test formula • As mentioned above, one-sample t-test is used to compare the mean of a population to a specified theoretical mean (μμ). • Let X represents a set of values with size n, with mean m and with standard deviation S. The comparison of the observed mean (m) of the population to a theoretical value μμ is performed with the formula below :
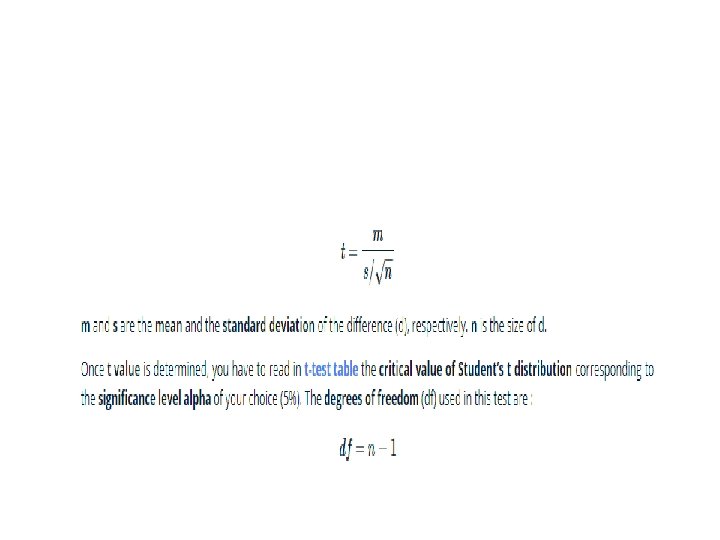
• To evaluate whether the difference is statistically significant, you first have to read in t test table the critical value of Student’s t distribution corresponding to the significance level alpha of your choice (5%). The degrees of freedom (df) used in this test are : • df=n− 1 •
• If the absolute value of the t-test statistics (|t|) is greater than the critical value, then the difference is significant. Otherwise it isn’t. The level of significance or (p-value) corresponds to the risk indicated by the t test table for the calculated |t| value.
• Independent two sample t-test • What is independent t-test ? • Independent (or unpaired two sample) t-test is used to compare the means of two unrelated groups of samples. • As an example, we have a cohort of 100 individuals (50 women and 50 men). The question is to test whether the average weight of women is significantly different from that of men? • In this case, we have two independents groups of samples and unpaired t-test can be used to test whether the means are different.
• Independent t-test formula • Let A and B represent the two groups to compare. • Let m. A and m. B represent the means of groups A and B, respectively. • Let n. A and n. B represent the sizes of group A and B, respectively. • The t test statistic value to test whether the means are different can be calculated as follow : •
The formula for standard deviation is given by:
• S 2 is an estimator of the common variance of the two samples. It can be calculated as follow : • Once t-test statistic value is determined, you have to read in t-test table the critical value of Student’s t distributioncorresponding to the significance level alpha of your choice (5%). The degrees of freedom (df) used in this test are : • df=n. A+n. B− 2 • If the variances of the two groups being compared are different, the Welch t test can be used.
• What is Welch t-test • The Welch t-test is an adaptation of Student’s t-test. It is used to compare the means of two groups of samples when the variances are different. • Welch t-test formula • Welch t-statistic is calculated as follow :
• Paired sample t-test • What is paired t-test ? • Paired Student’s t-test is used to compare the means of two related samples. That is when you have two values (pair of values) for the samples. • For example, 20 mice received a treatment X for 3 months. The question is to test whether the treatment X has an impact on the weight of the mice at the end of the 3 months treatment. The weight of the 20 mice has been measured before and after the treatment. This gives us 20 sets of values before treatment and 20 sets of values after treatment from measuring twice the weight of the same mice. • In this case, paired t-test can be used as the two sets of values being compared are related. We have a pair of values for each mouse (one before and the other after treatment).
• Paired t-test formula • To compare the means of the two paired sets of data, the differences between all pairs must be, first, calculated. • Let d represents the differences between all pairs. The average of the difference d is compared to 0. If there is any significant difference between the two pairs of samples, then the mean of d is expected to be far from 0. • t test statistisc value can be calculated as follow : •