
T Madas A pie chart is used to








- Slides: 62
© T Madas
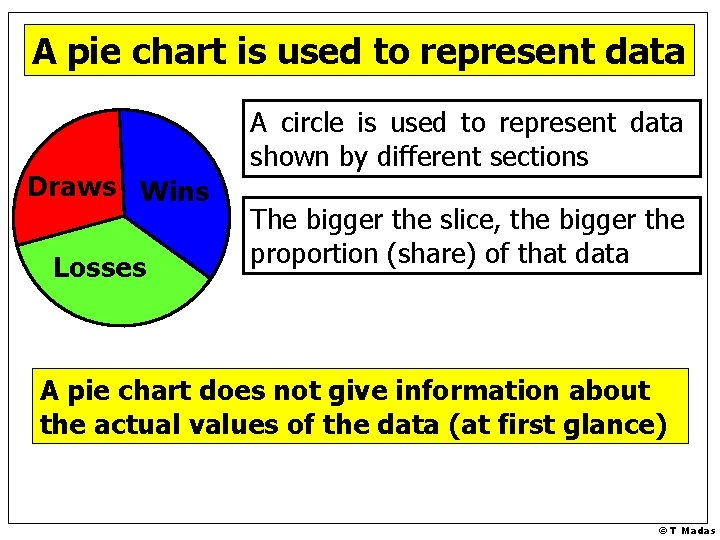
A pie chart is used to represent data Draws Wins Losses A circle is used to represent data shown by different sections The bigger the slice, the bigger the proportion (share) of that data A pie chart does not give information about the actual values of the data (at first glance) © T Madas
© T Madas
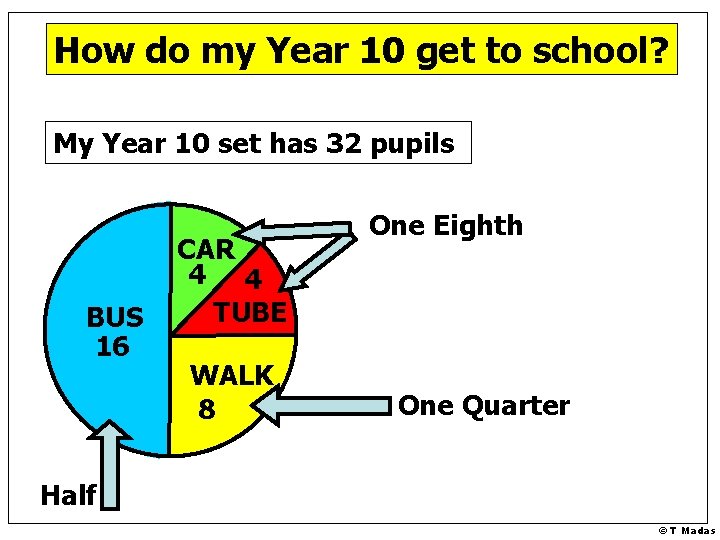
How do my Year 10 get to school? My Year 10 set has 32 pupils BUS 16 CAR 4 4 TUBE WALK 8 One Eighth One Quarter Half © T Madas
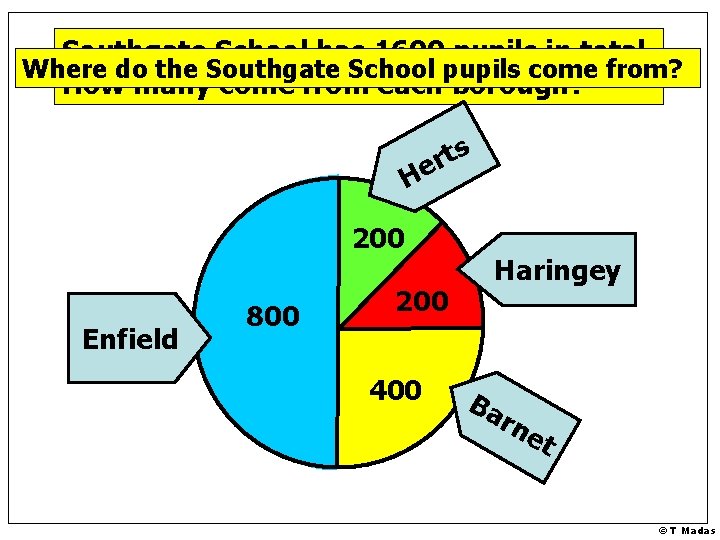
Southgate School has 1600 pupils in total. Where do the Southgate School pupils come from? How many come from each borough? s t r He 200 Enfield 800 200 400 Haringey Ba rn et © T Madas
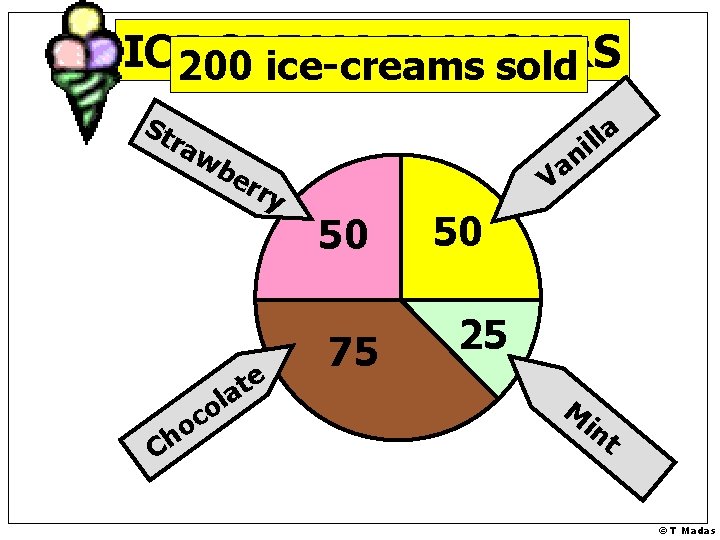
ICE CREAM FLAVOURS 200 ice-creams sold St ra wb er li la ry e t a o h C l o c n a V 50 75 50 25 M in t © T Madas
© T Madas
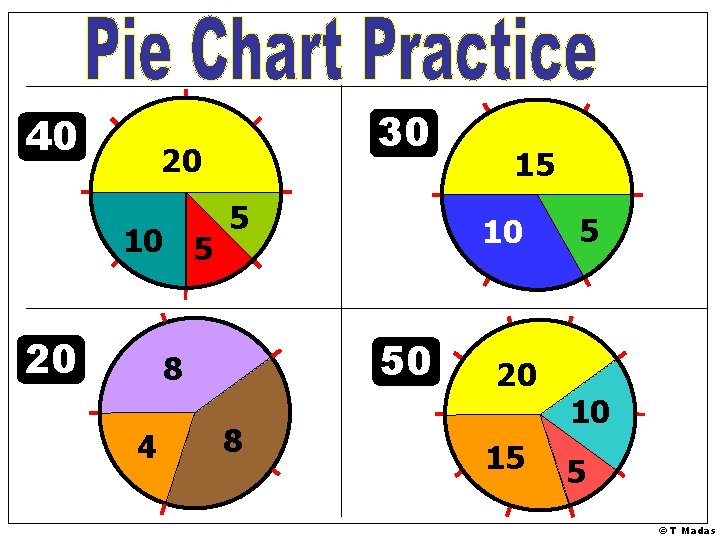
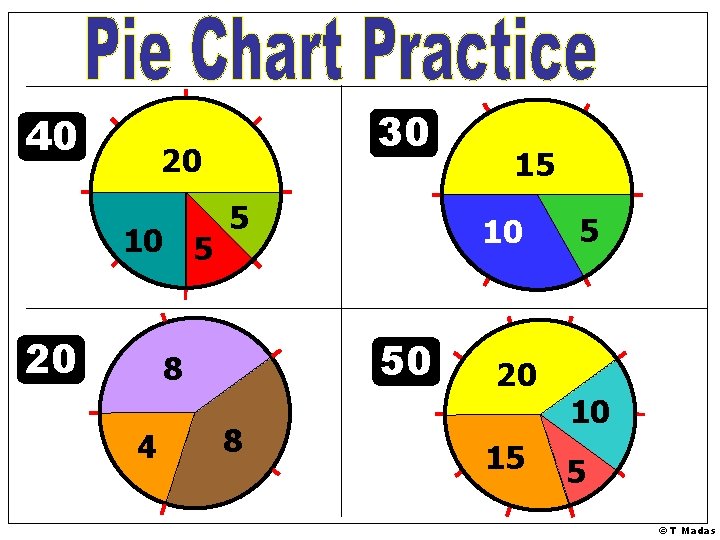
40 30 20 10 5 20 5 4 10 50 8 8 15 20 15 5 10 5 © T Madas
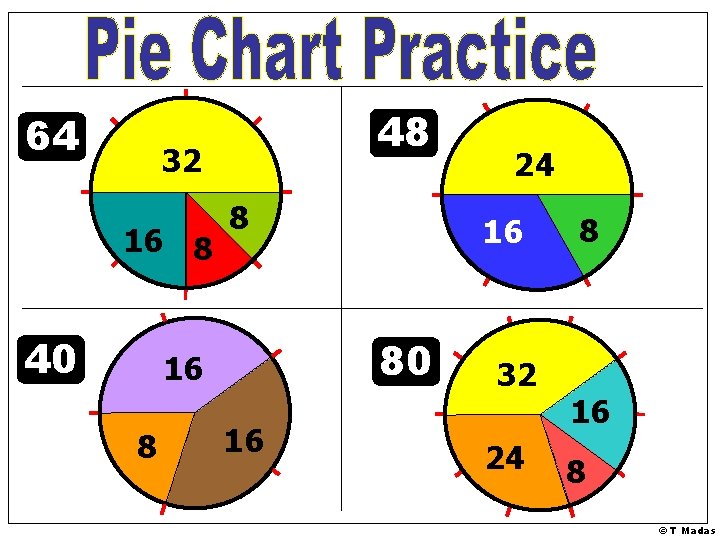
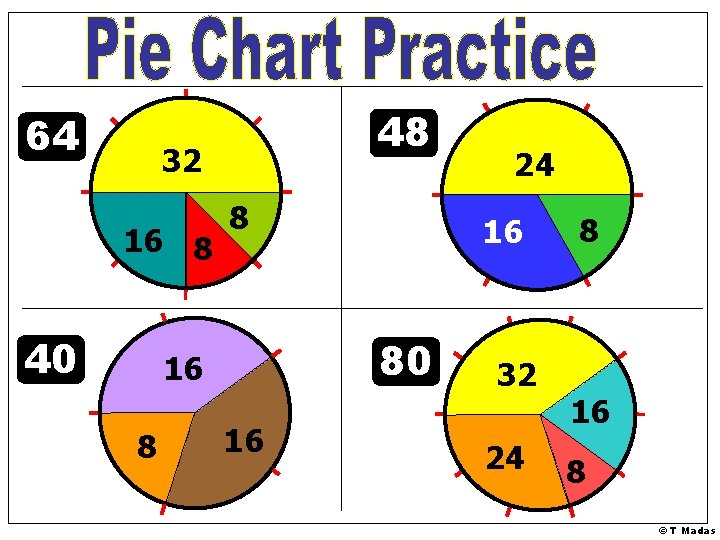
64 48 32 16 8 40 8 8 16 80 16 16 24 32 24 8 16 8 © T Madas
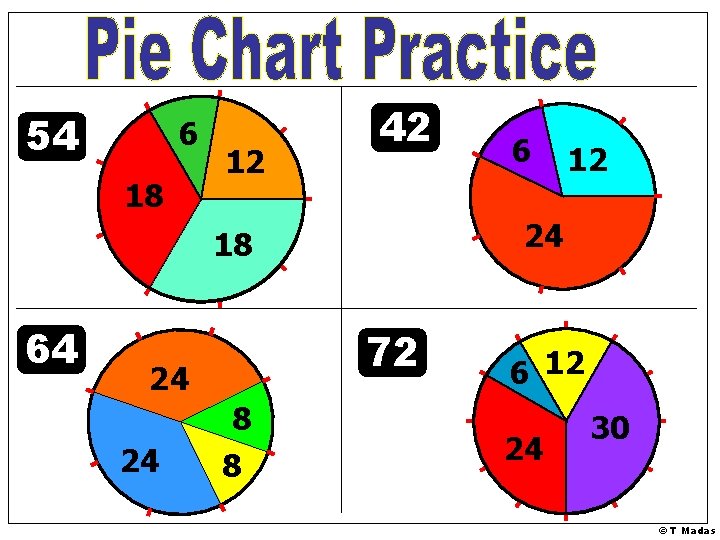
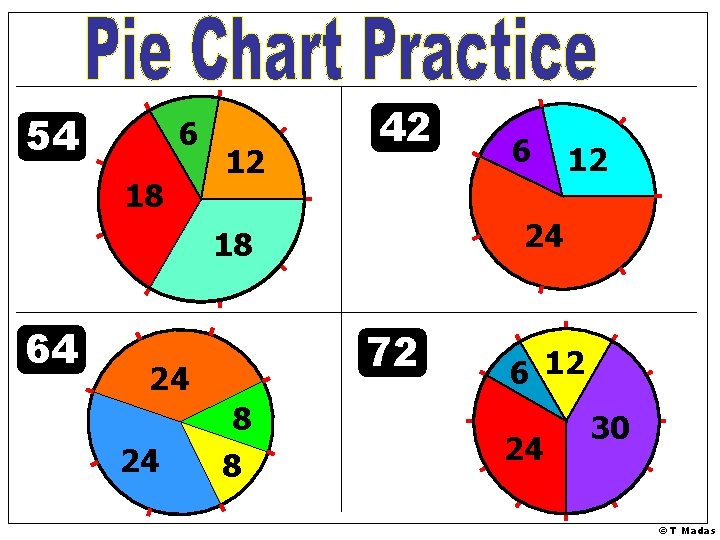
54 6 18 12 42 72 24 24 8 8 12 24 18 64 6 6 12 24 30 © T Madas
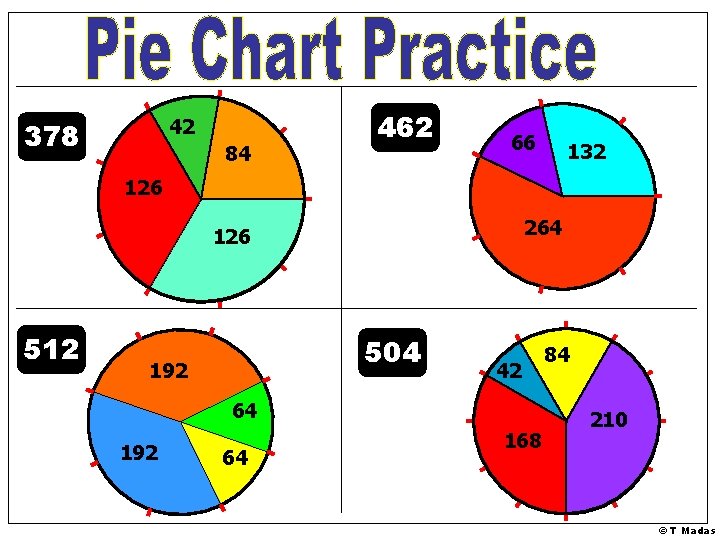
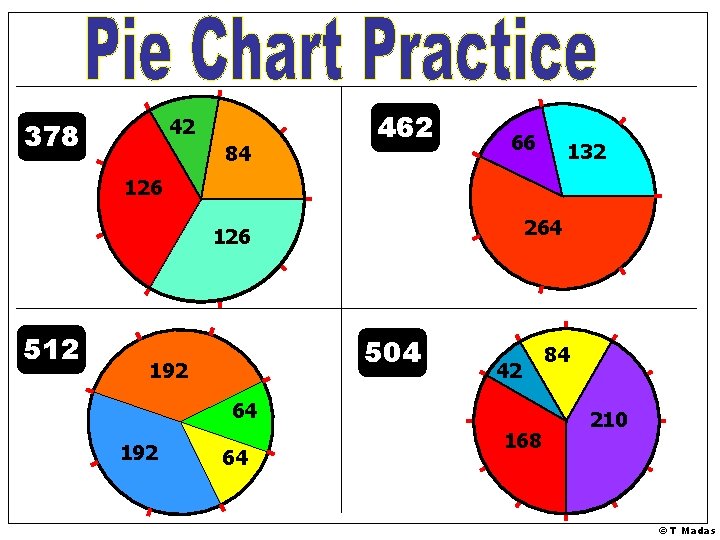
42 378 84 462 66 132 126 264 126 512 504 192 42 64 192 64 168 84 210 © T Madas
© T Madas
40 30 20 10 5 20 5 4 10 50 8 8 15 20 15 5 10 5 © T Madas
64 48 32 16 8 40 8 8 16 80 16 16 24 32 24 8 16 8 © T Madas
54 6 18 12 42 72 24 24 8 8 12 24 18 64 6 6 12 24 30 © T Madas
42 378 84 462 66 132 126 264 126 512 504 192 42 64 192 64 168 84 210 © T Madas
© T Madas
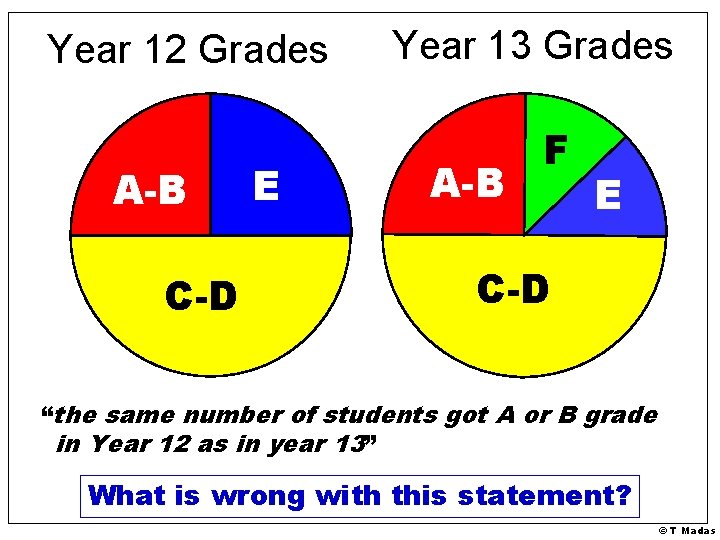
Year 12 Grades A-B C-D E Year 13 Grades A-B F E C-D “the same number of students got A or B grade in Year 12 as in year 13” What is wrong with this statement? © T Madas
Another Example © T Madas
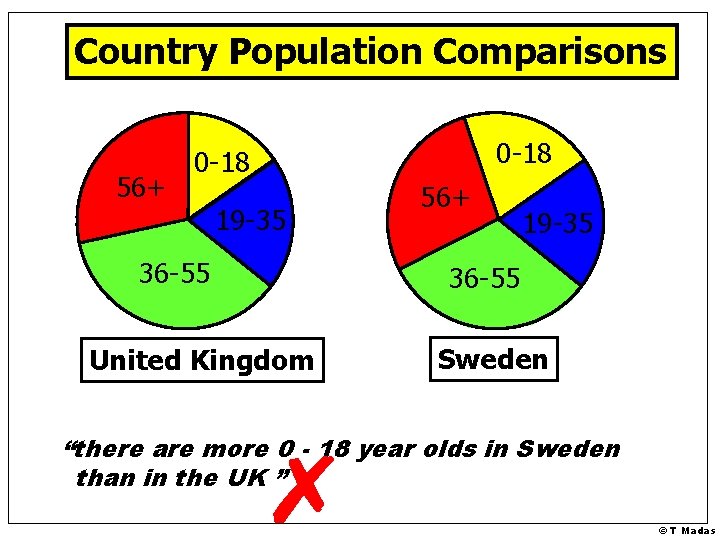
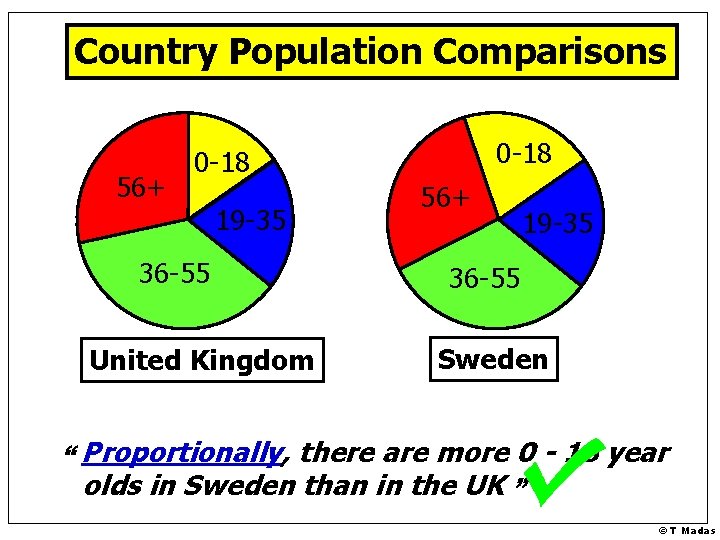
Country Population Comparisons 56+ 0 -18 19 -35 36 -55 United Kingdom 56+ 19 -35 36 -55 Sweden “there are more 0 - 18 year olds in Sweden than in the UK ” © T Madas
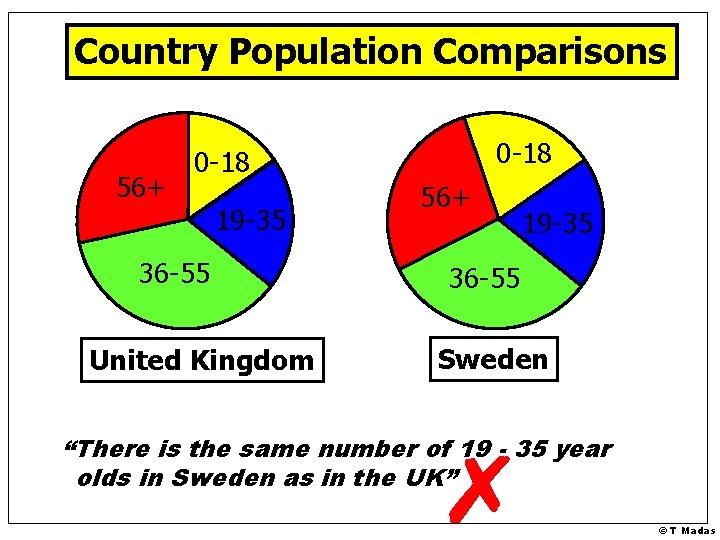
Country Population Comparisons 56+ 0 -18 19 -35 36 -55 United Kingdom 56+ 19 -35 36 -55 Sweden “There is the same number of 19 - 35 year olds in Sweden as in the UK” © T Madas
Country Population Comparisons 56+ 0 -18 19 -35 36 -55 United Kingdom 56+ 19 -35 36 -55 Sweden “ Proportionally, there are more 0 - 18 year olds in Sweden than in the UK ” © T Madas
© T Madas
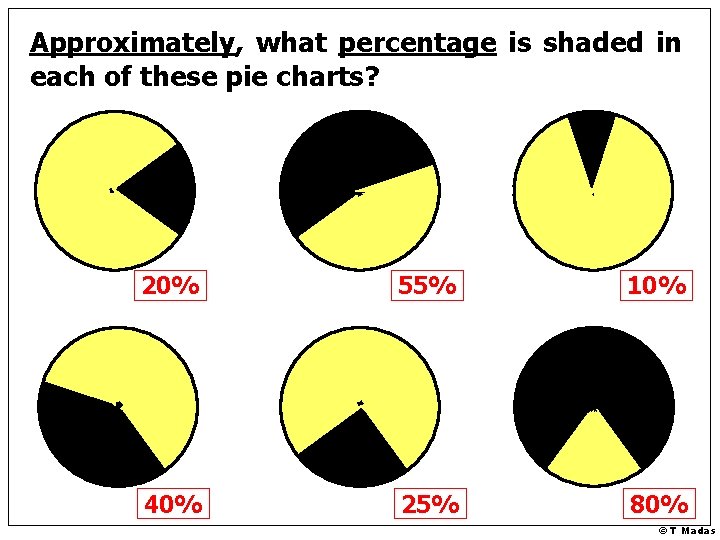
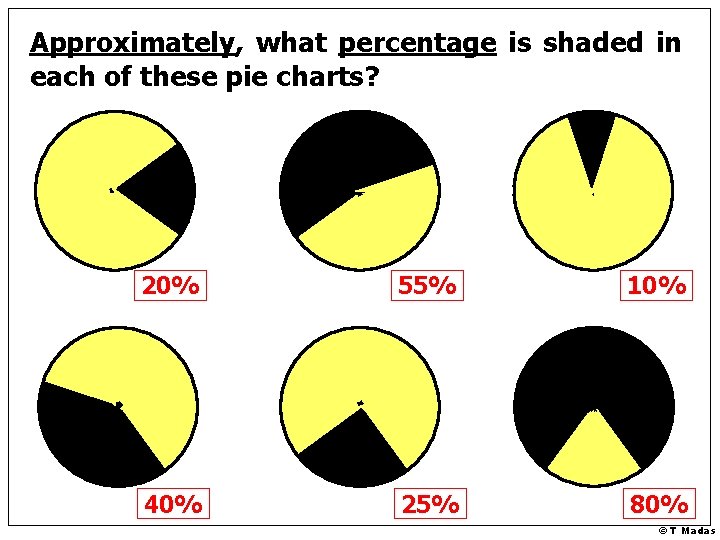
Approximately, what percentage is shaded in each of these pie charts? 20% 55% 10% 40% 25% 80% © T Madas
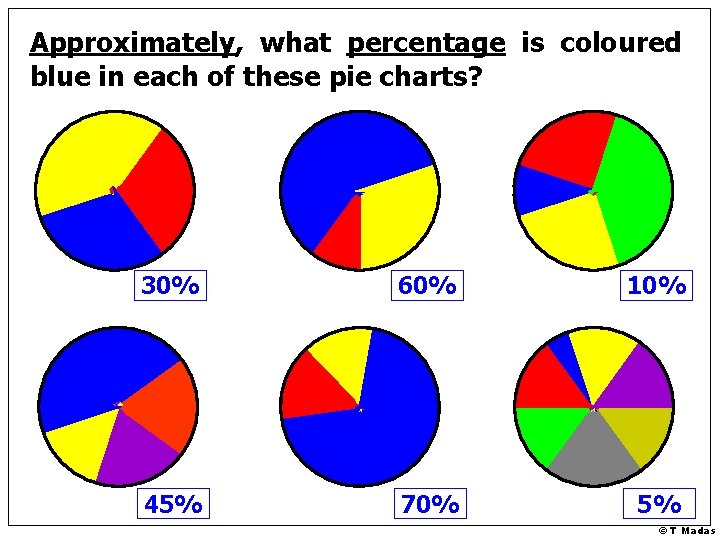
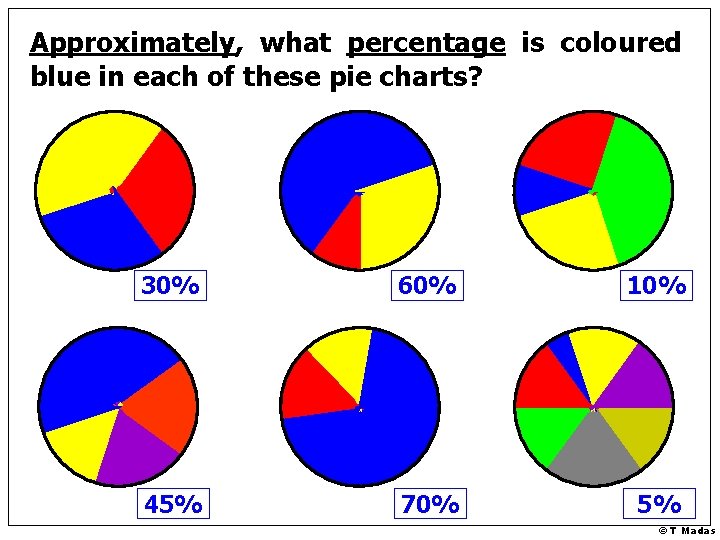
Approximately, what percentage is coloured blue in each of these pie charts? 30% 60% 10% 45% 70% 5% © T Madas
© T Madas
Approximately, what percentage is shaded in each of these pie charts? 20% 55% 10% 40% 25% 80% © T Madas
Approximately, what percentage is coloured blue in each of these pie charts? 30% 60% 10% 45% 70% 5% © T Madas
© T Madas
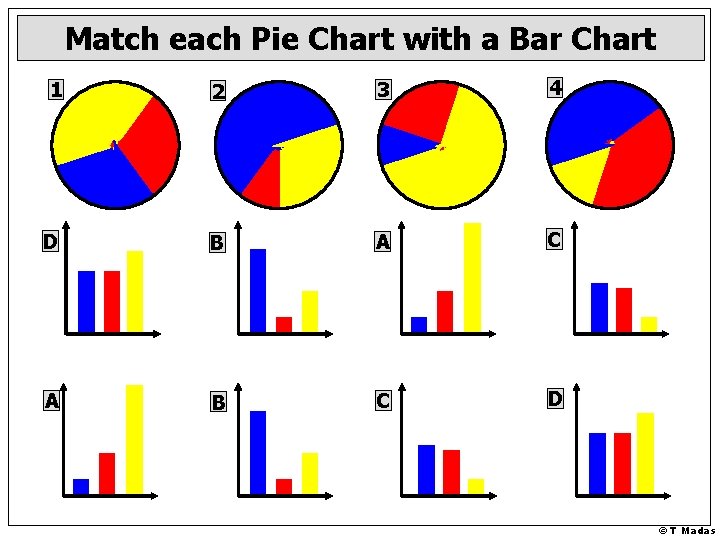
Match each Pie Chart with a Bar Chart 1 2 3 4 D B A C A B C D © T Madas
© T Madas
Match each Pie Chart with its table of Data 1 2 3 Data A Data B Data C Blue 30 Blue 720 Red 75 Red 30 Red 640 Yellow 195 Yellow 40 Yellow 240 3 1 4 4 Data D Blue 30 Red 5 Yellow 15 2 © T Madas
© T Madas
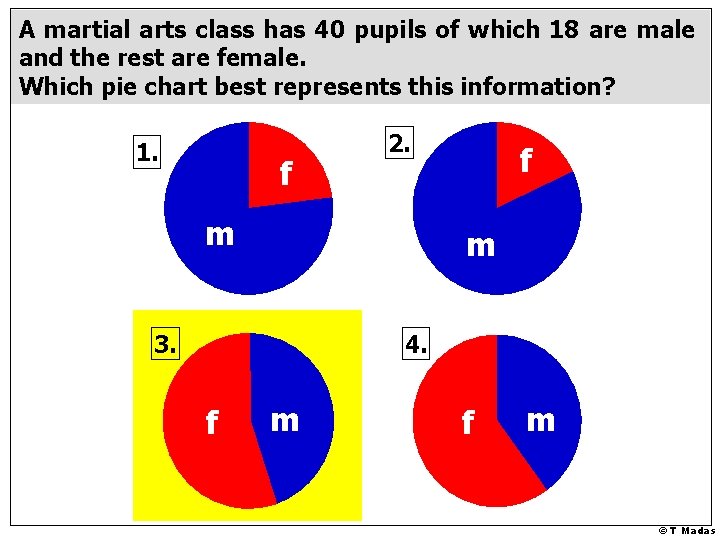
A martial arts class has 40 pupils of which 18 are male and the rest are female. Which pie chart best represents this information? 1. f 2. m f m 3. 4. f m © T Madas
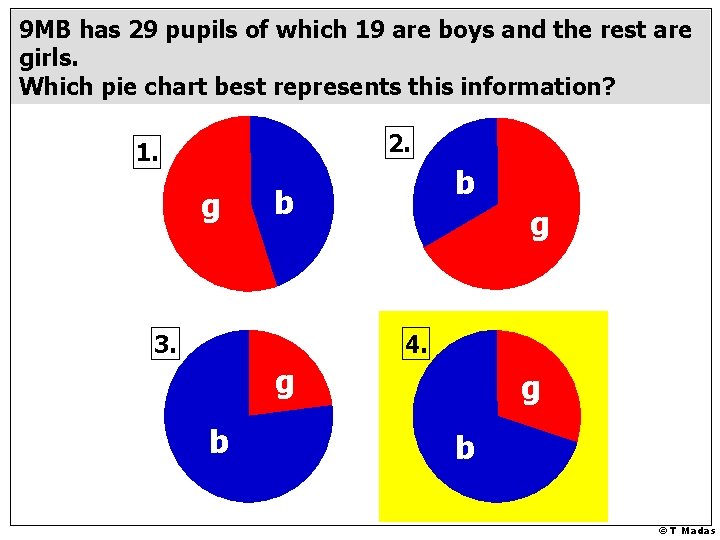
9 MB has 29 pupils of which 19 are boys and the rest are girls. Which pie chart best represents this information? 2. 1. g b b 3. g 4. g b © T Madas
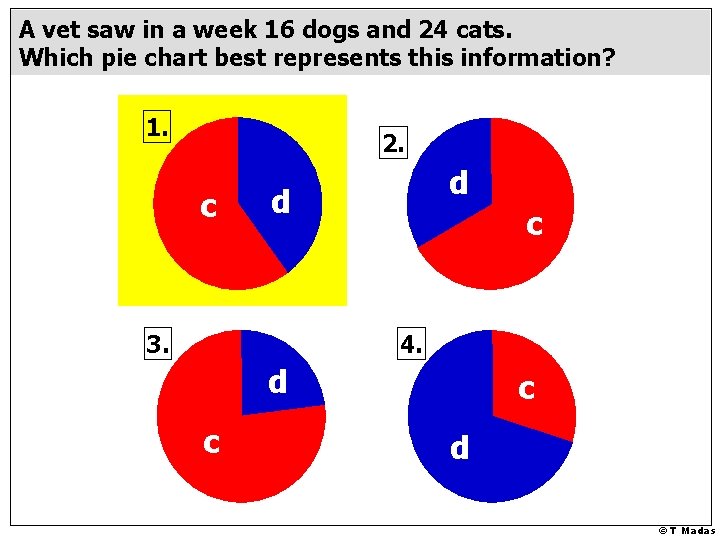
A vet saw in a week 16 dogs and 24 cats. Which pie chart best represents this information? 1. 2. c d d 3. c 4. d c c d © T Madas
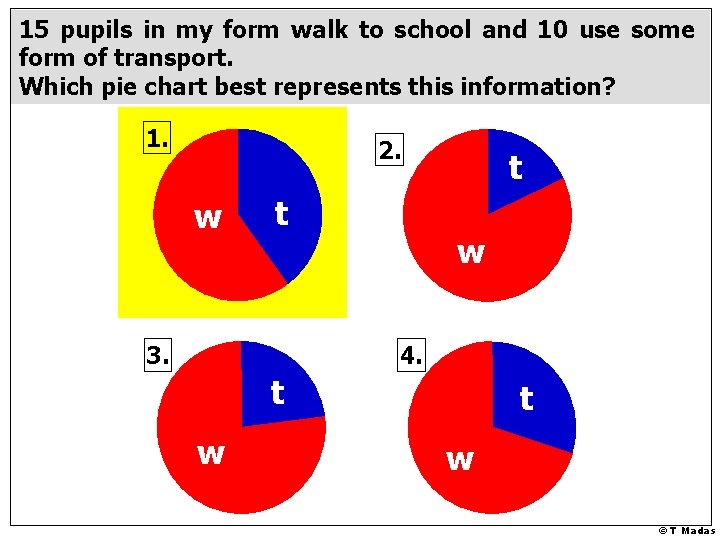
15 pupils in my form walk to school and 10 use some form of transport. Which pie chart best represents this information? 1. 2. w t 3. t w 4. t w © T Madas
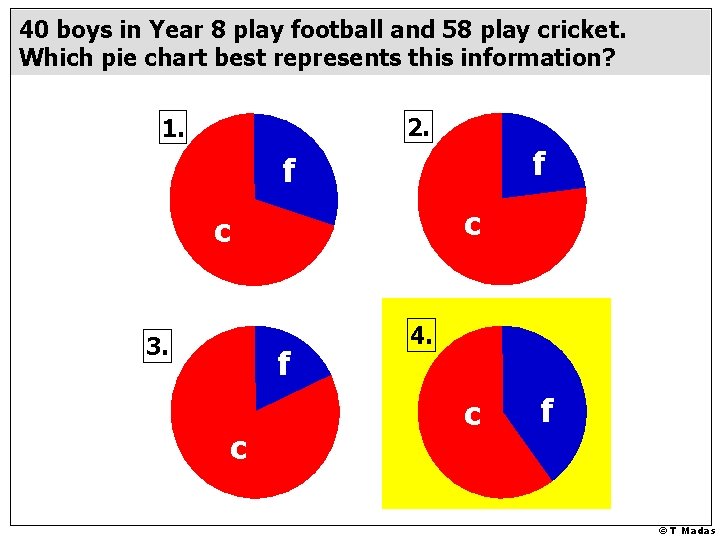
40 boys in Year 8 play football and 58 play cricket. Which pie chart best represents this information? 2. 1. f f c c 3. f c 4. c f © T Madas
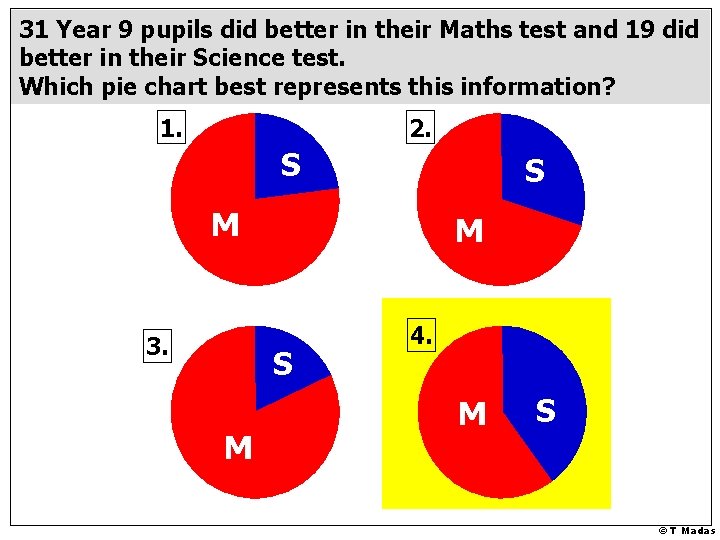
31 Year 9 pupils did better in their Maths test and 19 did better in their Science test. Which pie chart best represents this information? 1. 2. S S M 3. M S M 4. M S © T Madas
© T Madas
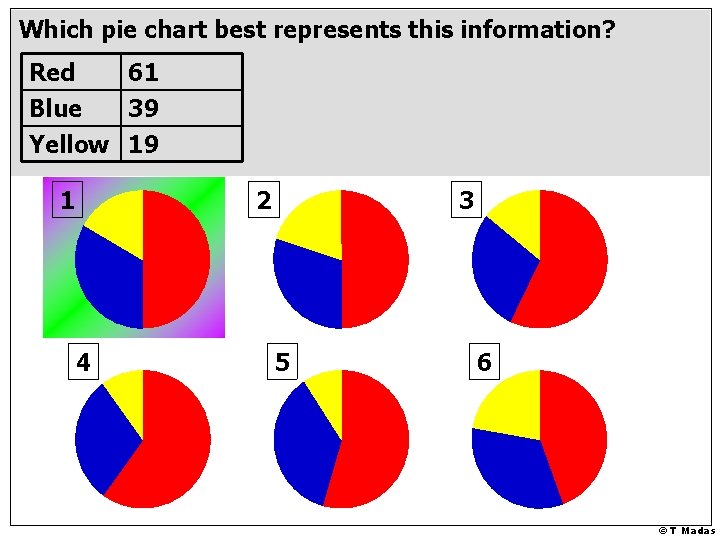
Which pie chart best represents this information? Red 61 Blue 39 Yellow 19 1 2 4 3 5 6 © T Madas
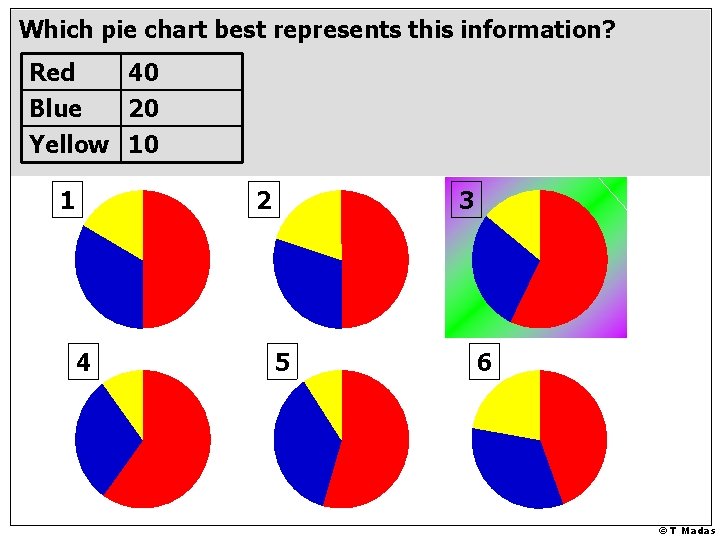
Which pie chart best represents this information? Red 40 Blue 20 Yellow 10 1 2 4 3 5 6 © T Madas
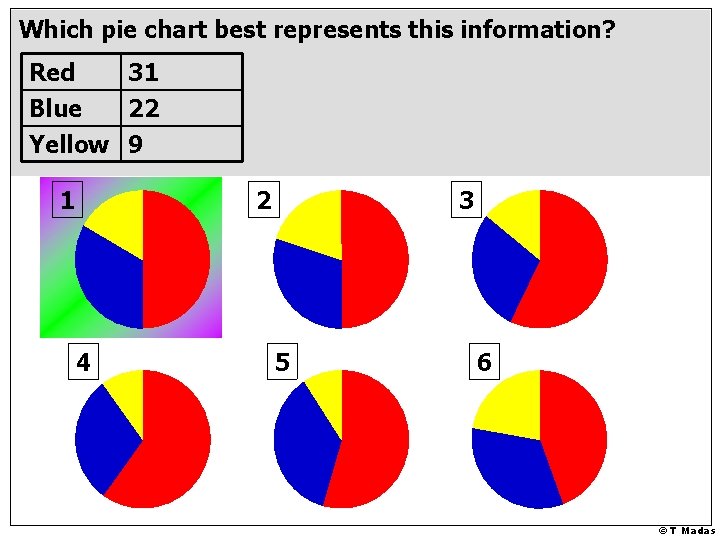
Which pie chart best represents this information? Red 31 Blue 22 Yellow 9 1 2 4 3 5 6 © T Madas
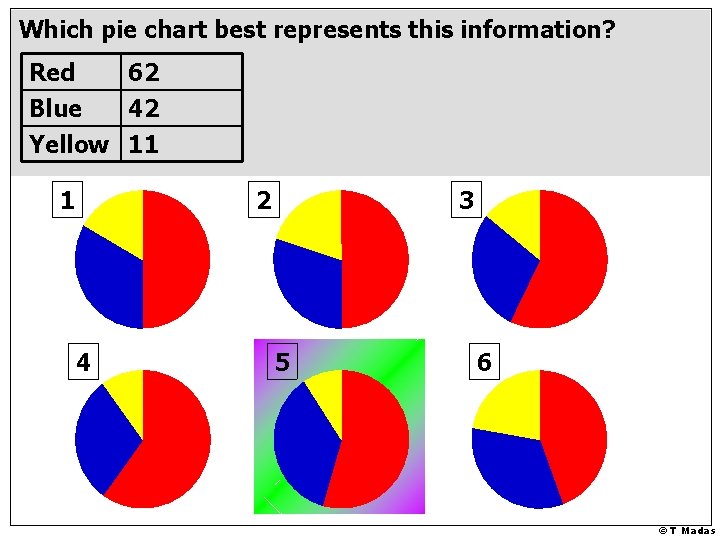
Which pie chart best represents this information? Red 62 Blue 42 Yellow 11 1 2 4 3 5 6 © T Madas
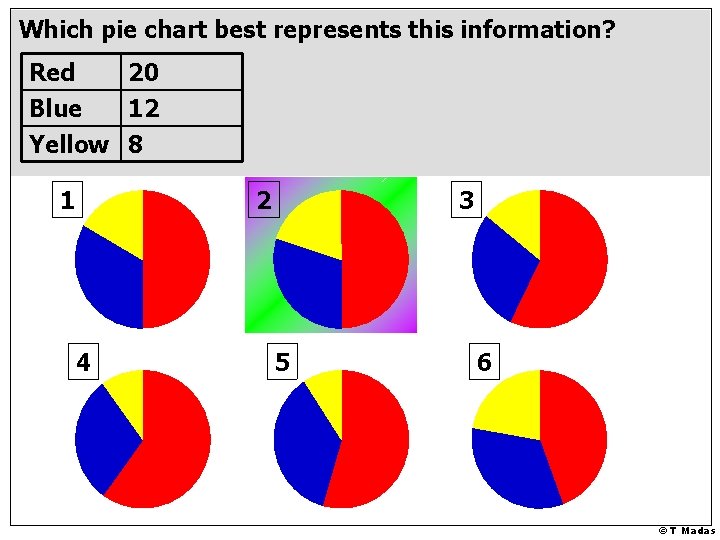
Which pie chart best represents this information? Red 20 Blue 12 Yellow 8 1 2 4 3 5 6 © T Madas
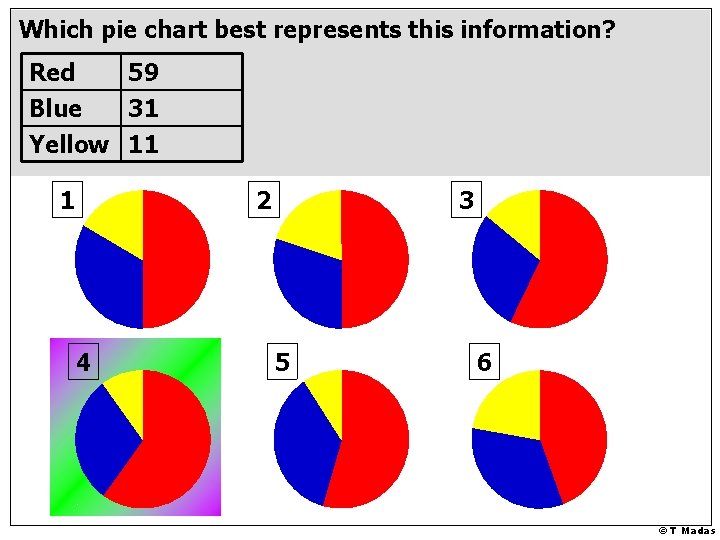
Which pie chart best represents this information? Red 59 Blue 31 Yellow 11 1 2 4 3 5 6 © T Madas
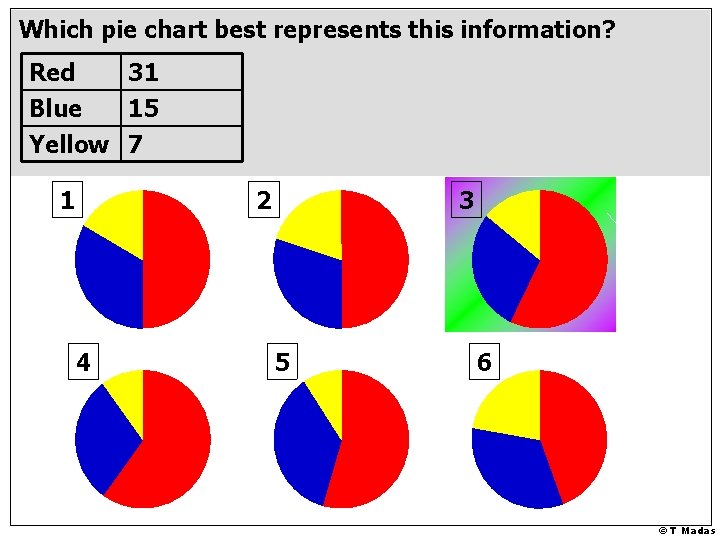
Which pie chart best represents this information? Red 31 Blue 15 Yellow 7 1 2 4 3 5 6 © T Madas
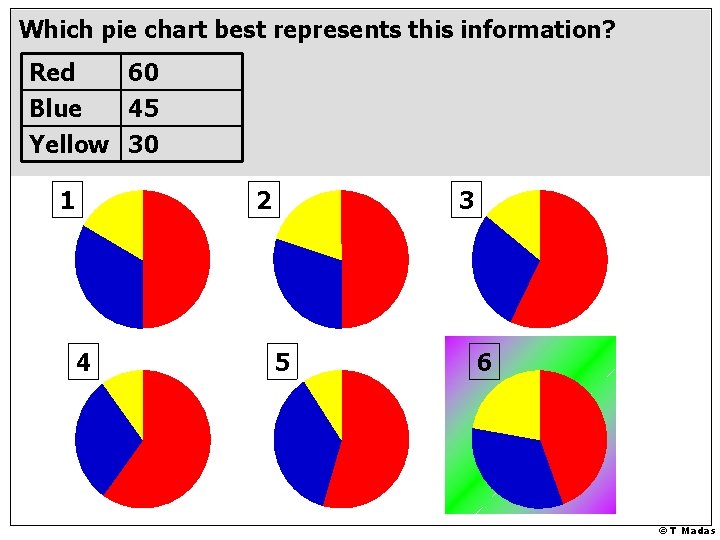
Which pie chart best represents this information? Red 60 Blue 45 Yellow 30 1 2 4 3 5 6 © T Madas
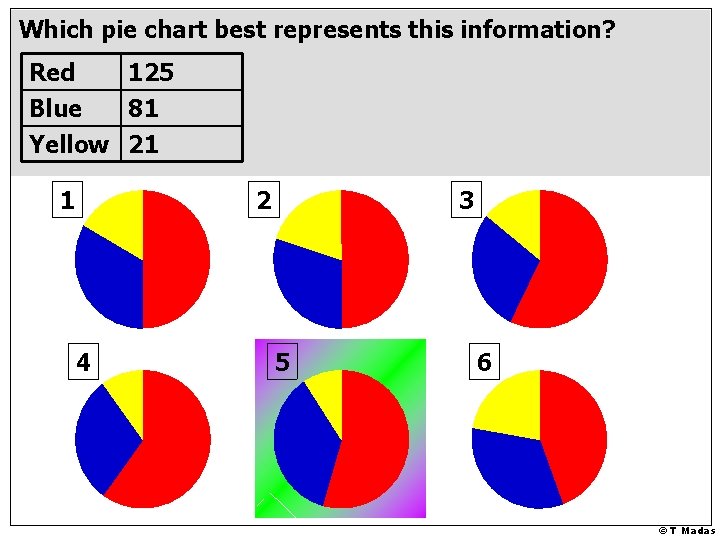
Which pie chart best represents this information? Red 125 Blue 81 Yellow 21 1 2 4 3 5 6 © T Madas
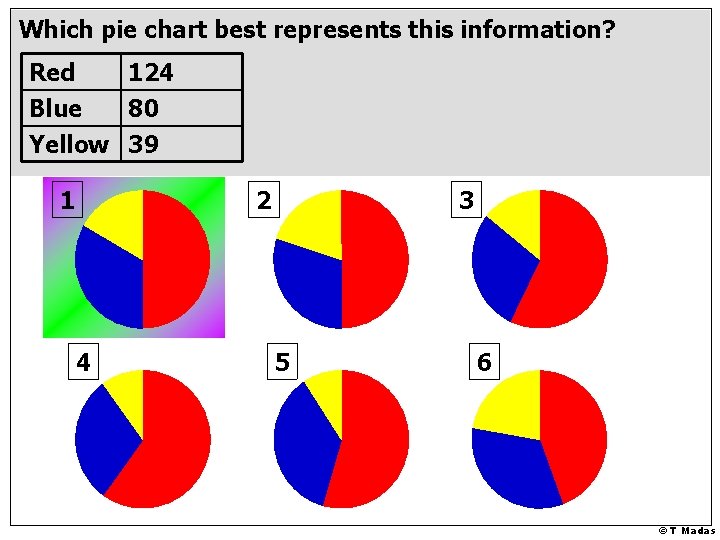
Which pie chart best represents this information? Red 124 Blue 80 Yellow 39 1 2 4 3 5 6 © T Madas
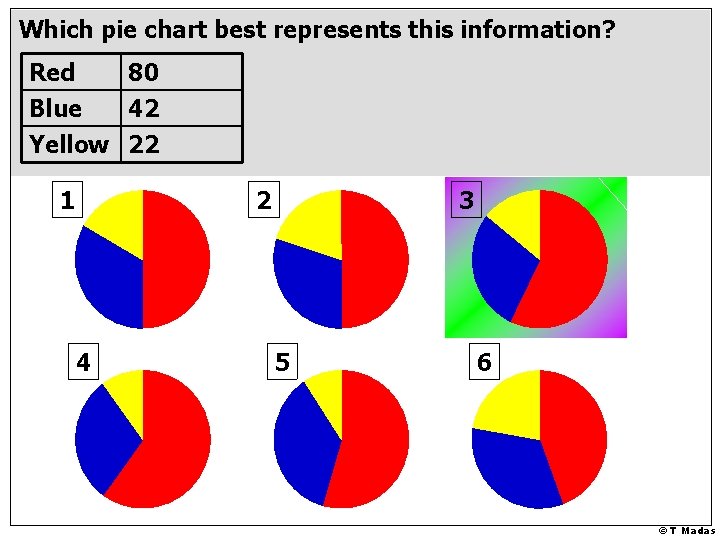
Which pie chart best represents this information? Red 80 Blue 42 Yellow 22 1 2 4 3 5 6 © T Madas
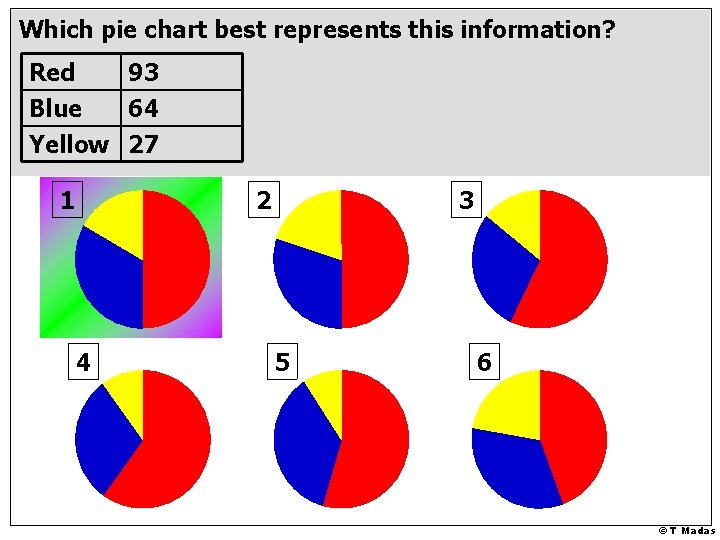
Which pie chart best represents this information? Red 93 Blue 64 Yellow 27 1 2 4 3 5 6 © T Madas
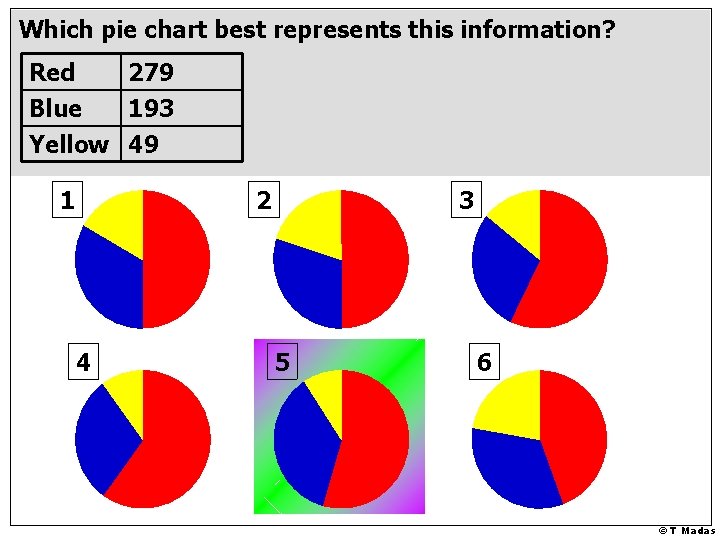
Which pie chart best represents this information? Red 279 Blue 193 Yellow 49 1 2 4 3 5 6 © T Madas
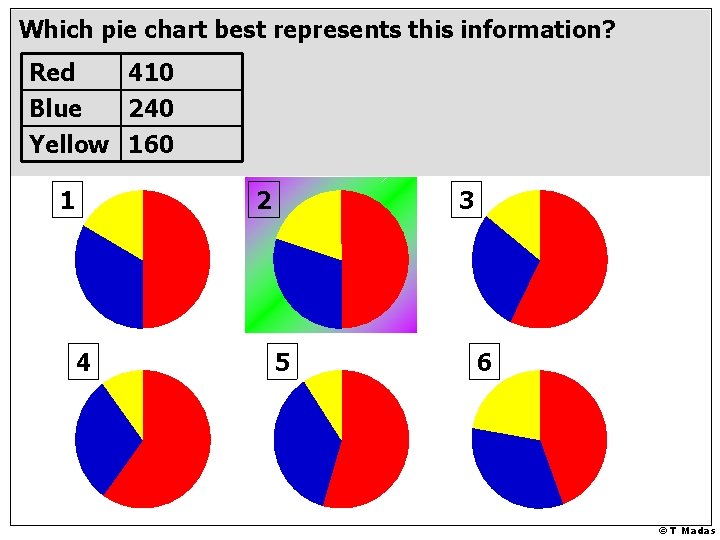
Which pie chart best represents this information? Red 410 Blue 240 Yellow 160 1 2 4 3 5 6 © T Madas
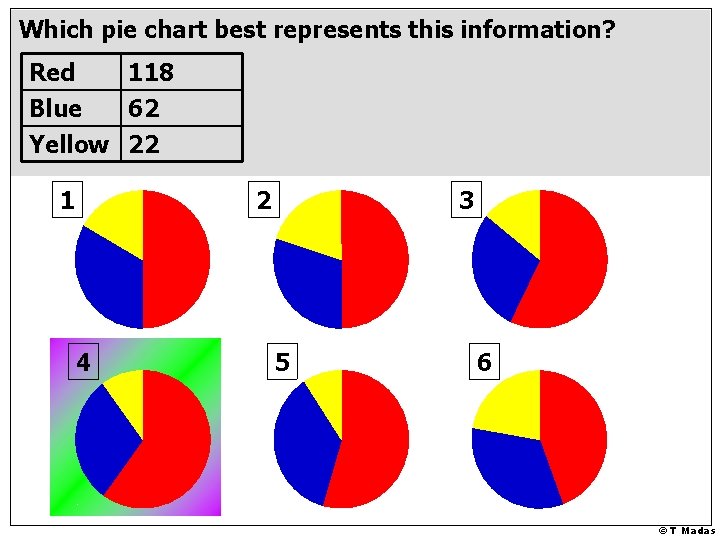
Which pie chart best represents this information? Red 118 Blue 62 Yellow 22 1 2 4 3 5 6 © T Madas
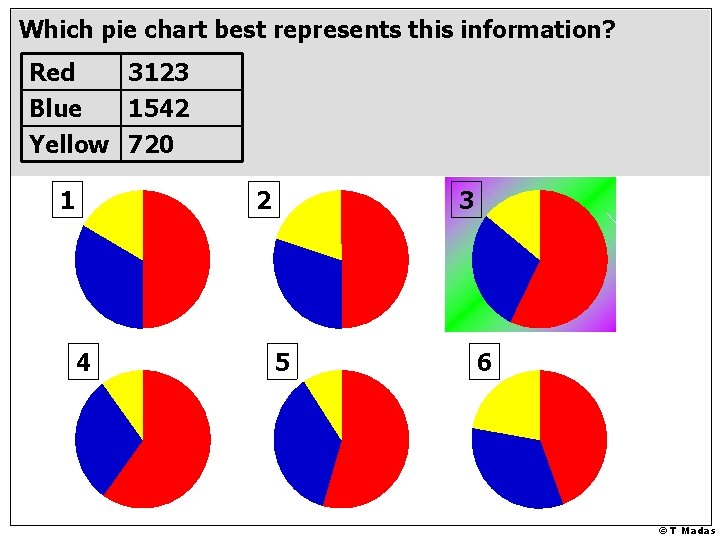
Which pie chart best represents this information? Red 3123 Blue 1542 Yellow 720 1 2 4 3 5 6 © T Madas
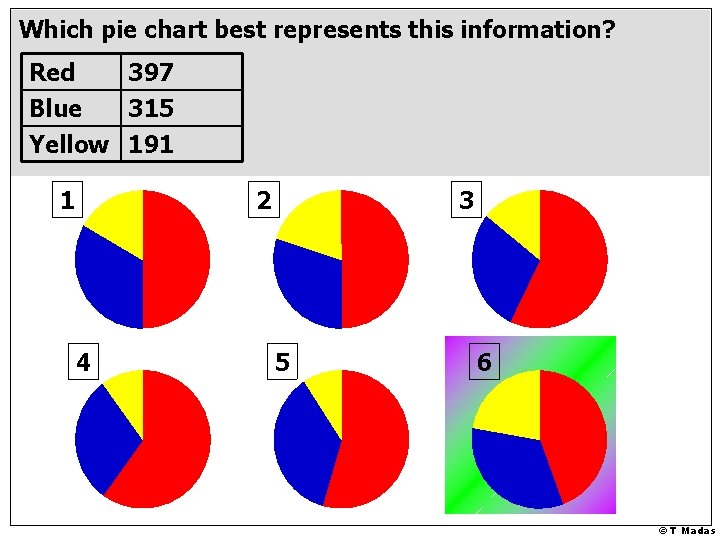
Which pie chart best represents this information? Red 397 Blue 315 Yellow 191 1 2 4 3 5 6 © T Madas
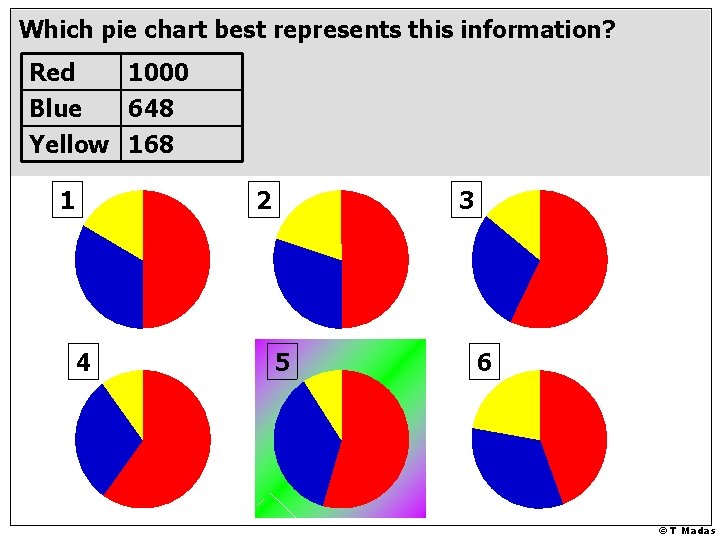
Which pie chart best represents this information? Red 1000 Blue 648 Yellow 168 1 2 4 3 5 6 © T Madas
© T Madas
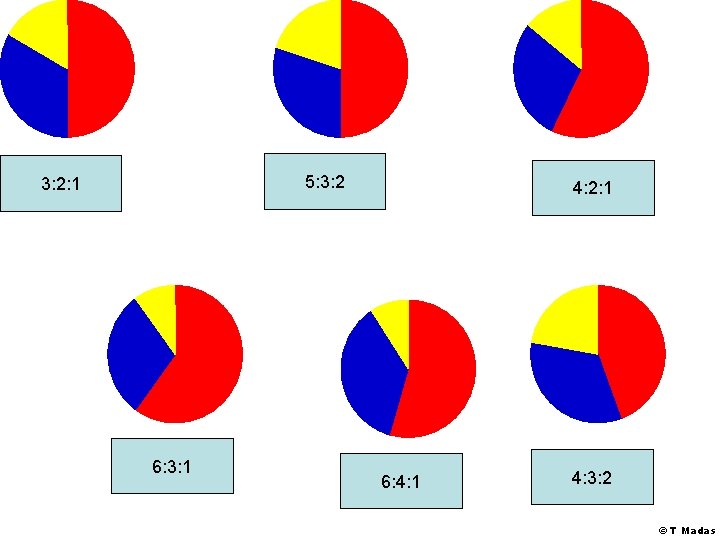
5: 3: 2: 1 6: 3: 1 4: 2: 1 6: 4: 1 4: 3: 2 © T Madas
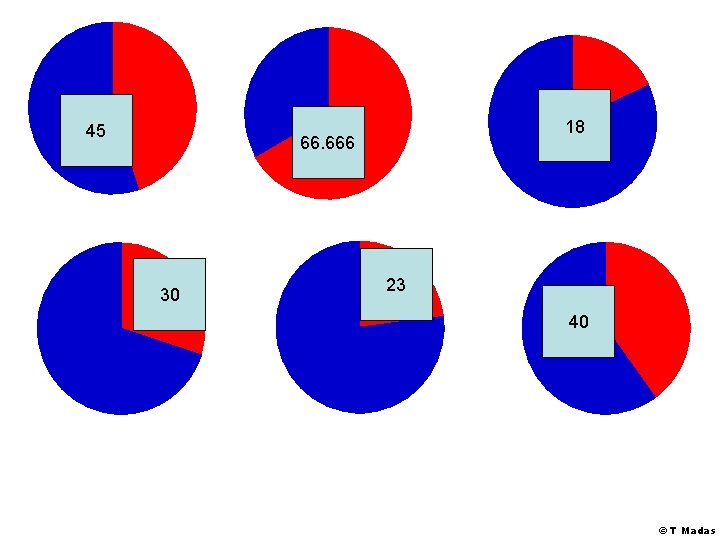
45 18 66. 666 30 23 40 © T Madas
© T Madas