
T Futamase Kyoto Sangyo University 22 nd Dec
- Slides: 51
Review of Gravitational Lensing: T. Futamase, Kyoto Sangyo University 22 nd Dec. 2016 @ Sendai Collaborator: many
Context • • History of GL after 1979 Present Status Some ongoing works Future
History of GL research after the discovery of first Lensing event • 1979 QSO 0957+561 A, B, Walsh et al • 1984 time delay in QSO 0957+561 Hubble parameter dependence was pointed out by Refsdal in 1964 • 1984 Lens Statistics Turner, Ostriker & Gott • 1986 Giant Luminous Arc in Abel 370 • ~1986 MACHO search by Microlensing, Paczynaki • 1988 Einstein ring predicted in 1924 by Chwolson • 1990 Weak Lensing in Abel 1689, CL 1409+53 Tyson concept of WL was mentioned in ~1970 by Feynman • 2000 Cosmic Shear • 2006 Discovery of extrasolar planet by microlensing • 2009 Discovery of GRAMOR in MACS J 1149. 5+2223 predicted in 1998
Present Status of GL research • Almost all ideas are already known by 1980 s and 1990 s • New data using new instruments and new surveys • More refinements of theory, in particular weak lensing
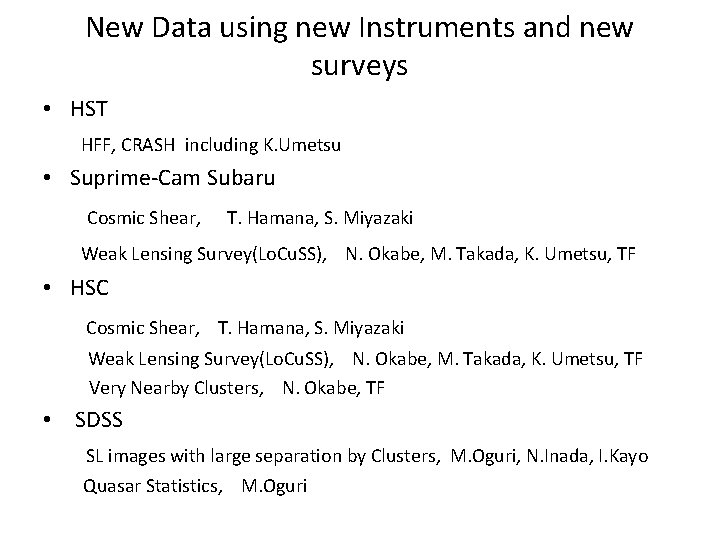
New Data using new Instruments and new surveys • HST HFF, CRASH including K. Umetsu • Suprime-Cam Subaru Cosmic Shear, T. Hamana, S. Miyazaki Weak Lensing Survey(Lo. Cu. SS), N. Okabe, M. Takada, K. Umetsu, TF • HSC Cosmic Shear, T. Hamana, S. Miyazaki Weak Lensing Survey(Lo. Cu. SS), N. Okabe, M. Takada, K. Umetsu, TF Very Nearby Clusters, N. Okabe, TF • SDSS SL images with large separation by Clusters, M. Oguri, N. Inada, I. Kayo Quasar Statistics, M. Oguri
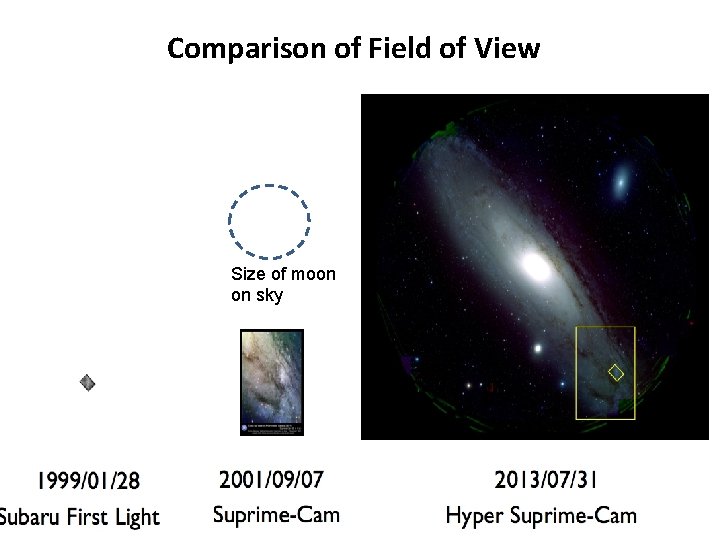
Comparison of Field of View Size of moon on sky
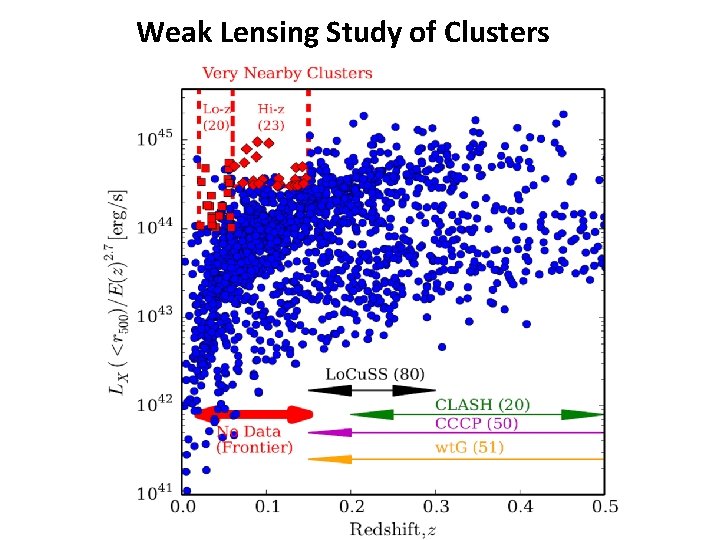
Weak Lensing Study of Clusters
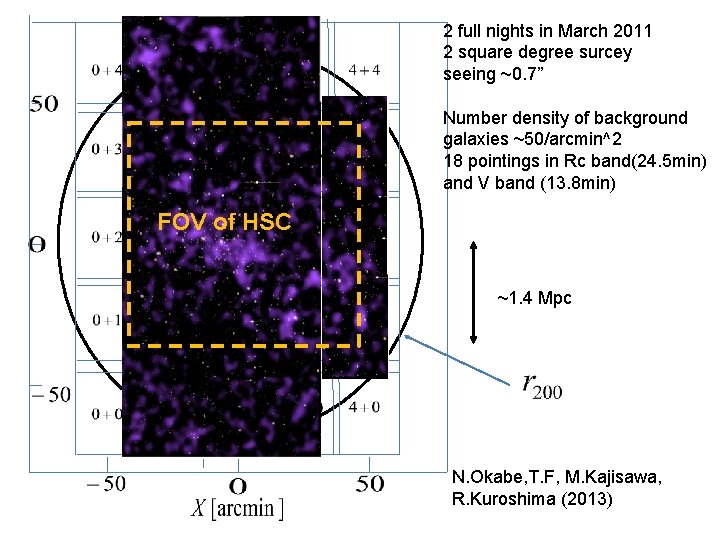
2 full nights in March 2011 2 square degree surcey seeing ~0. 7” Number density of background galaxies ~50/arcmin^2 18 pointings in Rc band(24. 5 min) and V band (13. 8 min) FOV of HSC ~1. 4 Mpc N. Okabe, T. F, M. Kajisawa, R. Kuroshima (2013)
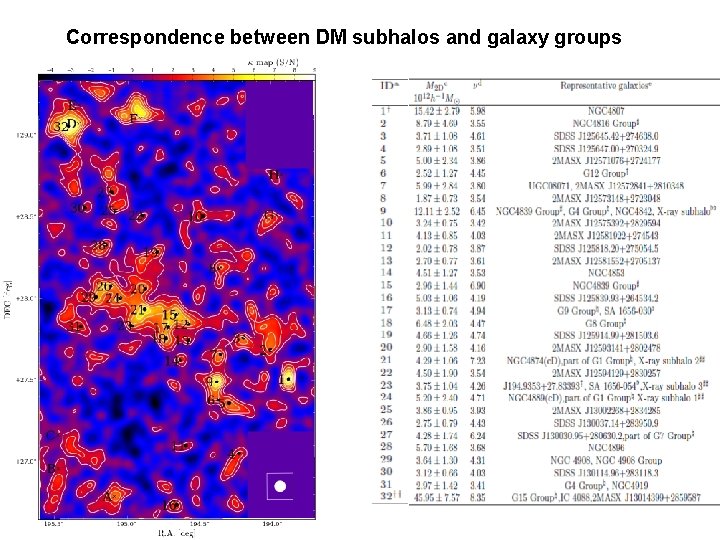
Correspondence between DM subhalos and galaxy groups
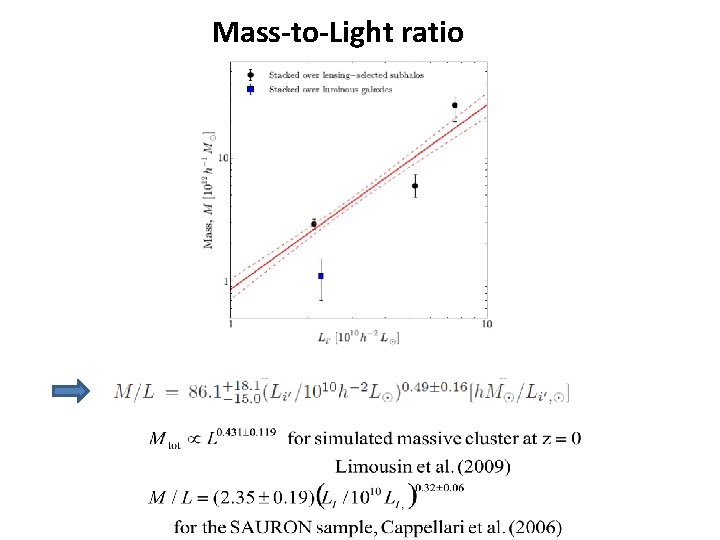
Mass-to-Light ratio
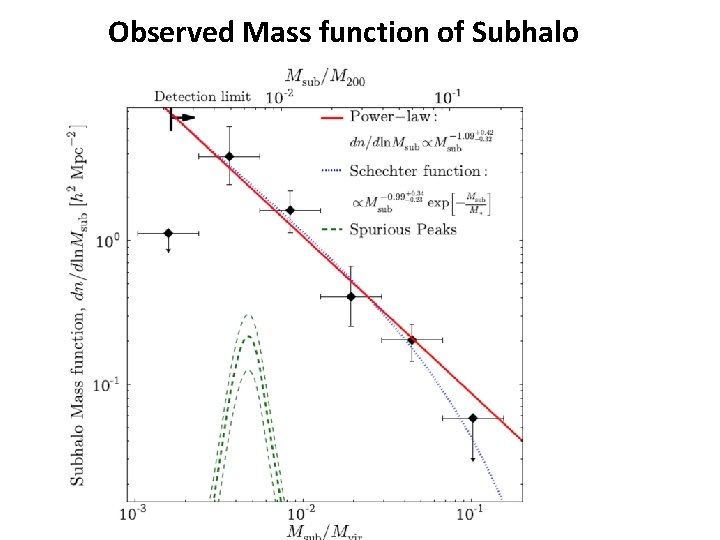
Observed Mass function of Subhalo
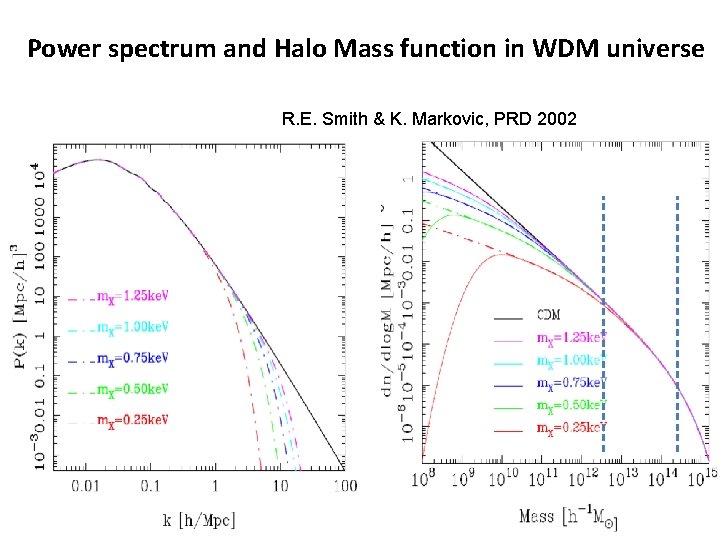
Power spectrum and Halo Mass function in WDM universe R. E. Smith & K. Markovic, PRD 2002
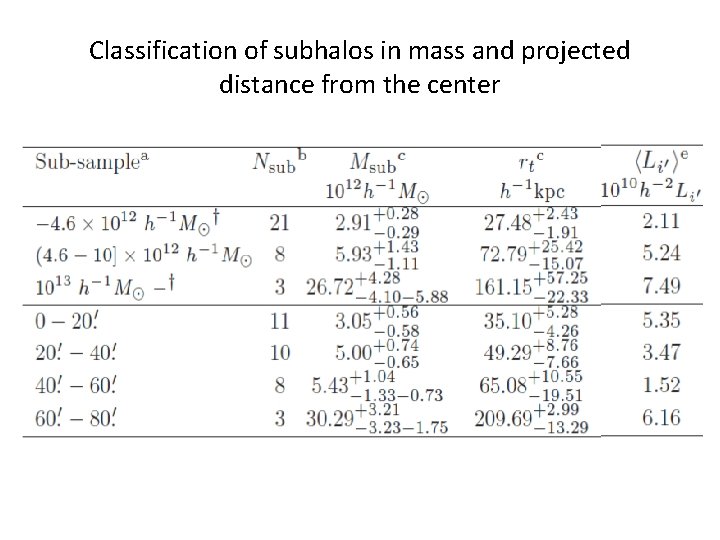
Classification of subhalos in mass and projected distance from the center
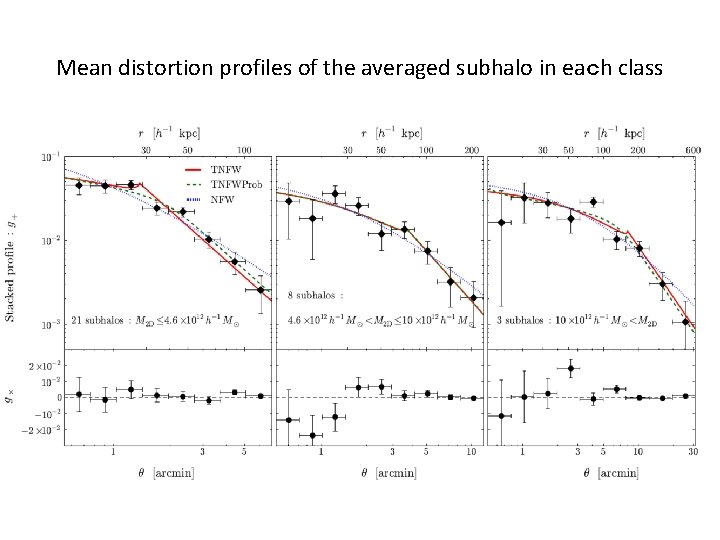
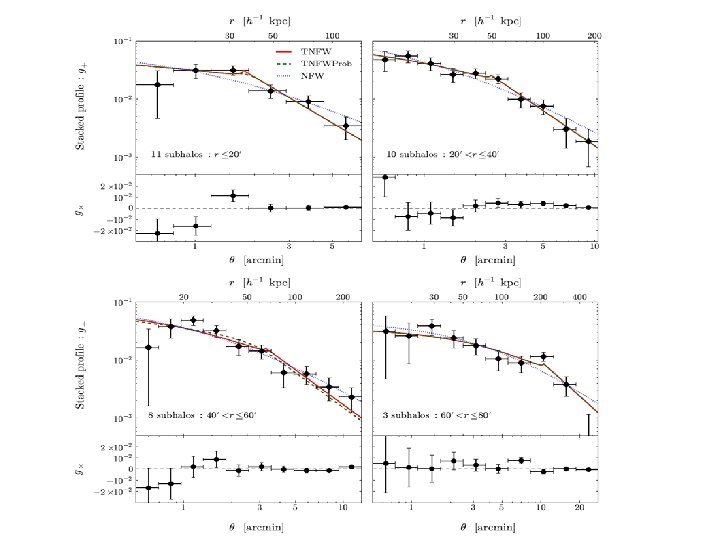
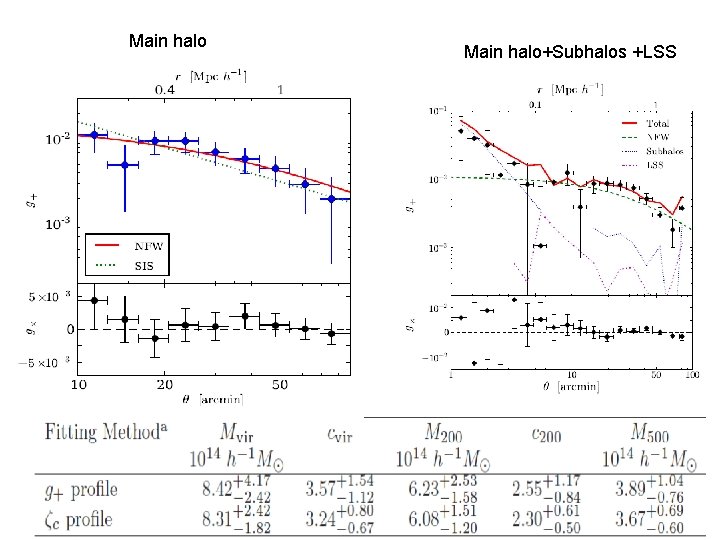
Mean distortion profiles of the averaged subhalo in each class
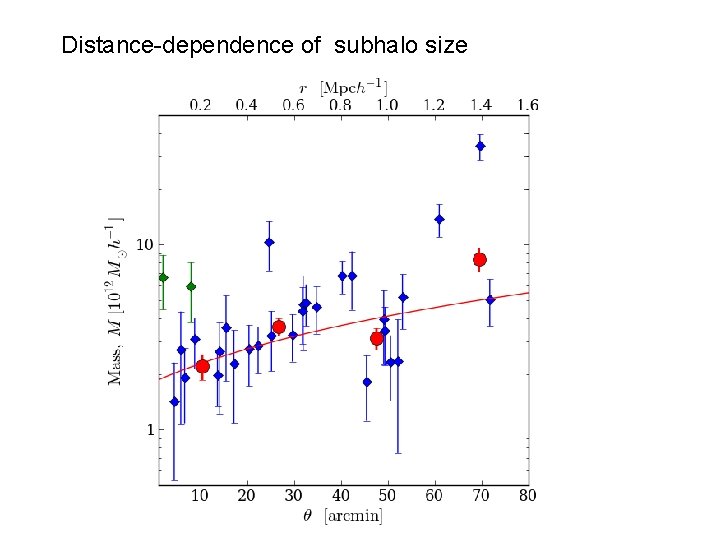
Distance-dependence of subhalo size
Main halo+Subhalos +LSS
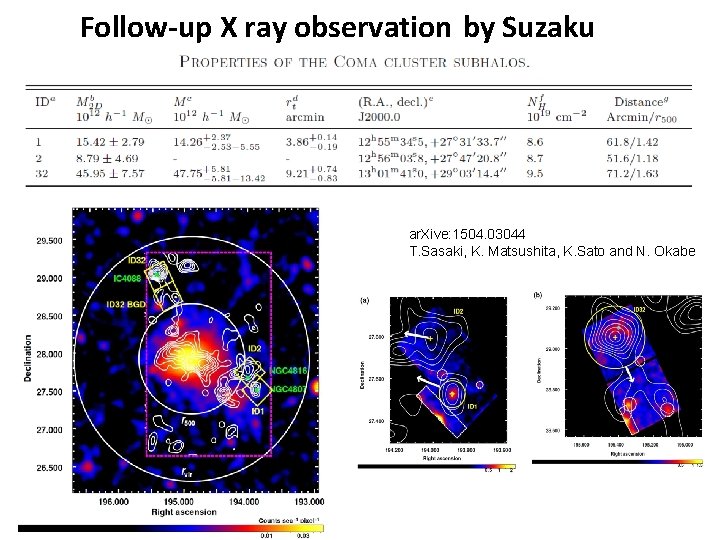
Follow-up X ray observation by Suzaku ar. Xive: 1504. 03044 T. Sasaki, K. Matsushita, K. Sato and N. Okabe
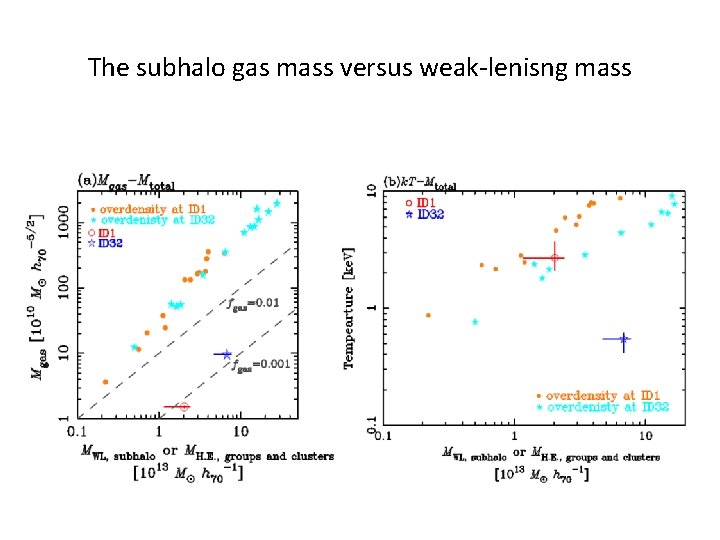
The subhalo gas mass versus weak-lenisng mass
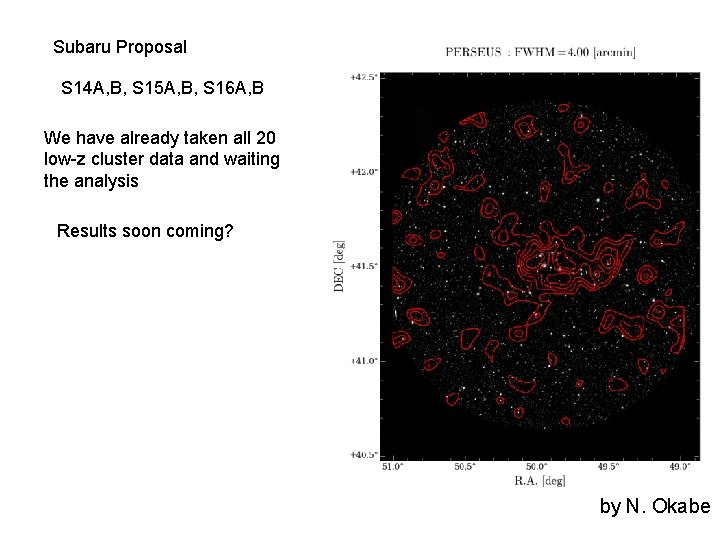
Subaru Proposal S 14 A, B, S 15 A, B, S 16 A, B We have already taken all 20 low-z cluster data and waiting the analysis Results soon coming? by N. Okabe
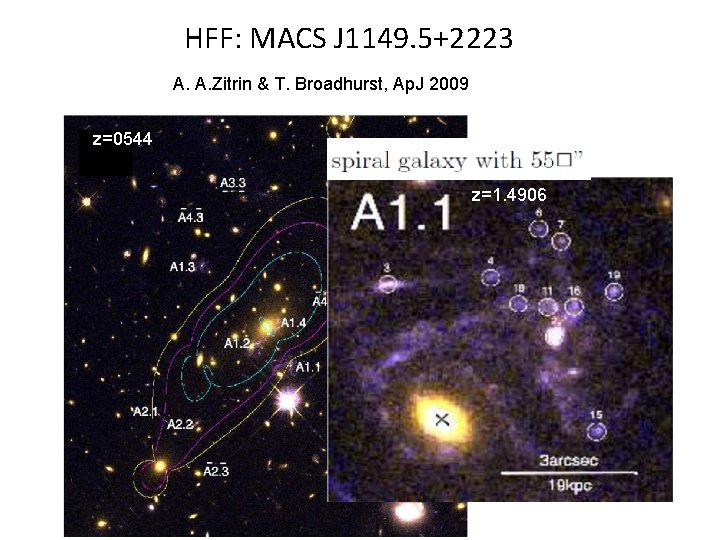
HFF: MACS J 1149. 5+2223 A. A. Zitrin & T. Broadhurst, Ap. J 2009 z=0544 z=1. 4906
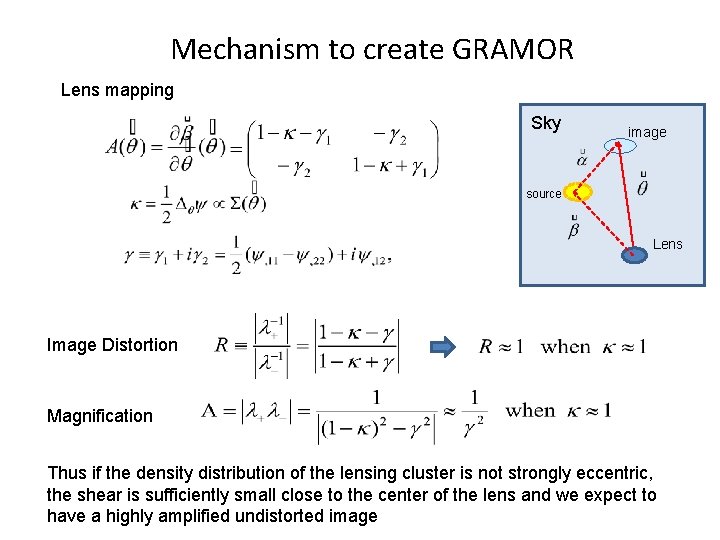
Mechanism to create GRAMOR Lens mapping Sky image source Lens Image Distortion Magnification Thus if the density distribution of the lensing cluster is not strongly eccentric, the shear is sufficiently small close to the center of the lens and we expect to have a highly amplified undistorted image
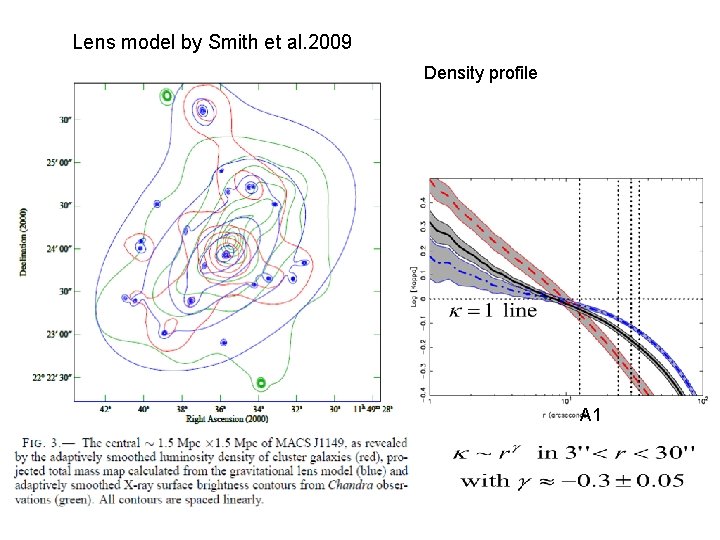
Lens model by Smith et al. 2009 Density profile A 1
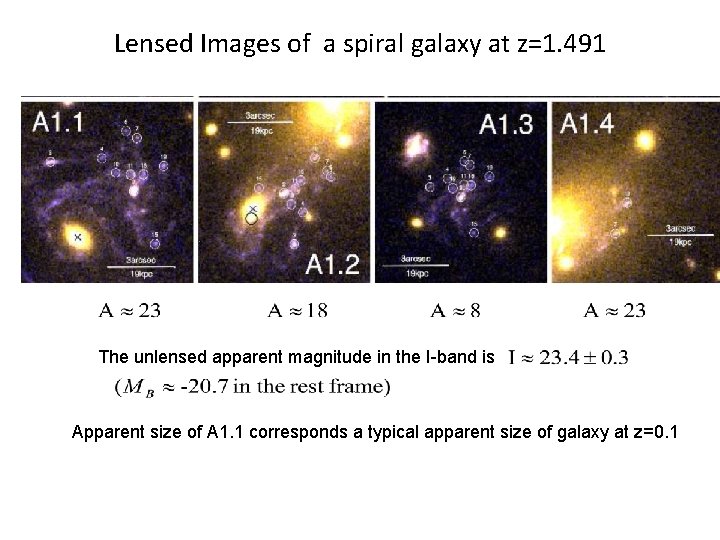
Lensed Images of a spiral galaxy at z=1. 491 The unlensed apparent magnitude in the I-band is Apparent size of A 1. 1 corresponds a typical apparent size of galaxy at z=0. 1
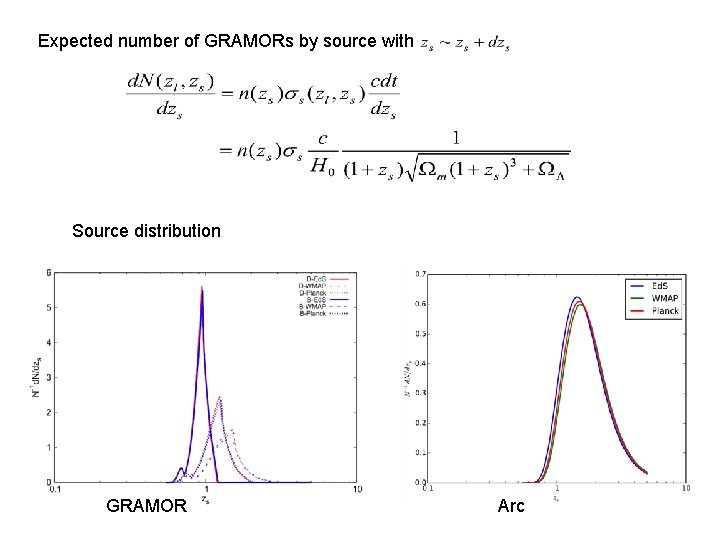
Expected number of GRAMORs by source with Source distribution GRAMOR Arc
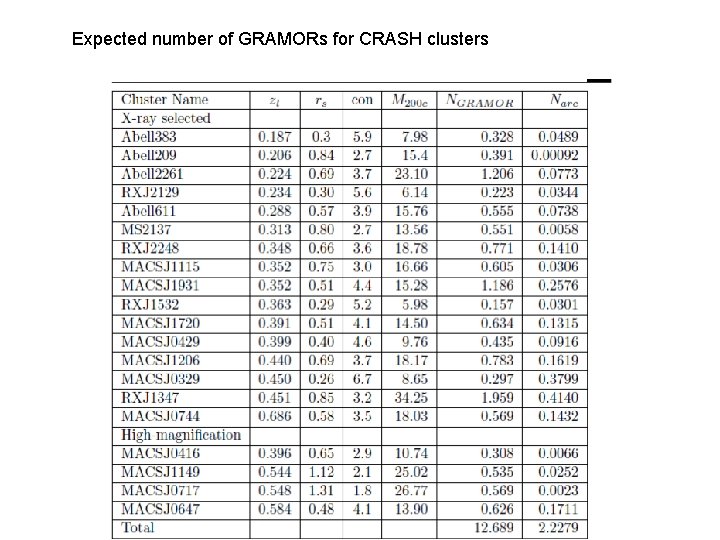
Expected number of GRAMORs for CRASH clusters
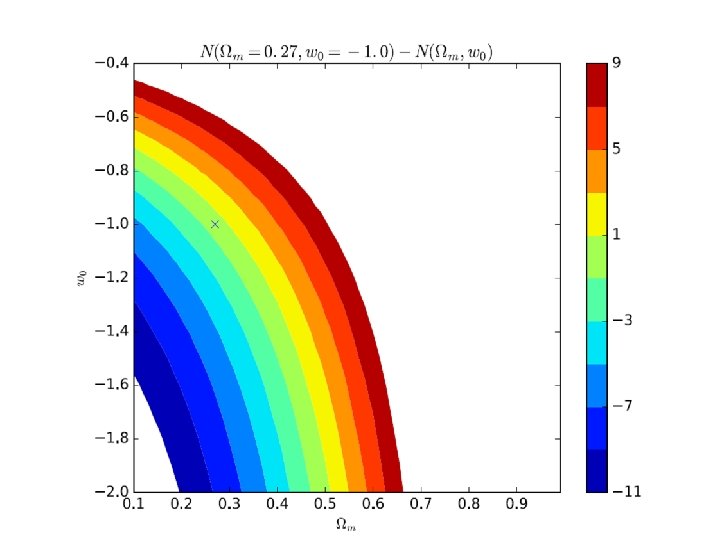
• Number of GRAMOR is about same order with GLA • GRAMORs are more likely found in Clusters with low concentration • Distribution of source redshift has a sharp peak for GRAMORS in high-z clusters • Distribution of source redshift has a strong dependence on the value of cosmological constant, possibly on the nature of dark energy • Improvement of mass reconstruction for MACS J 1149. 5+2223 • Systematic Survey of GRAMORs for high-z clusters combined with other observation such as CMB, SN
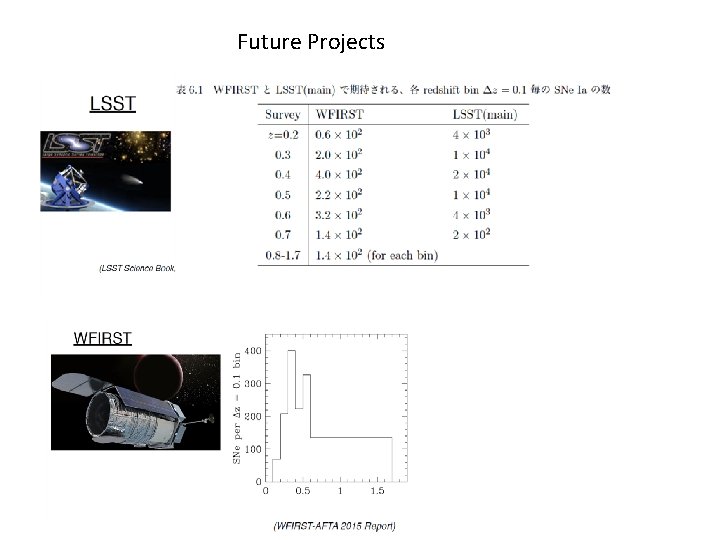
Future Projects
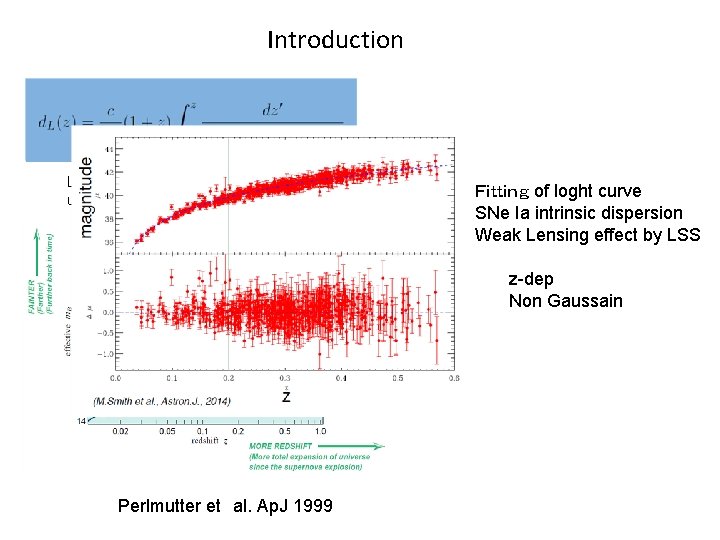
Introduction Luminosity distance in flat FLRW universe Fitting of loght curve SNe Ia intrinsic dispersion Weak Lensing effect by LSS z-dep Non Gaussain Perlmutter et al. Ap. J 1999
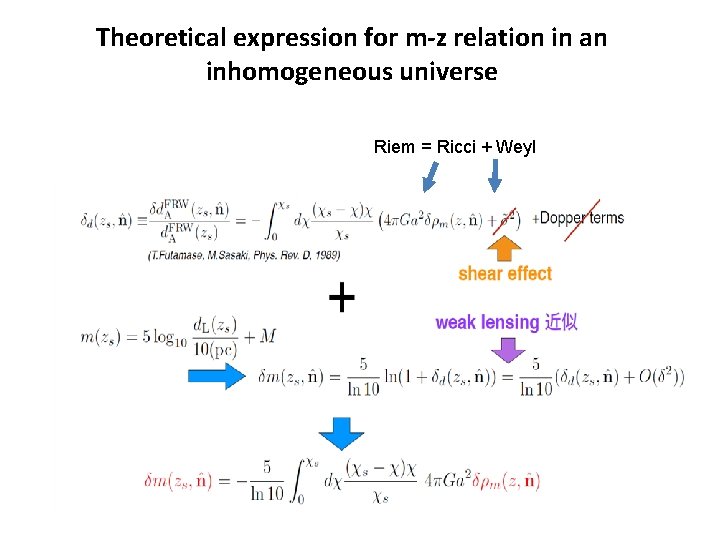
Theoretical expression for m-z relation in an inhomogeneous universe Riem = Ricci + Weyl
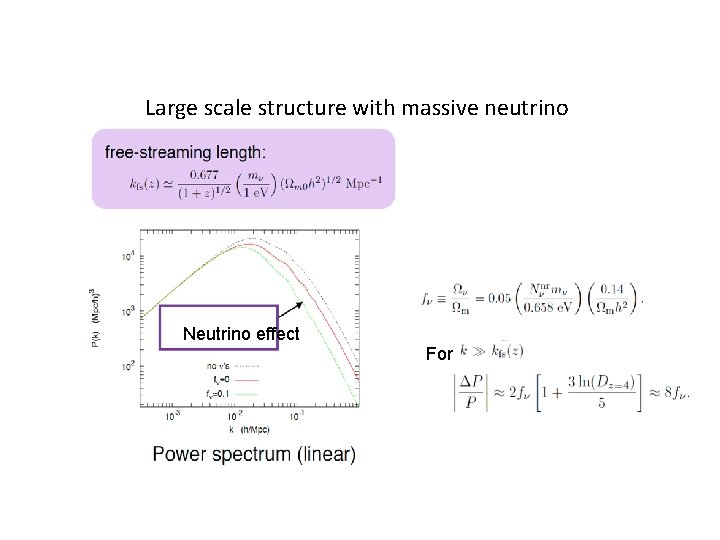
Large scale structure with massive neutrino Neutrino effect For
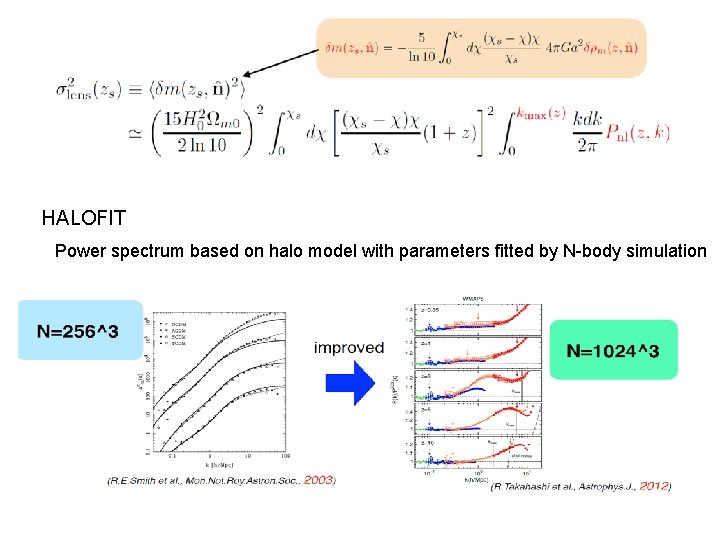
HALOFIT Power spectrum based on halo model with parameters fitted by N-body simulation
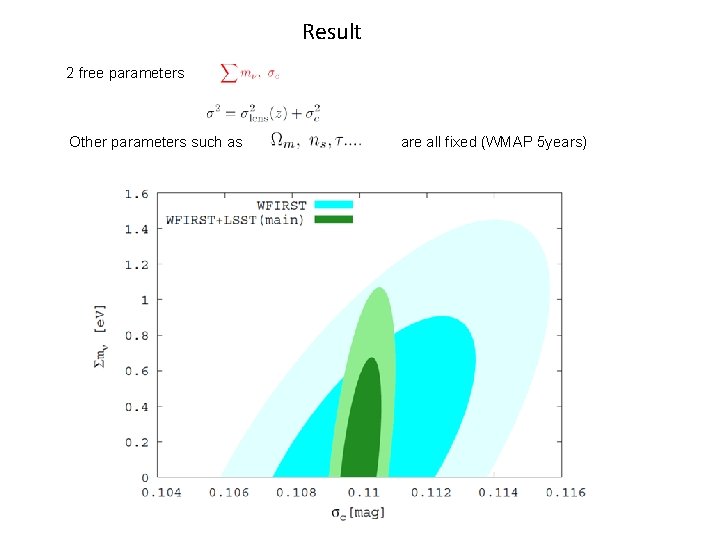
Result 2 free parameters Other parameters such as are all fixed (WMAP 5 years)
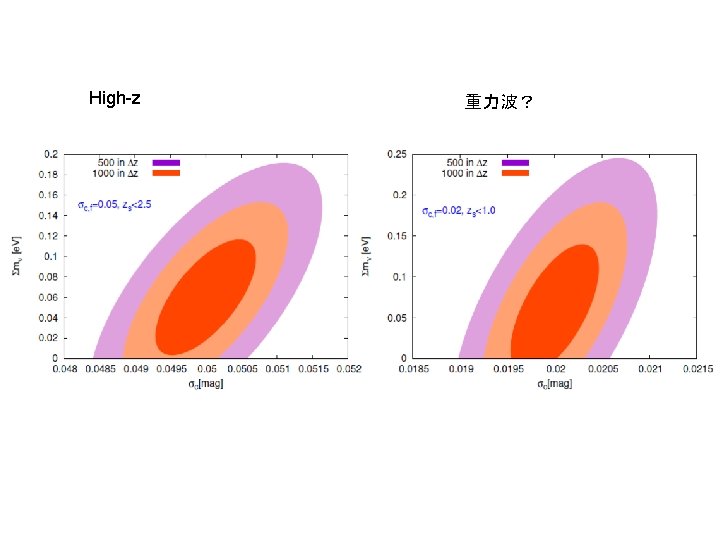
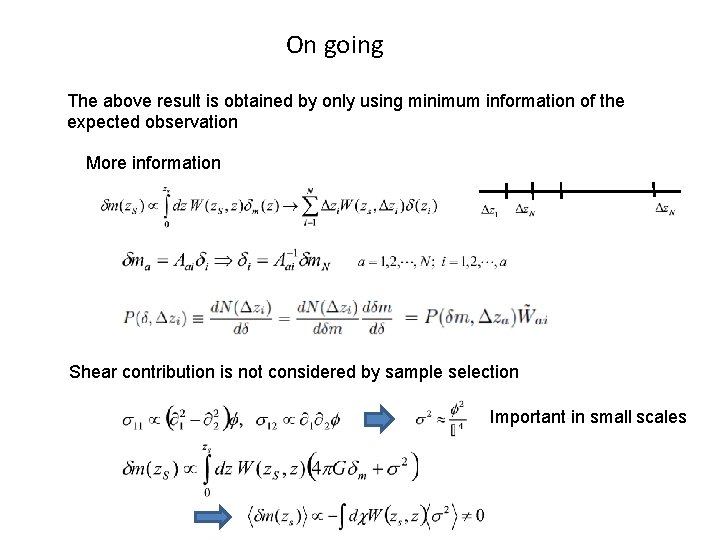
On going The above result is obtained by only using minimum information of the expected observation More information Shear contribution is not considered by sample selection Important in small scales
Theoretical Refinement
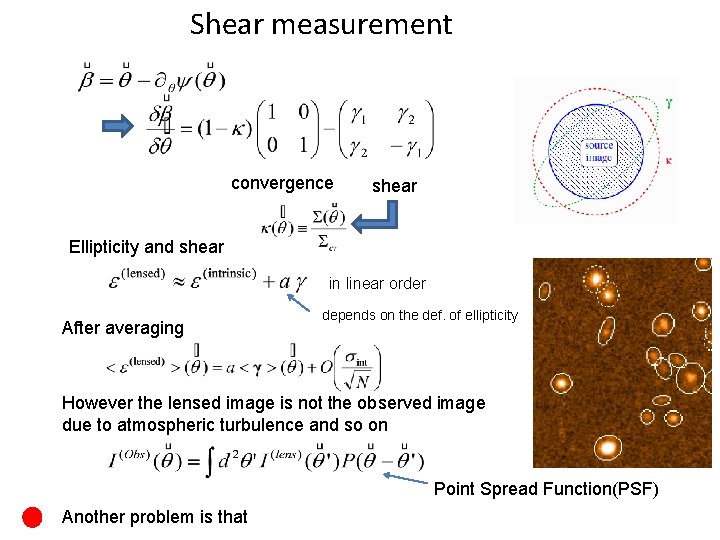
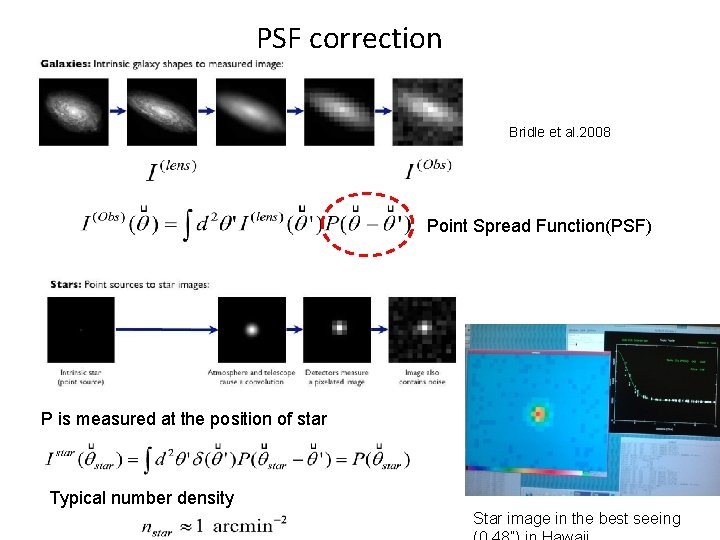
Shear measurement convergence shear Ellipticity and shear in linear order After averaging depends on the def. of ellipticity However the lensed image is not the observed image due to atmospheric turbulence and so on Point Spread Function(PSF) Another problem is that
Difficulties in Weak Lensing Analysis There will be a great progress weak lensing observation from ground as well as from space near future , but it does not automatically means the great progress in the accuracy of weak lensing analysis. • Many systematic errors are not yet fully controlled PSF correction • We can use only high S/N object
PSF correction Bridle et al. 2008 Point Spread Function(PSF) P is measured at the position of star Typical number density Star image in the best seeing
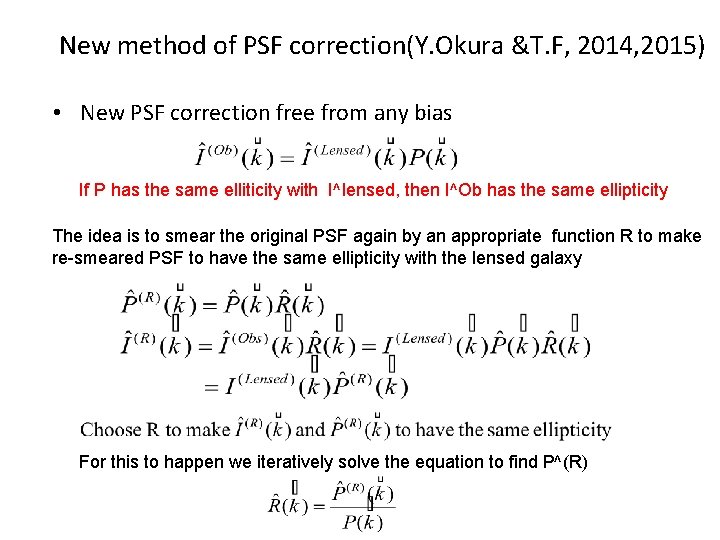
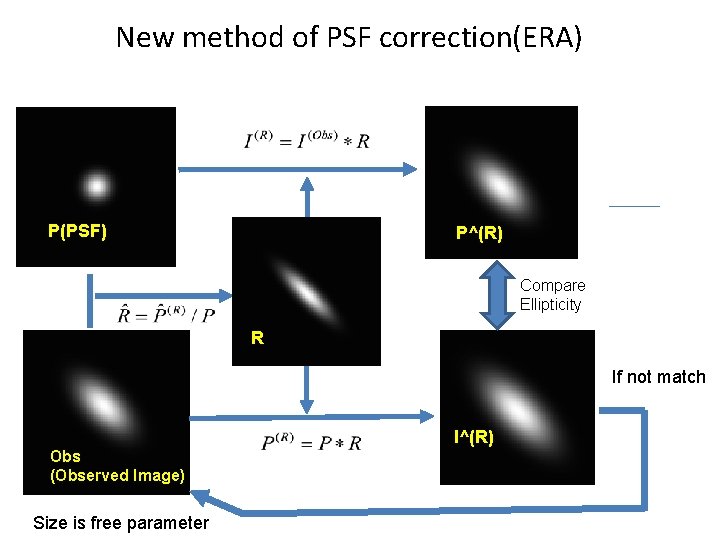
New method of PSF correction(Y. Okura &T. F, 2014, 2015) • New PSF correction free from any bias If P has the same elliticity with I^lensed, then I^Ob has the same ellipticity The idea is to smear the original PSF again by an appropriate function R to make re-smeared PSF to have the same ellipticity with the lensed galaxy For this to happen we iteratively solve the equation to find P^(R)
New method of PSF correction(ERA) P(PSF) P^(R) Compare Ellipticity R If not match I^(R) Obs (Observed Image) Size is free parameter
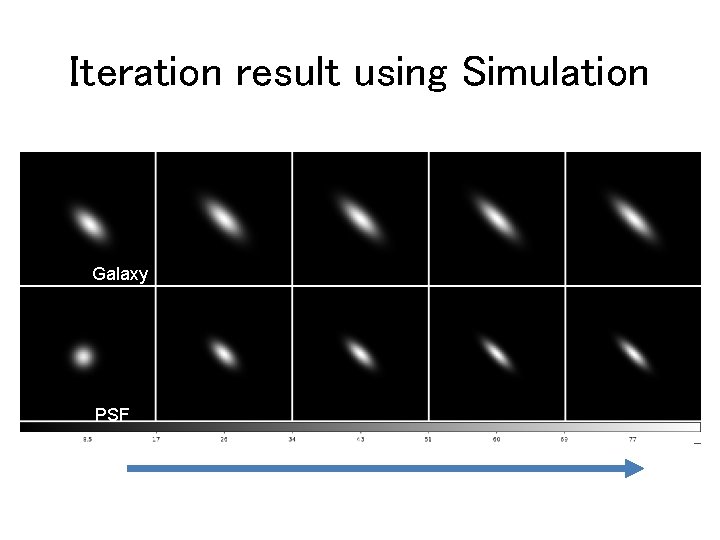
Iteration result using Simulation Galaxy PSF
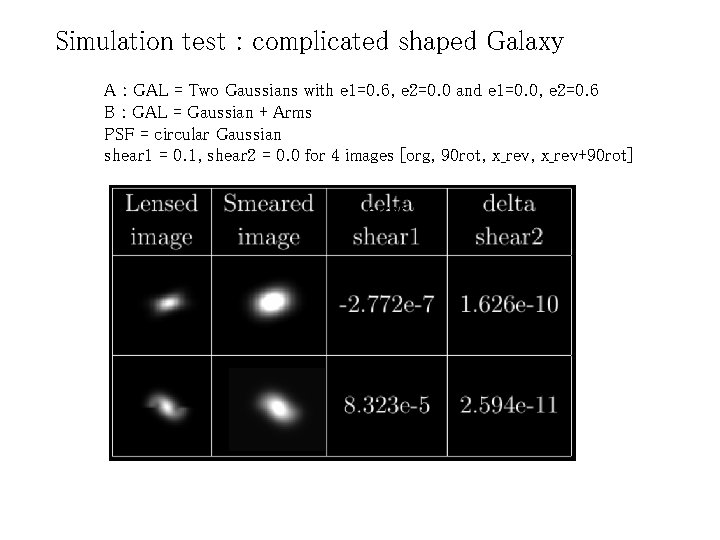
Simulation test : complicated shaped Galaxy A : GAL = Two Gaussians with e 1=0. 6, e 2=0. 0 and e 1=0. 0, e 2=0. 6 B : GAL = Gaussian + Arms PSF = circular Gaussian shear 1 = 0. 1, shear 2 = 0. 0 for 4 images [org, 90 rot, x_rev+90 rot] error A B error
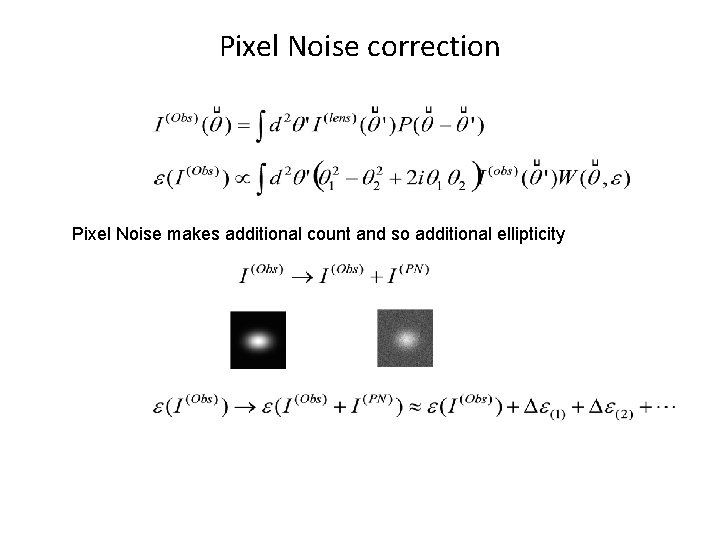
Pixel Noise correction Pixel Noise makes additional count and so additional ellipticity
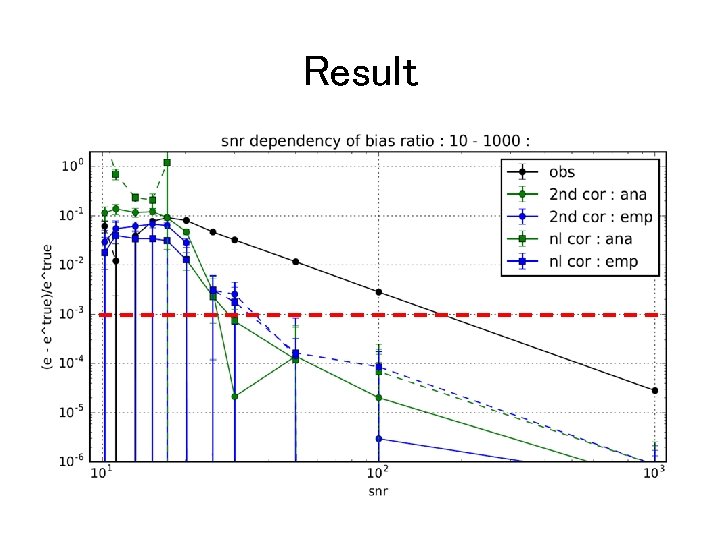
Result
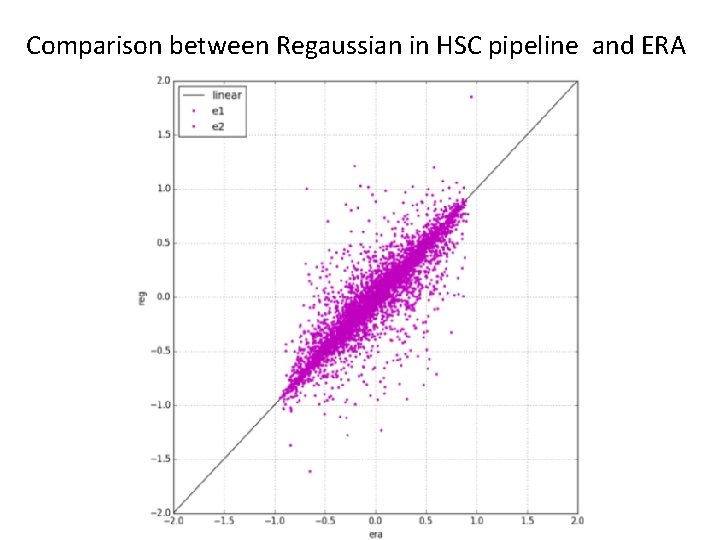
Comparison between Regaussian in HSC pipeline and ERA
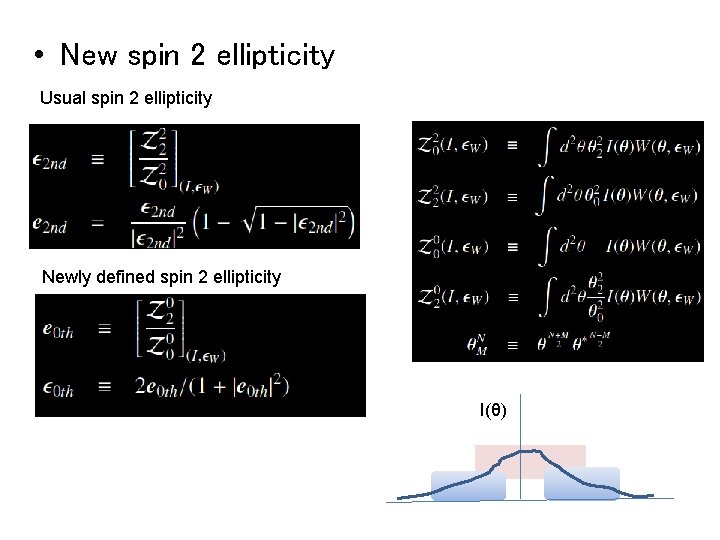
0 th ellipticity • New spin 2 ellipticity Usual spin 2 ellipticity Newly defined spin 2 ellipticity I(θ)
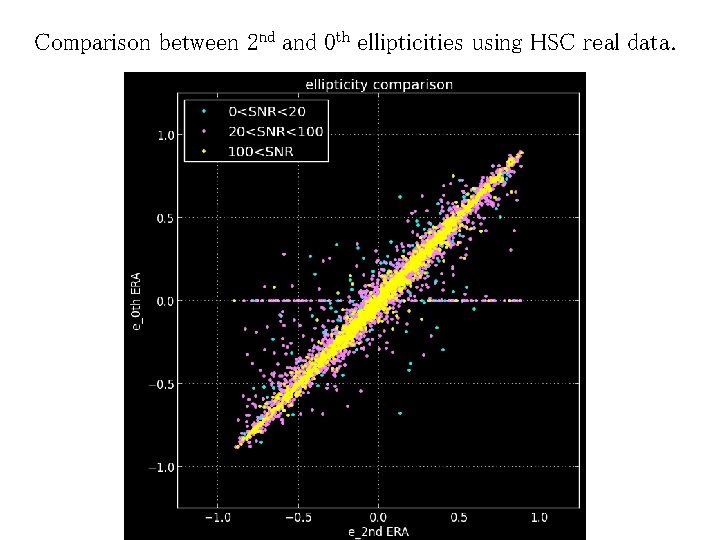
0 th ellipticity Comparison between 2 nd and 0 th ellipticities using HSC real data.
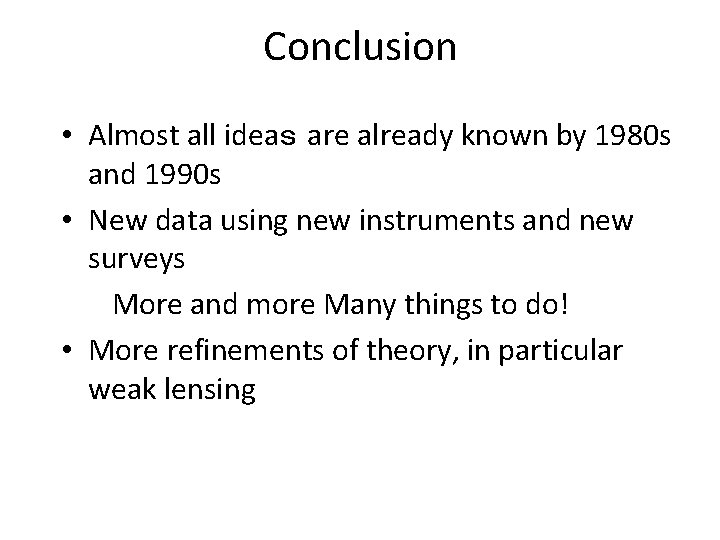
Conclusion • Almost all ideas are already known by 1980 s and 1990 s • New data using new instruments and new surveys More and more Many things to do! • More refinements of theory, in particular weak lensing