Systems Thinking and Climate Change Unit 4 Lesson


![Quantifying C - Units (1) ü Stocks ü Pg C [petagrams of carbon] or](https://slidetodoc.com/presentation_image_h2/7385123f5a0ccb4129b317e199c6fdf8/image-18.jpg "Quantifying C - Units (1) ü Stocks ü Pg C [petagrams of carbon] or")
 ü 1 metric ton = 1, 000 kg ü")
 (p. G/yr) Flow out (p.")


")
 ü Global Climate System is coupled with Global Carbon Cycle")
 ü Positive Feedback Example: ü Melting Ice Caps, Lower Albedo")


- Slides: 48
Systems Thinking and Climate Change Unit 4 Lesson 1
Learning Goals ü Understand Basic Systems Principles ü Two Systems ü Carbon Cycle as a System ü Climate as a Systems ü Sources, Sinks, Stocks and Flows ü Feedbacks ü Time Delays
Systems Concepts ü A system is ü a collection of things, ü with a definable boundary, ü that have some sort of relationship to each other.
System Concepts: Stocks and Flows ü Stock- part of a system that holds something. ü Flow- is the movement of something between stocks in the system, or the movement of something in and out of the system.
A simple system: the bathtub ü system boundaries: What is inside? What are we not including?
A simple system: the bathtub ü First think about the system boundaries. üWhat is inside? What are we not including? ü Then think about stocks. ü In this case we have one stock. The
A simple system: the bathtub ü System Boundaries ü Stock üThe tub holds water. ü Flows üThe faucet in üThe drain out.
Representing a system ü stocks are represented by boxes. ü flows are represented by Flow in arrows. Flow out Stock
Representing a system ü Flow can be sources or sinks üA source adds to the stock üA sink removes something from the stock. Source Sink Stock
A more interesting system ü What if we wanted to look at Lake Mendota instead of a bath tub?
Lake Mendota atmosphere evaporation River inflow precipitation River flow Lake Mendota groundwater inputs seepage to groundwater
Net flow ü change in stock = sources - sink ü For the case of the bath tub, the ü change in amount water in tub = ( water in ) - (water out)
Check Questions ü What happens to the stock when… ü 1. source > sink? ü 2. source < sink? ü 3. source = sink?
Check Questions ü 1. source > sink? stock increases! ü 2. source < sink? stock decreases! ü 3. source = sink? stock remains constant! ü What happens to the net flow in each case?
Check Questions ü ü ü 1. source > sink? stock increases! net flow is positive! 2. source < sink? stock decreases! net flow is negative! 3. source = sink? stock remains constant! net flow is zero!!
2. 2 2. 9
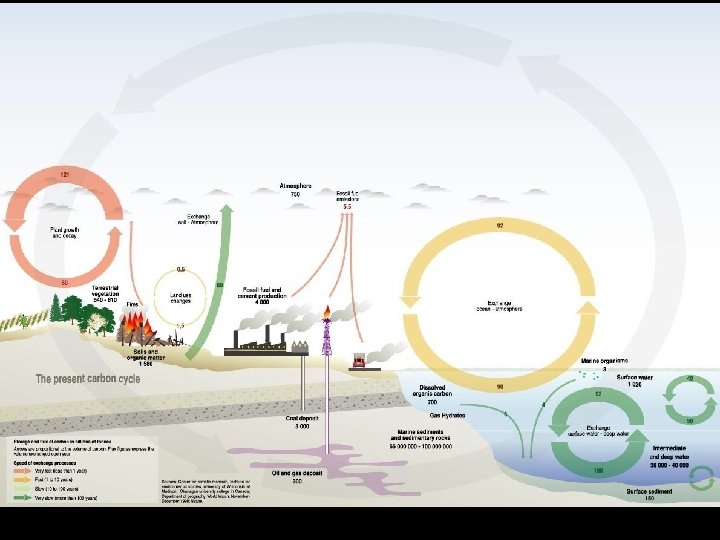
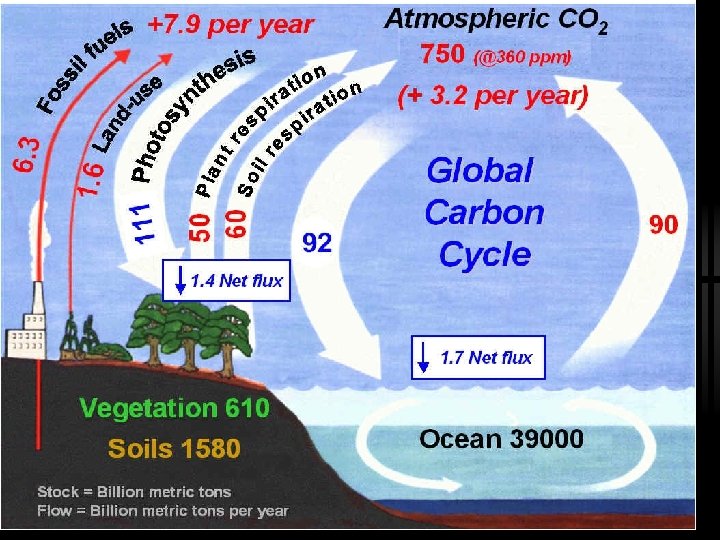
Classwork: Global Carbon Cycle ü Using the carbon cycle diagram, identify all the stocks. For each: ü Quantify the stored carbon ü List and quantify each in flow and outflow ü Calculate the net flow ü Label each stock as a source or a sink
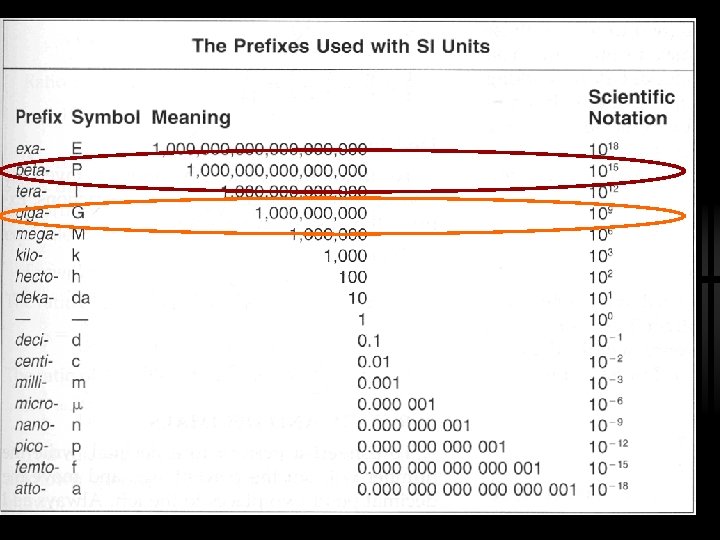
Quantifying C - Units (1) ü Stocks ü Pg C [petagrams of carbon] or ü Gt C [gigatonnes of carbon] ü Flows ü Pg C/yr [petagrams of carbon per year] or ü Gt C/yr [gigatonnes of carbon per year]
Quantifying C - Units (2) ü 1 metric ton = 1, 000 kg ü 1 metric ton = 2, 205 lbs ü 1 (short) ton = 2, 000 lbs ü 1015 g = 1 Pg = 1 Gt
Quantifying C Stocks and Flows Stock Storage (p. G) (p. G/yr) Flow out (p. G/yr) + - Flow in Net Flow (p. G/yr) Source/Sink 0. 7 Sink 60 Terrestrial Ecosystems 560 + 1, 500 Atmosphere 750 Ocean Fossil Fuels 120 60 2. 9 2. 2
2. 2 2. 9
Land Use Changes ü Sources üDeforestation üPlowing of prairies ü Sinks üForest re-growth ü(The missing sink)
North American Forests a C Sink
2. 2 2. 9
Global Carbon Cycle- Key Points ü Atmosphere and ocean serve as carbon sinks. ü Major net sources are burning fossil fuels and land deforestation. ü To reduce C in the atmosphere, the flow in must be smaller than the flow out.
Systems Dynamics: Feedback Loops and Delays ü Topics we’ll cover: ü Positive Feedback Loops ü Negative Feedback Loops ü Time Delays ü Coupled Systems
Positive Feedback Loops ü self-reinforcing ü Change in one direction causes more in that direction ü Example: Holding a microphone in front of a speaker.
Negative Feedback Loops ü self-limiting or balancing ü Change in one direction causes a corrective change in the other direction ü Example: Thermostat in your house
Time Delays ü Time lag between a stimulus and a response ü Example: Titanic steering
The Climate System (1)
The Climate System (2) ü Global Climate System is coupled with Global Carbon Cycle
The Climate System (3) ü Positive Feedback Example: ü Melting Ice Caps, Lower Albedo ü Negative Feedback Example: ü Cloud cover ü Time Delay: ü About 40 years
Radiative Forcing Mechanisms ü Radiative forcing mechanism: a variable that impacts the global energy balance. ü Examples: CO 2 concentrations, sunspots, volcanoes. ü Radiative forcing is measures in W/m 2 [power/area]. ü Positive forcings increase trapped energy ü Negative forcings decrease trapped energy
Fin
A more interesting system ü Stop. Pull out a piece of paper and draw the stock and flows for water in this system. ü Ask yourself. Where is the water stored? where is it coming from going to? ü Think about the hydrological cycle.
Lake Mendota ü seriously. stop and do it. it will help!
Lake Mendota ü essentially the lake is a big bathtub right? water comes in, water goes out. ü But this is not very interesting. Lets see if we can be more specific. Source Sink Lake Mendota
Department Store Example ü Now we will go over the department store example from the pre-assessment. We’ll look at how we can apply systems concepts to the
ü 1. During which minute did the most people enter the store? ü minute 4.
ü 2. During which minute was the net gain greatest? ü Net gain is (source )- (sink). Where is this greatest? ü approximately 28 people in - 8 people out = net gain of 20 people ü minute 8.
ü 3. During which minute did the most people leave the store? ü minute 21
ü 4. During which minute was the net gain greatest? ü You have to figure out when (source )(sink) is most negative. ü 29 people in - 7 people out = net loss of 22 people ü minute 17.
ü 5. During which minute were the most people in the store? ü here is where systems thinking really helps. So far we know… ü when sources > sinks, net flow is positive and therefore the stock is increasing. (in this case that means more people are coming in than going out so the number of people in the store MUST be increasing) ü This is represented in yellow.
ü 5. During which minute were the most people in the store? ü When sources < sinks, net flow is negative so the stock is decreasing. this means that on net people are leaving, so the stock of people in the store is getting smaller. ü this is represented in green
ü 5. During which minute were the most people in the store? ü When sources = sinks, we know that the net flow is zero. (this happened at about minute 13. ) ü So we know that until min 13, the number of people in the store had to be increasing, and after min 13 the number of people had to be decreasing. ü Therefore, the most people were in the store at minute 13 and the least at minute 30.