SYSTEMS ANALYSIS AND DESIGN Preliminary CHAPTER investigation and


 44")
 45")


")
")


. ü Info like:")


- Slides: 85
SYSTEMS ANALYSIS AND DESIGN Preliminary. CHAPTER investigation and feasibility 2 study, Activities in Requirement 1
Topics To Be Learnt Fact Finding Techniques Tools for Analysis Decision Trees Decision Tables Structured English Data Flow Diagram Data Dictionary 2
Fact Finding Techniques ü The Specific Methods analysts use for Collecting Data about Requirements are called Fact-Finding Techniques. 3
Fact Finding Techniques ü Interview ü Questionnaire ü Record Review ü Observation 4
Interview ü ü ü ü Individuals or Groups Current users or Potential users Managers or Employees Time consuming Analysts use Interview + other methods Qualitative Information Who can not communicate in writing Misunderstandings, Resistance 5
Interview cont. ü Mainly two types of interviews are there üStructured Interviews üUn. Structured Interviews 6
Structured Interviews Use Standardized Questions in an Open. Response or Closed-Response format. ü It uses a set of prescribed answers. ü 7
Open/Closed Response ü Open : ü e. g. : Obtain information about critical design features for employees ü Closed : ü e. g. : Obtain insight into system likes and dislikes 8
Un. Structured Interviews Simply Question-and-Answer format. ü Analysts want to acquire general information about system. ü Encourages respondents to share their feelings, ideas and beliefs. ü Interviewer allows interviewee(Responder) to answer in their own words. ü 9
Questionnaire Various types of information from a large number of persons. ü Use of Standardized question can collect more reliable data. ü Anonymity can give more Honest response. ü Expressions or reactions cannot be observed. ü 10
Questionnaire Respondent may not fill full questionnaire. ü Normally uses Open-Response Question Forms. ü Printing and other costs ü 11
Record Review Records & Reports gives information about Organization and Operation. ü Examine information of system and users. ü Record inspection can be performed: ü ü Beginning of the study OR ü Later in the study 12
Record Review Includes Policy Manuals, Regulations, and Standard Operating Procedures ü Do not Show : ü ü What activities are actually occurring ü Where the decision-making power lies ü How tasks are performed ü Can Help: ü To understand the system by familiarizing them with what operations must be supported 13
Observation Gain information that cannot be obtain by any other fact-finding methods. ü Firsthand Information – How activities are carried out. ü Useful When: ü ü How Documents are Handled! ü How processes are carried out! ü Specified steps are actually followed or not! 14
Observation Shows the Analyst ü What Should Happen? ü Standard Operating Procedure ü Controls and Checks for Accuracy and Completeness ü Properly Completed Documentation ü Efficient and Timely, Completion of Work 15
Observation Shows the Analyst ü What Actually Occurs? ü Delay in doing Work ü Information recalled from memory (incorrectly) ü Skipped Steps ü Extra photocopy needed ü New controls needed ü Information not in file-telephone call needed ü Documents not completed as required ü Employees r not aware of prescribed procedure 16
Tools for Analysis Decision Trees Decision Tables Structured English 17
Important Decision Concepts Actions Conditions Possible States of Events Leads to Alternatives, steps, activities or procedures that can be taken when a specific decision is made 18
Relation of Condition and Action for Order Processing 19
Condition-Action Example with Multiple Values 20
Decision-Tree Sequence of Decisions 21
Decision-Tree Characteristics ü It is a Diagram ü presents conditions and actions sequentially ü and thus shows which conditions to consider first, which second and so on. ü It is also ü a method of showing the relationship of each condition and its permissible actions. 22
Decision-Tree for Discount Authorization 23
Decision-Tree for Invoice Processing 24
Decision Tables It is a Matrix of Rows and Columns. Decision Rules, included in a decision table, state what procedure to follow when certain conditions exist. ü Since mid-1950 s, ü It was developed at General Electric ü For Analysis of business functions such as ü ü ü Inventory Control, Sales Analysis, Credit Analysis Transportation Control and Routing. 25
General Form for Decision Tables 26
Decision Table Characteristics ü Made up of four sections ü Conditions Statements ü Condition Entries ü Action Statements ü Action Entries 27
Condition Statements ü Identify the relevant conditions Condition Entries ü Tell which value, if any, applies for a particular condition 28
Action Statements ü List the set of all steps that can be taken when a certain condition occurs Action Entries ü Show what specific actions in the set to take when selected conditions or combinations of conditions are true 29
Characteristics cont. ü Sometimes Notes are added below the table ü To indicate when to use the table OR ü To Distinguish Decision Tables it from other 30
Sample Decision Table for Payment of Health Services 31
Decision Table for Payment Discount Example 32
Decision Table for Payment Discount Example 33
Building Decision Table 1. Determine the most relevant factors to be considered in making a decision. This identifies the conditions in the decision. Each condition selected should have the potential to either occur or not occur; partial occurrence is not possible. 34
Building Decision Table Cont. 2. Determine the most feasible steps to or activities under varying conditions (not just current conditions). This identifies the actions. 35
Building Decision Table Cont. 3. Study the combinations of conditions that are possible. For every number N of conditions, there are 2 N combinations to be considered. For example, for three conditions, there are eight possible combinations; 23 = 8. For four, 24 = 16 combinations are possible and can be included in the table. 36
Building Decision Table Cont. 4. Fill in the table with decision rules. 37
Types of Table Entries Limited-Entry Form ü Extended-Entry Form ü Mixed-Entry Form ü ELSE Form ü 38
Limited-Entry Form 39
Extended-Entry Form 40
Mixed-Entry Form 41
ELSE Form 42
Multiple Tables Direct Transfer ü Temporary Transfer ü 43
Direct Transfer (GOTO) 44
Temporary Transfer (PERFORM) 45
Example Table 46
Structured English An Additional method to overcome problems of ambiguous language in stating conditions and actions in decisions and procedures. ü Decision that must be made when these specific conditions occur, and alternative actions to take. ü 47
Structured English List Steps in the order in which they must be taken. ü No Special Symbols required. ü English-Like statements are used. ü 48
Structured Statements Sequence Structures ü Decision Structures ü Iteration Structures ü 49
Sequence Structured 1. 2. 3. 4. 5. Pick out a desirable book. Take the book to the checkout counter. Pay for the book. Obtain a receipt. Leave the store. 50
Sequence Structured 51
Decision Structured 52
Decision Structured 53
Iteration Structured 54
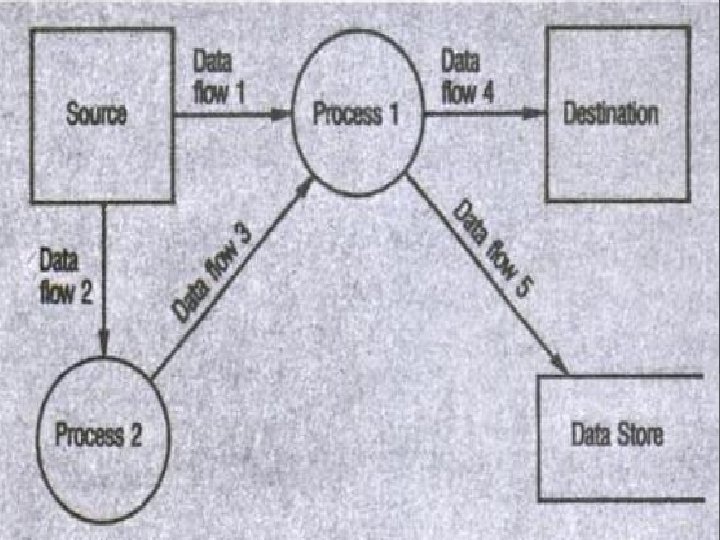
Data Flow Diagram ü A Graphic Tool used to describe and analyze the Movement of DATA through a SYSTEM – manual or automated – including the Processes, Stores of Data, and Delays in the System. 55
DFD Symbols - Yourdon Data Flow Process Data Store Source/Sink (External Entity)
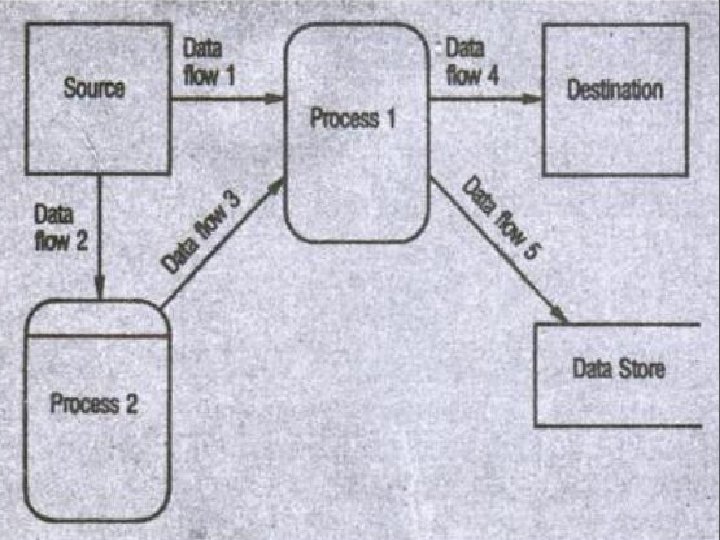
DFD Symbols – Gane & Sarson Data Flow Process Data Store Source/Sink (External Entity)
DFD e. g. 1 Order CUSTOMER Payment Status Message Invoice In - Stock Request 0 Order System Inventory Reports ACCOUNTING WAREHOUSE Shipping Order Shipping Confirmation
Shipping Confirmation Level-0 of Order System
DFD Development Process Study the Current System (Study the physical system). ü Info like: ü ü Department ü Copy room or building location ü Person ü Step number ü File ü Procedure 62
63
Physical Data Flow Diagrams ü An implementation-dependent view of the current system, showing what tasks are carried out and how they are performed. ü Names of people, Names of Procedures Form and document names or numbers Names of departments Master and transaction files, Locations Equipment and devices used, etc… ü ü 64
Logical Data Flow Diagrams ü An implementation-independent view of a system, focusing on the flow of data between processes without regard for the specific devices, storage locations, or people in the system. 65
3 Reasons for Physical DFD It is much easier to describe first the interaction between physical components than to understand the policies. ü Useful for communicating with users. ü A way to validate or verify the user’s current view of the system with the way it is actually operating. ü 66
Drawing Physical DFD Drawing a Context Diagram ü Developing a Process Chart ü Developing a First-Level Physical DFD ü Exploding Processes into Greater Detail ü 67
Drawing a Context Diagram General Characteristics of the business process ü Contains a single process but plays a very important role in studying the current system. ü 68
Context DFD for Accounts Payable System 69
Developing a Process Chart A system consists of many different activities or processes. ü As we have seen that one process will contain several individual steps – sub processes. ü Programmer often develop software as a collection of independent but interacting modules. ü 70
Hierarchy Chart Modules in Payroll Processing Program 71
Process Hierarchy Chart Accounts Payable System 72
Developing the First-Level Physical Data Flow Diagram Any context diagram requires further details to understand the main process in depth. ü See the process hierarchy chart of accounts payable(pre. Slide(78)), we move to gather information (data flows, data stores, inputs & outputs) of – Approve Invoice, Revise Balance Due, and Write Checks. ü 73
First-Level DFD Accounts Payable Processing 74
Presentation Graph Showing First-Level Ac. Payable Process 75
Exploding Processes into Greater Detail What must be done to verify an invoice is correct? What information is used to do such verification? ü How are vendor balances established for new vendors – those for whom there is not yet a ledger card? ü What information is used in posting the invoice to the account? ü What criteria are used to select a particular invoice for payment when is an invoice paid? ü 76
Physical Data Flow Diagram for Invoice Approval Process 77
From the Last Diagram ü ü ü The receipt of merchandise must be verified before an invoice is approved. In some cases, purchase order or telephone calls are used to verify that a purchase is authorized. Some invoices are rejected because they are incorrect. All invoices are logged as they are received. The accounts payable clerk(Ginny) verifies the correctness of each invoice. 78
In General, All data flows that appeared on the previous diagram explaining the process are included in the lower-level diagram. ü New data flows and data stores are added if they are used internally in the process to link processes introduced for the first time in the explosion at this level. ü Data flows and data stores that originate within the process must be shown. ü No entries should contradict the descriptions of the higher-level data flow diagrams. ü 79
Second-Level DFD Maintaining Vendor Balances 80
Second-Level DFD Vendor Payment Processing 81
Deriving the Logical View ü ü ü Show actual data needed in process, not the documents that contain them. Remove routing information; that is, the flow between procedures, not between people, offices or locations. Remove tools and devices (accordion folders, file cabinets, in-boxes) Remove control information. Consolidate redundant data stores. Remove unnecessary processes, such as those that do not change the data or data flows 82
General Rules for Drawing Logical DFD Any data flow leaving a process must be based on data that are input to the process. 2. All data flows are named; the name reflects the data flowing between processes, data stores, sources, or sinks. 3. Only data needed to perform the process should be an input to the process. 4. A process should know nothing about, that is, be independent of, any other process in the system; it should depend only on its own input and output. 1. 83
General Rules for Drawing Logical DFD Cont. Processes are always running; they do not start or stop. Analysts should assume that a process is always ready to function or perform necessary work. 6. Output from processes can take one of the following forms: 5. I. III. IV. V. An input data flow with information added by the process A response or change of data form Change of status Change of content Change in organization 84
Reference Books: ü Analysis and Design of Information System – By Jams A Senn (TMH)