Systemic Treatment of Colorectal Cancer in Metastatic Adjuvant

 Normal epithelium Adenoma ? K-ras")
; Populations vs. Individuals (群体与个体) Stage III Stage IV")
 N=28, 491 0 1 yr. 2 yr 3")
 24 ~15")
")


: efficacy, dose, vs. toxicity Enzymes vs. food.")


![Overall Survival FOLFIRI/FOL FOX FOLFOX/FOLFIRI 20. 4 [16. 724. 9] 21. 5 [17. 3](https://slidetodoc.com/presentation_image/4bf32159e8e0355890f09c91835814d5/image-17.jpg "Overall Survival FOLFIRI/FOL FOX FOLFOX/FOLFIRI 20. 4 [16. 724. 9] 21. 5 [17. 3")


 IFL + placebo")


: Overall Survival 1. 0 P r o b a")


 R FOLFIRI + cetuximab •")
 OS,")

 R FOLFOX 4 +")

 R FOLFOX +")
: Kras WT PFS (%) Events, Median (95% CI) n")
: K-ras WT OS (interim analysis) Events, Median (95% CI)")
: response rates Panitumumab + FOLFOX (n=317) FOLFOX (n=323) 55")


 (Based on INT 0089) Five-year DFS (%) 56 Five-year")

 1. 0 Capecitabine (n=1 004)")


 3 -year Disease-free Survival 1 Ev # 3")


 Phase III trial R A n=944")

 in all arms Patients (%) 40 XELOX")
 Mayo (n=657) RP (n=269) XELOX (n=938)")


*")


")
 m.")

 Phase III Trial FOLFOX 4 Observation FOLFOX 4 + Avastin")

 FOLFOX 4 + Avastin (n=1155) XELOX + Avastin")
 FOLFOX 4 + Bev (n=1145) XELOX + Bev (n=1135)")
 Category, n (%)a")


 and FOLFIRI are the")


- Slides: 86
Systemic Treatment of Colorectal Cancer in Metastatic & Adjuvant Settings – Yesterday, Today, and Tomorrow 系统性大肠癌治疗: 过去,现在和将来 Weijing Sun, MD Director of GI Medical Oncology University of Pennsylvania 孙伟劲 消化肿瘤科主任 宾夕法尼亚大学肿瘤中心
Adenoma to Carcinoma Pathway Normal 5 q LOH* (APC/β-catenin) Normal epithelium Adenoma ? K-ras Dysplastic ACF ? K-ras Early adenoma MMR activation ACF = aberrant crypt foci; MMR = mismatch repair. Cancer 18 q LOH DCC/SMAD 4/SMAD 2 17 q LOH Late adenoma Carcinoma Metastatic carcinoma
Stage Systems: Terminology vs. Contents (概念与内涵); Populations vs. Individuals (群体与个体) Stage III Stage IV T 1, N 0, M 0 A: T 3, N 0, M 0 A: T 1 -2, N 1 a-c; M 1: Distal Metastasis T 2, N 0, M 0 B: T 4 a, N 0, M 0 T 1, N 2 a; C: T 4 b, N 0, M 0 B: T 3 -4 a, N 2 a, Disease development Staging T 2 -3, N 2 a; T 1 -2, N 2 b M 1 a: One organ site (liver, lung, ovary, nonregional node) C: T 4 a, N 2 a; T 3 -4 a, N 2 b; T 4 b, N 1 -2 Definition Invades submucosa (T 1)/ muscular propria (T 2) T 3: Invades through muscularis propria into pericolorectal tissues T 4 a: penetrates to the surface of the visceral peritoneum T 4 b: invades or is adherent to other organs or structures N 1: metastasis in 1 -3 LN N 1 a: 1 LN, N 1 b: 2 -3 LN N 1 c: deposits in the subserosa, mesentery, oro nonperitonealized pericolic tissue w/o LN N 2: ≥ 4 LN N 2 a: 4 -6 LN, N 2 b: ≥ 7 LN M 1 b: ≥ one organ/site or Peritoneum Involves distant metastases
SEER Colon Cancer 1973 -2005 (USA) N=28, 491 0 1 yr. 2 yr 3 yr 4 yr 5 yr I 91. 4 87. 0 82. 6 78. 2 74. 0 IIA 89. 9 83. 4 77. 8 72. 0 68. 5 IIB 85. 4 77. 8 69. 1 62. 9 58. 6 IIC 66. 0 52. 5 45. 3 41. 5 37. 3 IIIA 98. 3 88. 0 83. 6 79. 1 73. 1 IIIB 83. 4 70. 8 59. 3 51. 7 46. 3 IIIC 71. 9 50. 3 39. 0 32. 9 28. 0 IV 39. 9 19. 7 11. 3 7. 6 5. 7
History of Therapeutic Regimens for the Treatment of MCRC Median OS* (mo) 24 ~15 -20 mo 18 12 6 0 ~15 -17 mo ~12 -14 mo ~11 -12 mo ~4 -6 mo 1960’s 1980’s 1990’s 2000’s 5 -Fluorouracil (5 -FU) 5 -FU biomodulation Irinotecan *Both first- and second-line exposure to therapy. Van Cutsem and Verslype. ASCO Educ Book. 2002. Oxaliplatin
5 -Fluorouracil (5 -FU)
Advances in the Treatment of Colorectal Cancer 1980 1985 1990 1995 2000 2005 2008 5 -FU Therapeutic concepts Irinotecan Capecitabine Oxaliplatin Bevacizumab Cetuximab Targeted therapies Panitumumab { Palliative CT Adjuvant CT Pre-operative. CT KRas WT/MT Braf
Management of MCRC: An Evolving Treatment Algorithm Diagnosis of MCRC Resectable Neoadjuvant/ preoperative therapy Unresectable Borderline/ potentially resectable First-line Second-line Surgery Third-line Adjuvant therapy Fourth-line Treatment continuum
Chemotherapy • Fluorouracil: 5 -FU, Xeloda, (S-1): efficacy, dose, vs. toxicity Enzymes vs. food. • FOLFOX/XELOX vs. FOLFIRI (XELIRI): 1 st line vs. 2 nd line Regimens FOLFOX(4, 6, 7…), XELOX, Neurological Toxicity: Dose modification vs. Maintenance FOLFIRI: Irintotecan--UGT 1 A 1: *28 -- 6/6, 6/7,7/7 • Avastin: When, how? • Cetuximab in WT patients
Probability IFL 1. 0 0. 9 0. 8 0. 7 0. 6 0. 5 0. 4 0. 3 0. 2 0. 1 0. 0 Irinotecan/5 -FU/LV (N=231) 5 -FU/LV (N=226) 12. 6 mo 14. 8 mo P=0. 042* 0 * log-rank test 6 12 18 24 Months 30 36 42
Probability FOLFIRI 1. 0 0. 9 0. 8 0. 7 0. 6 0. 5 0. 4 0. 3 0. 2 0. 1 0. 0 CPT-11/5 -FU/LV (N=198) 5 -FU/LV (N=187) 17. 4 mo* p<0. 032† 14. 1 mo* 0 6 12 18 Months * Medians † Log-rank test 24 30
FOLFIRI Regimens B 400 Douillard 200 600 B 400 200 180 B 400 FOLFIRI 400 180 2400 -3000 600
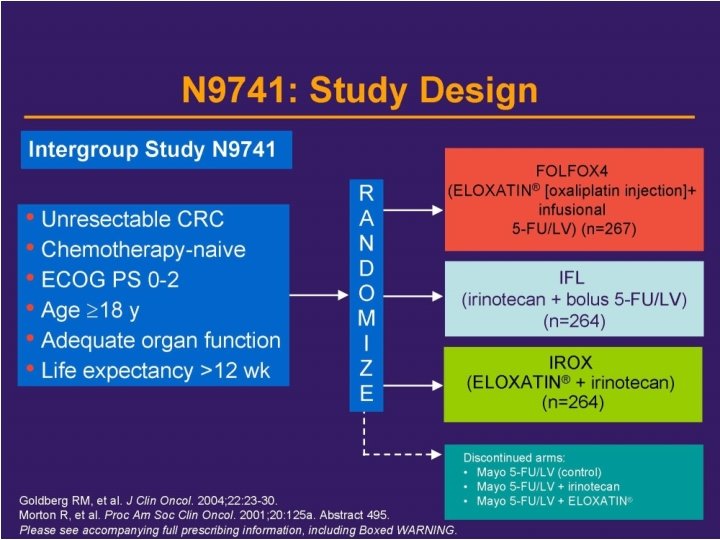
Overall Survival IFL FOLFOX P value IROX RR 31% 45% 0. 002 34% TTP 6. 9 m 8. 7 m 0. 0014 6. 5 m OS 14. 8 m 19. 5 m 0. 0001 17. 4 m
FOLFOX Regimens B 400 FOLFOX 4 200 600 200 85 B 400 FOLFOX 6 400 100 2400 -3000 FOLFOX 7 400 130 2400 B 400 m. FOLFOX 6 400 85 2400 -3000 m. FOLFOX 7 400 100 3000 600
FOLFIRI vs. FOLFOX Randomized, multicentric, open-label, prospective, phase III trial Arm A FOLFIRI until progression FOLFOX 6 until progression FOLFIRI until progression CPT-11 180 mg/m 2 + simplified LV 5 FU R Arm B FOLFOX 6 until progression L-OHP 100 mg/m 2 IV + simplified LV 5 FU
Overall Survival FOLFIRI/FOL FOX FOLFOX/FOLFIRI 20. 4 [16. 724. 9] 21. 5 [17. 3 -24. 8] 65/109 67/111 Median (months) 1. 0 Events/patients 0. 8 Probability Median follow-up FOLFIRI / FOLFOX 0. 6 FOLFOX / FOLFIRI 18. 6 months Logrank p = 0. 9 0. 4 0. 2 0. 0 0 6 12 18 24 Months 30 36 42
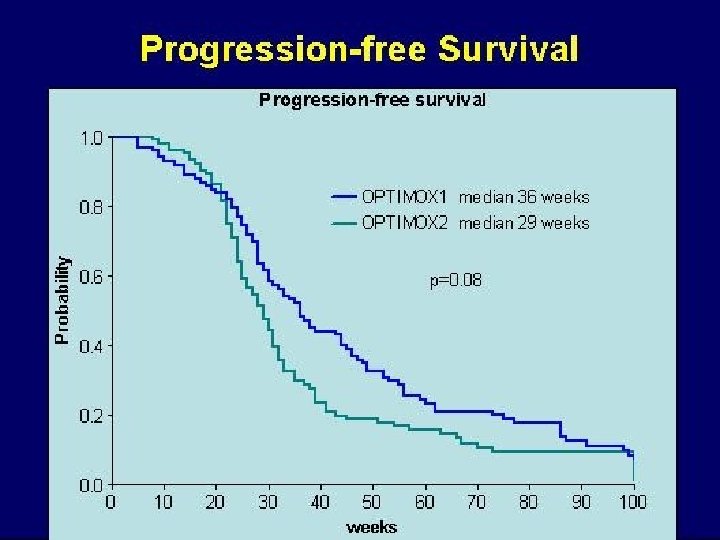
OPTIMOX-1 FOLFOX 4 R 620 pts 6 x FOLFOX 7 - 12 x s. LV 5 FU 2 - 6 x FOLFOX 7 Cum. Oxali (%) 780 FOLFOX 4 RR 58. 5 PFS 9. 0 DDC 9. 0 OS 19. 3 G 3/4 NTox 17. 9 1560 FOLFOX 7 58. 3 8. 7 10. 6 21. 2 13. 3 Primary endpoint Tournigand et al, JCO 2006
OPTIMOX Studies FOLFOX 4 until TF OPTIMOX-1 FOLFOX 7 s. LV 5 FU 2 m. FOLFOX 7 OPTIMOX-2 m. FOLFOX 7 s. LV 5 FU 2 m. FOLFOX 7 CFI: Chemotherapy Free Interval
Phase II OPTIMOX 2 Trial: Study Design R A N D O M I Z A T I O N OPTIMOX 1 : maintenance therapy m. FOLFOX 7 x 6 cycles s. LV 5 FU 2 until baseline progression FOLFOX 7 reintroduction m. FOLFOX 7 LV 400 Oxali 100 H 0 OPTIMOX 2 : chemotherapy-free interval m. FOLFOX 7 x 6 cycles No maintenance until progression FOLFOX 7 reintroduction 1 cycle=14 days 5 -FU 3000 H 24 H 48 s. LV 5 FU 2 5 FUb 400 LV 400 5 -FU 3000 H 2 Dose=mg/m 2 H 24 H 48
Phase III Trial Bevacizumab in First. Line MCRC (AVF 2107 g) IFL + placebo (n=411) Previously untreated MCRC (n=923) Primary endpoint: Survival IFL +Bevacizumab (5 mg/kg, q 2 w) (n=402) 5 -FU/LV + bevacizumab (5 mg/kg, q 2 w) (n=110) *Patients receiving Avastin could continue therapy past disease progression in combination with second-line therapy. †
Phase III Trial of Bevacizumab in First-Line MCRC: Efficacy IFL + Placebo IFL + Avastin (5 mg/kg, q 2 w) (n=411) (n=402) P Value Hazard Ratio Median OS (mo) 15. 6 20. 3 <0. 001* 0. 66 PFS (mo) 6. 2 10. 6 <0. 001* 0. 54 ORR (%) 35 45 <0. 01† Duration of response (mo) 7. 1 10. 4
Phase III Trial of Bevacizumab in First-Line MCRC: Survival Median survival: 15. 6 vs 20. 3 mo P<0. 001 Percent surviving 100 80 60 40 Treatment Group 20 IFL + placebo (n=411) IFL + Avastin (n=402) 0 0 6 12 18 Months Error bars represent 95% confidence intervals. 24 30
E 3200: High-dose BEV + FOLFOX 4: Study Design N=822 Previously treated m. CRC R A N D O M I Z E FOLFOX 4 + Bevacizumab (BEV 10 mg/kg q 2 wk) (n=289) FOLFOX 4 (n=290) Bevacizumab (10 mg/kg q 2 wk) (n=243)
E 3200 (FOLFOX + Bevacizumab): Overall Survival 1. 0 P r o b a b i l i t y 0. 9 HR = 0. 76 0. 8 A vs B: p = 0. 0018 0. 7 B vs C: p = 0. 95 0. 6 0. 5 0. 4 0. 3 0. 2 0. 1 0. 0 0 3 6 9 12 15 18 21 24 27 30 33 36 OS (months) A: FOLFOX 4 + bevacizumab B: FOLFOX 4 C: bevacizumab TOTAL DEAD ALIVE MEDIAN 289 290 243 246 257 216 43 33 27 12. 9 10. 8 10. 2
Bevacizumab with 5 -FU/LV: PFS Percent progression-free 100 Hazard ratio = 0. 50 Median PFS: 5. 5 vs 9. 2 (P=0. 0002) 80 5 -FU/LV + Avastin (n=104) 5 -FU/LV + placebo (n=105) 60 40 20 0 0 6 12 18 Months 24 30
Bevacizumab with 5 -FU/LV: Overall Survival Percent surviving 100 Hazard ratio = 0. 79 Median survival: 12. 9 vs 16. 6 mo (P=0. 16) 80 60 40 20 5 -FU/LV + Avastin (n=104) 5 -FU/LV + placebo (n=105) 0 0 6 12 18 Months 24 30
XELOX-1/ NO 16966 Trial: Study Design Recruitment June 2003 – May 2004 Recruitment Feb 2004 – Feb 2005 XELOX n=317 XELOX + placebo n=350 XELOX + bevacizumab n=350 FOLFOX-4 n=317 FOLFOX-4 + placebo n=351 FOLFOX-4 + bevacizumab n=349 Initial 2 -arm open-label study (n=634) Protocol amended to 2 x 2 placebo-controlled design after bevacizumab phase III data became available (n=1400)
Effect of Bevacizumab on PFS estimate 1. 0 HR=0. 83 [97. 5% CI 0. 72– 0. 95] 0. 8 p=0. 0023 0. 6 0. 4 0. 2 0 9. 4 m 8. 0 m 0 3 6 9 12 15 18 21 months XELOX + placebo (X+P) FOLFOX-4 + placebo (F+P) VS XELOX + bevacizumab (X+A) FOLFOX-4 + bevacizumab (F+A)
CRYSTAL: study design FOLFIRI First-line m. CRC, unresectable (n=1198) R FOLFIRI + cetuximab • Primary endpoint: PFS • Secondary endpoints: OS, ORR, safety Van Cutsem, et al. NEJM 2009
CRYSTAL: K-ras WT efficacy update CRYSTAL update Cetuximab plus FOLFIRI vs FOLFIRI (n=666) OS, months 23. 5 vs 20. 0 (HR=0. 796; p=0. 0094) PFS, months 9. 9 vs 8. 4 (HR=0. 696; p=0. 0012) ORR, % 57. 3 vs 39. 7 (OR=2. 0693; p<0. 0001) Van Cutsem, et. ECCO-ESMO 2009 (abstract No. 6077) Lang, et al. ECCO-ESMO 2009 (abstract No. 6078)
CRYSTAL K-ras WT efficacy update: significantly longer OS in the cetuximab + FOLFIRI group Probability of overall survival Cetuximab +FOLFIRI (n=316) FOLFIRI (n=350) 1. 0 0. 9 No. of events Median OS [95% CI] HR (95%): p-value: 0. 8 0. 7 0. 6 288 20. 0 [17. 4– 21. 7] 0. 796 [0. 670– 0. 946] 0. 0094 (log-rank) 242 23. 5 [21. 2– 26. 3] 0. 5 0. 4 0. 3 Cetuximab+FOLFIRI 0. 2 0. 1 0 0 6 12 18 24 30 36 42 48 54 60 Time (months) Number of patients: FOLFIRI Cetuximab + FOLFIRI 350 311 246 179 132 92 64 48 18 2 0 316 281 237 198 144 108 82 65 21 4 0 Van Cutsem, et al. ECCO-ESMO 2009 (abstract no. 6077)
OPUS: study design FOLFOX 4 First-line m. CRC unresectable (n=337) R FOLFOX 4 + cetuximab • Phase II • Primary endpoint: ORR • Secondary endpoints: rate of curative metastatic surgery, duration of response, disease control rate, PFS, OS, safety Bokemeyer, et al. JCO 2009
OPUS: K-ras WT efficacy update OPUS update Cetuximab plus FOLFOX 4 vs FOLFOX 4 (n=179) OS, months 22. 8 vs 18. 5 (HR=0. 855; p=0. 3854) PFS, months 8. 3 vs 7. 2 (HR=0. 567; p=0. 0064) ORR, % 57. 3 vs 34. 0 (OR=2. 5512; p=0. 0027) Bokemeyer et al. ECCO-ESMO 2009 (abstract No. 6079)
PRIME: study design FOLFOX q 2 weekly First-line m. CRC (n=1183) R FOLFOX + panitumumab q 2 weekly • • • Primary endpoint: PFS by K-ras status Secondary endpoints: OS, ORR, duration of response, time to response, safety Study population Originally designed to study the overall population • design amended to analyse outcomes with respect to the presence or absence of K-ras mutations • tumour K-ras status not ascertained in all patients (<10%) Douillard, et al. ECCO/ESMO 2009 (abstract No. 10 LBA)
PRIME (first-line FOLFOX ± panitumumab): Kras WT PFS (%) Events, Median (95% CI) n (%) months 100 80 Panitumumab + FOLFOX 70 FOLFOX 90 199 (61) 9. 6 (9. 2– 11. 1) 215 (65) 8. 0 (7. 5– 9. 3) HR=0. 80 (95%CI: 0. 66– 0. 97) p=0. 02 60 50 40 30 20 10 0 0 1 2 3 4 5 6 7 8 9 10 11 12 13 14 15 16 17 18 19 20 21 22 23 Time (months) No. at risk FOLFOX + panitumumab 325 313 294 284 254 243 204 187 156 145 111 FOLFOX 331 321 296 281 242 231 185 172 127 113 82 94 65 73 41 57 36 39 29 28 22 22 16 14 12 10 10 4 2 1 2 0 1 0 0 Douillard, et al. ECCO/ESMO 2009 (abstract No. 10 LBA)
PRIME (first-line FOLFOX ± panitumumab): K-ras WT OS (interim analysis) Events, Median (95% CI) n (%) months Proportion alive (%) 100 90 Panitumumab + FOLFOX 106 (33) NE (20. 3–NE) 124 (37) 18. 8 (17. 2–NE) HR=0. 83 (95%CI: 0. 64– 1. 08) p=0. 16 80 70 60 50 40 30 20 10 0 0 1 2 3 4 5 6 7 8 9 10 11 12 13 14 15 16 17 18 19 20 21 22 23 24 25 26 Time (months) No. at risk FOLFOX + panitumumab 321 315 313 310 297 288 278 266 248 226 203 187 165 141 119 102 88 FOLFOX 331 325 320 311 301 289 281 272 265 243 219 193 177 152 125 110 87 70 65 52 47 37 29 24 14 15 9 9 4 5 1 2 1 0 0 0 Douillard, et al. ECCO/ESMO 2009 (abstract No. 10 LBA)
PRIME (first-line FOLFOX ± panitumumab): response rates Panitumumab + FOLFOX (n=317) FOLFOX (n=323) 55 (50– 61) 48 (42– 53) CR 0 0. 3 PR 55 47 SD 30 36 PD 7 11 ORR (%) (95% CI)* *p=0. 068 (descriptive) Douillard, et al. ECCO/ESMO 2009 (abstract No. 10 LBA)
Liver metastatic disease • Liver resection issues: Resectability Timing; treatment selection… • Chemo: FOLFOX vs. FOLIRI vs. FOLFOXIRI (FOLIRIOX) bevacizumab: EGFR inhibitor (K-ras, B-raf), PIK 3, and more….
Defining Therapeutic Settings • Neoadjuvant therapy Resectable hepatic metastases Preoperative systemic therapy followed by postresection therapy • Adjuvant therapy Resectable hepatic metastases Postresection systemic/regional therapy • Conversion therapy Unresectable hepatic metastases Systemic/regional therapy in an attempt to make the metastases resectable
Liver Metastases in CRC • Survival directly related to liver metastases resectability 5 -y OS = 40%-58% following successful resection As high as 71. 5% following solitary resection • Redefining resectability Before • Required limited number of metastases (3 to 4) Now • Number of metastases a relative decision factor • Anticipated negative surgical margins • ≥ 30% liver mass • Associated with a near-zero operative mortality rate and longterm survival OS = overall survival. 1. Vauthey et al. Semin Oncol. 2005; 32: S 118. 2. Aloia et al. Arch Surg. 2006; 141: 460. 3. Zorzi et al. Br J Surg. 2007; 94: 274. 4. Vauthey et al. Ann Surg. 2004; 239: 722.
Liver. Met. Survey Registry: Prognostic Importance of Intrahepatic Tumor Burden • International, Internet-based registry 2122 patients Not a randomized, controlled clinical trial • Median, 5 -y, and 10 -y OS were 46 months, 42%, and 26%, respectively • Independent poor prognostic factors >3 metastases (P<0. 0001) Bilateral metastases (P=0. 0002) Largest metastasis >5 cm (P=0. 03) • Preoperative CT improved survival only in patients with >5 metastases Adam et al. ASCO, 2006. Abstract 3521.
66 patients Liver only mets with CR on CT scan after Chemotherapy Nordlinger JCO 2008 Surgery Macroscopic cancer: 20 ‘No lesion’: 46 15 site resected 31 sites left in place Viable tumor cells: 12 In situ recurrence: 23 55/66 (83%) of Metastases were not ‘cured’
Treatment Options & How Long Maru DM et al. ASCO GI 2009, abs: 295 Cycles 1~8 cycles FOLFOX + Bev p Overall p CR CR RR 38/81 44/76 0. 0001 57% 0. 73 (43%) (58%) 7 8 ≥ 9 12/40 (30%) 15/22 (68%) 0. 0011 55% Cycles Sinusoidal Injury Liver Insufficiency 1~8 cycles 26% 4% ≥ 9 42% 11% p 0. 017 0. 035
Adjuvant • Goal of Adjuvant Chemotherapy To eradicate micrometastases, therefore To increase cure/survival rate after curative surgical resection • 5 -FU (Capecitabine) vs. FOLFOX (XELOX) • Avastin? • Cetuximab in WT patients?
Standard Adjuvant therapy (1998 -2004) (Based on INT 0089) Five-year DFS (%) 56 Five-year OS (%) 5 -FU/LV(HD), 6 months Roswell Park 5 -FU/LV(LD), 6 months Mayo 59 65 60 66 5 -FU/LV/LEV, 7 months 60 67 5 -FU/LEV, 12 months Number of patients = 3759 Haller, D. G. et al. J Clin Oncol; 23: 8671 -8678 2005 63
X-ACT trial in adjuvant treatment of Dukes’ C colon cancer Recruitment 1998– 2001 Capecitabine: 1250 mg/m 2 twice daily, d 1– 14, q 21 d n = 1 004 Chemo-naïve Dukes’ C, resection £ 8 weeks 24 weeks • 1° endpoint: disease-free survival (DFS) • 2° endpoints relapse-free survival (RFS) overall survival Bolus 5 -FU/LV: 5 -FU 425 mg/m 2 plus LV 20 mg/m 2, d 1– 5, q 28 d n = 983 tolerability (NCIC CTC) pharmacoeconomics Qo. L
Primary endpoint met and trend to superior DFS (ITT) 1. 0 Capecitabine (n=1 004) 5 -FU/LV (n=983) Estimated probability 3 -year 64. 2% 60. 6% HR = 0. 87 (95% CI: 0. 75– 1. 00) p=0. 0528 0. 6 0. 4 0 1 2 3 Years 4 5 6
Phase III MOSAIC FOLFOX 4 R 2, 236 pts 148 Centers 20 Countries 6 months (12 Cycles) LV 5 FU 2 (de Gramont) Aim: 25% decrease in recurrent risk at 3 years (Expect 3 -year DFS: 79% vs. 73%)
MOSAIC 4 -yr DFS: ASCO 2005 1. 0 0. 9 0. 8 DFS probability 0. 7 8. 6% (6. 9%) 0. 6 0. 5 0. 4 0. 3 FOLFOX 4 LV 5 FU 2 HR [95% CI]: 0. 75 [0. 62 – 0. 89] 0. 2 (0. 76 [0. 62 -0. 92]) 0. 1 0. 0 0 6 12 Data cut-off: January 16, 2005 18 24 30 36 42 48 54 60 66
DFS Disease-free Survival in Stage III Patients: N 1 & N 2 1. 0 0. 9 0. 8 0. 7 0. 6 0. 5 0. 4 0. 3 0. 2 0. 1 0. 0 7. 2% 11. 5% FOLFOX 4 – N 1 LV 5 FU 2 – N 1 FOLFOX 4 – N 2 LV 5 FU 2 – N 2 0 6 12 18 De. Gramont, A, et al Proc. ASCO GI Jan. 2005 24 HR: 0. 76 HR: 0. 72 30 36 Months 42 48 54 60 66
NSABP C-07 FU 500+LV 500 weekly x 6 every 8 weeks x 3 R FU 500+LV 500 weekly x 6 every 8 weeks x 3 + Oxaliplatin 85 weeks 1, 3 & 5 of each 8 week cycle N = 2492 Primary endpoint: 3 -year DFS
NSABP C-07 Trial (FLOX vs. FU/LV) 3 -year Disease-free Survival 1 Ev # 3 -yr DFS FLOX 272 76. 5% FU/LV 332 71. 6% 0. 9 0. 8 0. 7 p < 0. 004 HR: 0. 79 [0. 67 – 0. 93] 0. 6 21% Risk Reduction 0. 5 0 1 2 3 4
NSABP C-07: toxicity and mortality NSABP C-07: Percentage of patients 10 8. 0% 0. 5% at 12 months FLOX 8 FU/LV 6 4. 7% 4 2 2. 8% 1. 2% 1. 1% 1. 0% 0 Gr 3 NCI-sanofi neurotoxicity * Diarrhea requiring hospitalization and dehydration due to bowel thickening Diarrhea/dehydration* Deaths Wolmark et al. ASCO 2005; Abstract LBA 3500
C-07 and MOSAIC 3 -yr DFS: Stage II and III 3 -yr DFS Δ HR C-07 76. 5 % 4. 9 % 0. 79 MOSAIC 77. 9 % 5. 1 % 0. 77
Adjuvant XELOX vs 5 -FU/LV: NO 16968 (XELOXA) Phase III trial R A n=944 N D Chemo/ O radiotherapy-naive M I stage III colon ≤ 8 weeks since resection S A N=1886 T I O n=942 N XELOX (6 months) capecitabine 1000 mg/m 2 bid d 1– 14 oxaliplatin 130 mg/m 2 d 1 q 3 w 8 cycles Bolus 5 -FU/LV (6 months) Mayo Clinic [n=664] or Roswell Park [n=278] • Primary endpoint: superiority of DFS • Secondary endpoints: RFS, OS, tolerability
Baseline tumour characteristics XELOX n=944 5 -FU/LV Mayo n=664 5 -FU/LV Roswell n=278 3 8 74 15 2 7 73 18 6 8 76 9 65 35 64 36 67 33 23 26 51 26 24 50 23 22 55 Primary tumour (%) T 1 T 2 T 3 T 4 Regional lymph nodes (%) N 1 N 2 Number of lymph nodes examined <8 8– 12 >12 Schmoll et al. JCO 2007
Similar rates of grade 3/4 AEs (>5%) in all arms Patients (%) 40 XELOX (n=938) 5 -FU/LV Mayo (n=657) 5 -FU/LV Roswell (n=269) 30 20 10 * *Not reported Safety population eu r to ose xi n ci so ty r y N N vo au m se iti a ng gr Ne an u ul tro oc pe yt ni op a/ en ia (g FS H St om at ra de iti 3 s ea ho rr ia D ) * 0 Schmoll et al. JCO 2007
Dose intensity / treatment modifications 5 -FU/LV (n=926) Mayo (n=657) RP (n=269) XELOX (n=938) Median dose intensity* 85% 87% 84% Cape 84% Oxal 87% Reductions 47% 49% 44% Cape 30% Oxal 35% Interruptions 15% 8% 32% Cape 14% Oxal 0% Delays 37% 42% 26% Cape 56% Oxal 54% *Ratio dose received vs planned
5 -year DFS: benefit with XELOX maintained and increased over time 3 -year DFS XELOX 5 -FU/LV 1. 0 4 -year DFS 5 -year DFS 70. 9% 68. 4% 66. 5% 62. 3% 66. 1% 59. 8% 0. 8 Δ at 3 years: 4. 5% 0. 6 Δ at 4 years: 6. 1% 0. 4 Δ at 5 years: 6. 3% 0. 2 0. 0 0 1 2 3 Years ITT population 4 5 6
Cross-trial comparison of MOSAIC and XELOXA: OS in stage III disease 1. 0 XELOXA (57 mo) 0. 8 MOSAIC 1 (81. 9 mo) 0. 8 0. 6 0. 4 XELOX FOLFOX 4 5 -FU/LV LV 5 FU 2 0. 4 4 Years ITT population 6 8 0 2 4 Years 6 8
Cross-trial comparison of MOSAIC and XELOXA: OS in stage III disease NO 16968 (XELOXA)* 1. 0 MOSAIC 1** 5 -yr OS 6 -yr OS XELOX (n=944) 77. 6% – FOLFOX 4 (n=672) – 72. 9% 0. 8 0. 6 0. 4 0 1 2 3 4 5 6 7 8 Years *Median observation time: 57. 0 months **Median follow-up: 81. 9 months ITT population 1. André et al. JCO 2009
NO 16968 subgroup analysis of DFS by age 3 -year DFS XELOX 5 -FU/LV Hazard ratio (95% CI) <65 vs. ≥ 65 years <65 years, n=1142 72% 69% 0. 80 (0. 65, 0. 98) ≥ 65 years, n=744 68% 62% 0. 81 (0. 64, 1. 03) <70 years, n=1477 72% 69% 0. 79 (0. 66, 0. 94) ≥ 70 years, n=409 66% 60% 0. 87 (0. 63, 1. 18) <70 vs. ≥ 70 years ITT population
NO 16968 subgroup analysis of OS by age 5 -year OS XELOX 5 -FU/LV Hazard ratio (95% CI) <65 vs. ≥ 65 years <65 years, n=1142 80% 77% 0. 87 (0. 67, 1. 13) ≥ 65 years, n=744 73% 70% 0. 90 (0. 68, 1. 19) <70 years, n=1477 80% 76% 0. 86 (0. 69, 1. 08) ≥ 70 years, n=409 69% 67% 0. 94 (0. 66, 1. 34) <70 vs. ≥ 70 years ITT population
Irinotecan combinations: NO survival advantage in stage III Trial DFS HR DFS ∆ (%) p OS HR OS ∆ (%) p CALGB 898031 NR NR 0. 85 NR NR 0. 74 PETACC-32 0. 90 2. 4 0. 11 NR 2. 3 0. 09 ACCORD-23 0. 89 3. 1 0. 44 1. 09 1 0. 69 Irinotecan as Adjuvant setting: No Benefit, more toxicities no Role NR = not reported 1. Saltz et al. JCO 2007 2. Van Cutsem et al. JCO 2009; 3. Ychou et al. Ann Oncol 2009
NSABP C-08: Bevacizumab as Adjuvant Setting Stage III colon cancer (n=2, 710) m. FOLFOX 6 alone m. FOLFOX 6 + Bevacizumab 5 mg/kg every 2 weeks 24 weeks Observation Bevacizumab 5 mg/kg every 2 weeks 24 weeks • Primary endpoint: DFS at 3 years • Secondary endpoints: survival and tolerability • Patient recruitment completed 10/06
NSABP-08: DFS % Role of Bevacizumab in Adjuvant Setting: - Not shown yet - Should NOT be used as least right now. Ev 3 y. DFS m. FF 6+B 291 77. 4 m. FF 6 312 75. 5 Yrs HR= 0. 89 P = 0. 15
BO 17920 (AVANT) Phase III Trial FOLFOX 4 Observation FOLFOX 4 + Avastin (5 mg/kg every 2 weeks) Avastin alone (7. 5 mg/kg every 3 weeks) XELOX + Avastin (7. 5 mg/kg every 3 weeks) Avastin alone (7. 5 mg/kg every 3 weeks) 24 weeks Surgery for high risk stage II + stage III colon cancer (n=3, 450) Duration of treatment phases • Primary endpoint: DFS at 3 years for stage III • Secondary endpoints: OS and safety • Accrual completed Q 2 2007
AVANT: patient recruitment timeline l Opened: December 2004 l Closed: June 2007 l Total accrual: 3451 patients l Average monthly accrual: 115 patients Accrual temporarily on hold due to DSMB decision: February–May 2006 Hoff, et al. ECCO-ESMO 2009 (abstract No. 6010)
AVANT: patient demographics FOLFOX 4 (n=1151) FOLFOX 4 + Avastin (n=1155) XELOX + Avastin (n=1145) II (high risk) 192 (17) 194 (17) 187 (16) III N 1 III N 2 585 (51) 370 (32) 590 (51) 370 (32) 572 (50) 380 (33) Male, % 57 51 55 Median age, years 58 58 58 ECOG PS, % 0 1 86 14 Characteristic Disease stage, n (%) All patients randomised Hoff, et al. ECCO-ESMO 2009 (abstract No. 6010)
AVANT: mortality FOLFOX 4 (n=1126) FOLFOX 4 + Bev (n=1145) XELOX + Bev (n=1135) 60 day 2 (0. 18) 4 (0. 35) 5 (0. 44) 6 month 9 (0. 80) 5 (0. 44) 11 (0. 97) 18 month 15 (1. 33) 11 (0. 96) 17 (1. 50) Death ratea, N (%) a. Excludes death after relapse
AVANT: adverse events of special interest for Avastin* FOLFOX 4 (n=1126) Category, n (%)a FOLFOX 4 + Avastin XELOX + Avastin (n=1145) (n=1135) Grade 3– 5 Bleeding/haemorrhage 0. 6 1. 2 0. 4 Hypertension 1. 1 10. 4 9. 6 Proteinuria 0. 1 1. 0 Fistula/abscess 0. 3 1. 4 0. 8 GI perforation 0. 1 0. 7 0. 2 Wound healing complication 0. 4 0. 3 0. 4 Venous thromboembolism 5. 5 8. 3 4. 6 Arterial thromboembolism 1. 0 1. 6 1. 5 *AE onset within 183 days after last drug intake Hoff, et al. ECCO-ESMO 2009 (abstract No. 6010)
Adjuvant Therapy: Cetuximab ‘Standard’ Mutation K-Ras mutation status WT R A N D O M I Z A T I O N m. FOLFOX 6 6 m m. FOLFOX 6 x 6 m + cetuximab - Complicated because of K-Ras mutation & EGFR inhibitors issue - Study terminated in 11/09 by DSMC because of no clear benefits in the study arm and more death on also
• Study Closed • There is no difference in efficacy • There likely more deaths in the cetuximab arm • All patients who in the cetuximab arm who were still on treatment were treated only with FOLFOX
QUASAR: Adjuvant vs. Observation in Stage II CRC • 150 centers in 17 countires, 3239 pts. Observation 1617 ‘Uncertain Indication’ 5 -FU (370 mg/m 2) with low dose FA, 1622 -Large randomized trial -Pragmatic trial
Chemo Observation P value Relative risk 5 -yrs recurrence 22. 3% 26. 2% 0. 001 0. 78 5 -yrs survival 80. 3 77. 4 0. 02 0. 83
MOSAIC: no significant improvement in 6 -year OS in stage II 1. 0 Stage II ∆=0. 1% p=0. 986 0. 8 Stage III ∆=4. 2% p=0. 023 0. 6 FOLFOX 4 LV 5 FU 2 Stage II HR=1. 00 Stage III HR=0. 80 0. 4 0. 2 0. 0 0 1 2 3 4 Years 5 6 7 8 André et al. JCO 2009
E 5202: stage II colon cancer m. FOLFOX 6 Risk Assessment 18 q, MSI (Goal N=3125) High Risk (MSS and 18 q LOH R Low Risk (MSI or w/o 18 q. LOH) m. FOLFOX & Bevasucimab Observation
Adjuvant Therapy: Stage III Colon Cancer • FOLFOX or FLOX for 6 months • XELOX for 6 months • 5 -FU/LV for 6 -8 months - RPMI schedule - Mayo Clinic schedule - De. Gramont infusional schedule • Capecitabine monotherapy for 6 months Role for Bevacizumab remains unclear should not be used outside of clinical trial setting No role of EGFR inhibitors
Conclusion • Metastatic CRC: median OS 2 yrs. FOLFOX (XELOX) and FOLFIRI are the backbone as 1 st or 2 nd line Off-on vs. maintenance (OPTIMOX) Bevacizumab should be considered when it is available K-Ras status should be tested and considered cetuximab in WT • Importance of Resctability Assessment: Pare-operative chemo for pts with liver mets, Timing, Regimens, other local therapies to de-bulk (RFA, TACE…) • Adjuvant: Stage III: • FOLFOX/XELOX, • 5 -FU or Capecitabine for those not candidate for oxaliplatin • Irinotecan, bevacizumab, cetuximab no role. Stage II: • Studies for searching those will be benefit from
Future: ‘Personalized’ Treatment vs. ‘Optimized’ Therapy Personalized therapy non-responders and toxic responders All patients with same diagnosis Standard therapy Responders and Patients Not Predisposed to Toxicity
Individualized Risk Assessments Using a Recurrence Nomogram Locate patient’s CEA value on the CEA axis. Draw a line up to the “Points” axis Repeat process for each of the remaining axes Sum the points from each variable and locate on “Total Points” axis www. nomograms. org Weiser MR, et al. J Clin Oncol. 2008; 26(3): 380 -385. Draw a line from the total points to the “ 5 -yr or 10 -yr freedom from recurrence” axis to ascertain the patient’s specific risk of recurrence value
QUASAR: Pre-Specified Primary Endpoint: Recurrence Risk Is there a significant relationship between the risk of recurrence and the pre-specified continuous Recurrence Score in stage II colon cancer patients randomized to surgery alone? RECURRENCE SCORE Calculated from Tumor Gene Expression STROMAL FAP INHBA BGN CELL CYCLE Ki-67 C-MYC MYBL 2 GADD 45 B REFERENCE ATP 5 E GPX 1 PGK 1 UBB VDAC 2
QUASAR Results: Colon Cancer Recurrence Score Predicts Recurrence Following Surgery Prospectively-Defined Primary Analysis in Stage II Colon Cancer (n=711) 35% Risk of Recurrence at 3 years 30% 25% 20% 15% 10% p=0. 004 5% 0% | | 0 ||| | | | ||| ||||||| |||||||||||||||||||||||||||||||||||||||||||||||||||| |||| ||| | | | || |||| | 10 20 30 40 Recurrence Score 50 60 |||||| | 70
Future: • Prognostic vs. predictive factors Tumor biology • Translational Research: to ‘what level’ • Pharmacogenetics vs. Pharmacokinetics Lymph node status Cancer Outcome • Changes of natural history • Timely Advances in Sciences and techology Patient (Host) biology Surgical technique Access to care • Tissue… • Cost vs. Effectiveness Distant metastasis