Systematic Risks and Nonlinear Market Models in International


 n n Insight from higher")

: n n Develop and test a cubic-market model, which shows")
: § n When up and down markets are tested separately,")

 Non-increasing absolute risk")

 Propose an")
 for")


 and delta (Cokurtosis) estimation")

: significance tests")


, which is")


 § This paper also develops and tests a cubic market")
- Slides: 45
Systematic Risks and Nonlinear Market Models in International Size and Momentum Strategies Daniel Chi-Hsiou Hung
Research questions asked: Do higher order Capital Asset Pricing Models better describe asset returns than the standard CAPM? Can higher co-moment risks (coskewness and cokurtosis) capture the stylized effects of momentum and size strategies in international stock markets?
Why and how are they relevant to finance? n n n The beta of the Capital Asset Pricing Model (CAPM) may not be sufficient to describe systematic risks Risk management, where the estimation and control of risk profiles of hedged positions of a company or an investment are critical elements of effective hedging The estimation of the cost of capital of a company, which is directly related to corporate valuation and capital budgeting
Why and how are they relevant to finance? (continued) n n Insight from higher co-moments can be beneficial to the formation of portfolio strategies, especially for hedge funds that typically have highly skewed return distributions Performance of managed funds could be evaluated by comparing average return of a managed portfolio with that of benchmark portfolios that have similar beta, coskewness and cokurtosis
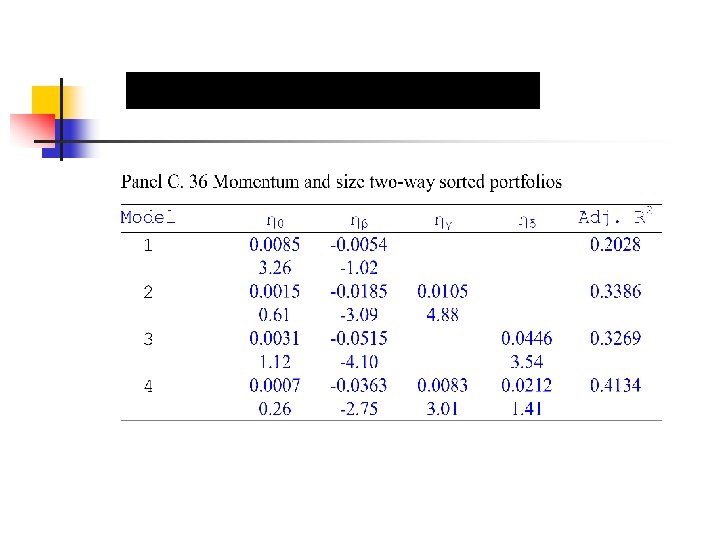
Research questions are answered in many aspects: n n Higher co-moments are priced in 20 international equity markets When higher co-moments are included into the twomoment CAPM, model intercepts become insignificant in all cases for examining the two-way sorted, momentum-size portfolios
Research questions answered (continued): n n Develop and test a cubic-market model, which shows better performance than the linear CAPM in explaining the stylised effects Market models are found to predict payoffs from momentum strategies that buy the past return winners and sell the past return losers
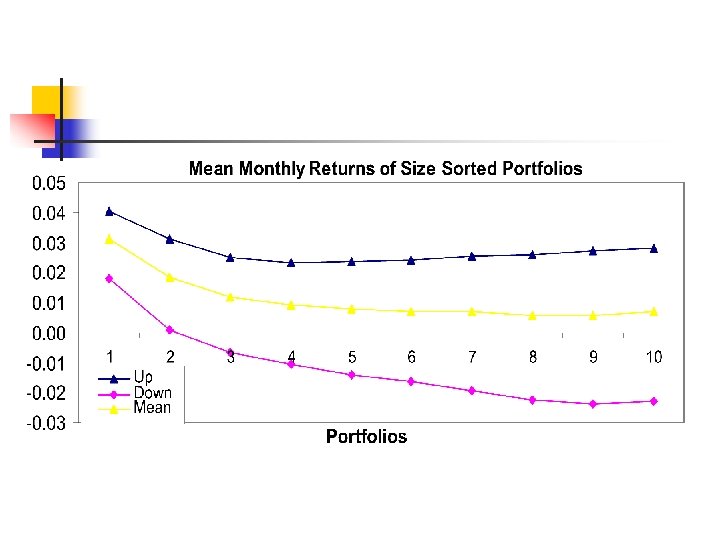
Research questions answered (continued): § n When up and down markets are tested separately, the CAPM beta is highly significant in explaining the crosssection of international stock returns The smallest size decile has positive average returns in both up- and down-markets
Higher order systematic risks and evidence n The intuition for the preference of skewness § If a risky asset has a return distribution with a long tail in the negative direction, it is more likely to have more extreme negative returns. § Other things being equal, a rational investor will require a higher mean rate of return on assets that contribute negative skewness to the market
Higher order systematic risks and evidence n Kraus and Litzenberger (1976) Non-increasing absolute risk aversion leads to a preference for positive skewness. (U. S. stock data) n Harvey and Siddique (2000) Assets that make the portfolio returns more leftskewed are less desirable and should command higher expected returns. (U. S. stock data)
Higher order systematic risks and evidence n The intuition for the preference of kurtosis § Since kurtosis measures the probability of extreme outcomes, a rational investor will prefer shorttailed distributions to long-tailed distributions § Other things being equal, the effect of a risky asset contributing to market leptokurtosis will be to increase the required mean rate of return on the asset
Higher order systematic risks and evidence n n Fang and Lai (1997) Propose an extended model that incorporates a cokurtosis term which is significant in explaining the cross-section of U. S. stock returns, 1969 to 1988 Dittmar (2002) Decreasing absolute prudence leads to an aversion for kurtosis
Higher order systematic risks and evidence § Christie-David and Chaudhry commodity contracts (2001) for U. S. § Hung, Shackleton and Xu (2004) for U. K. stock data
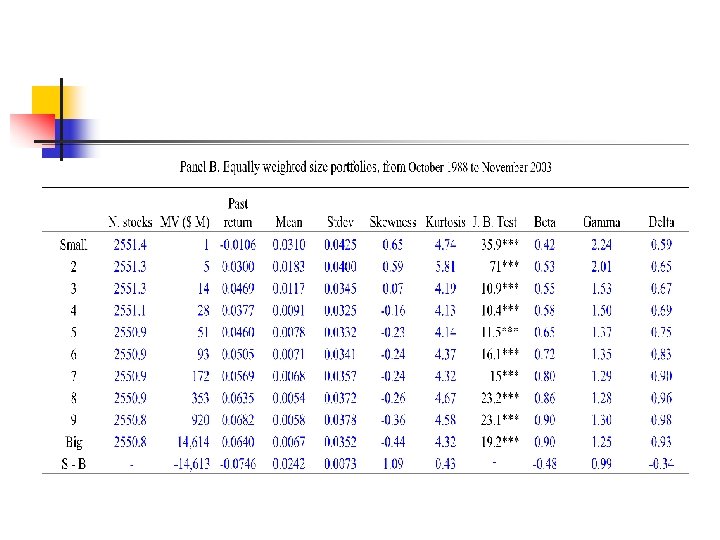
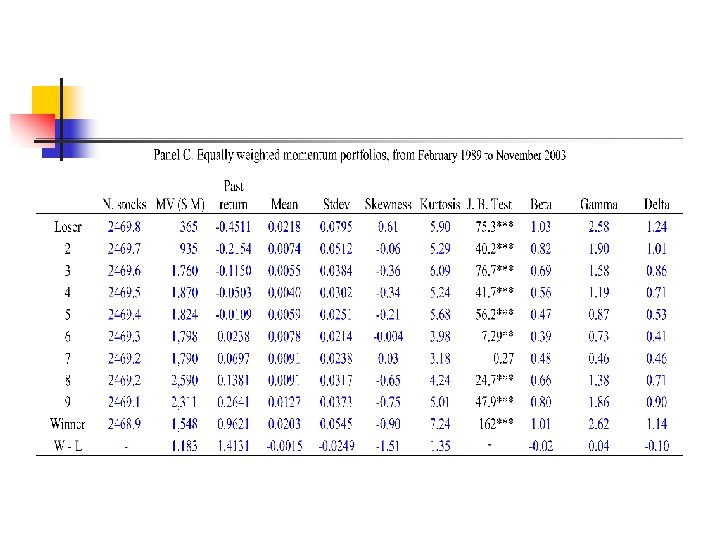
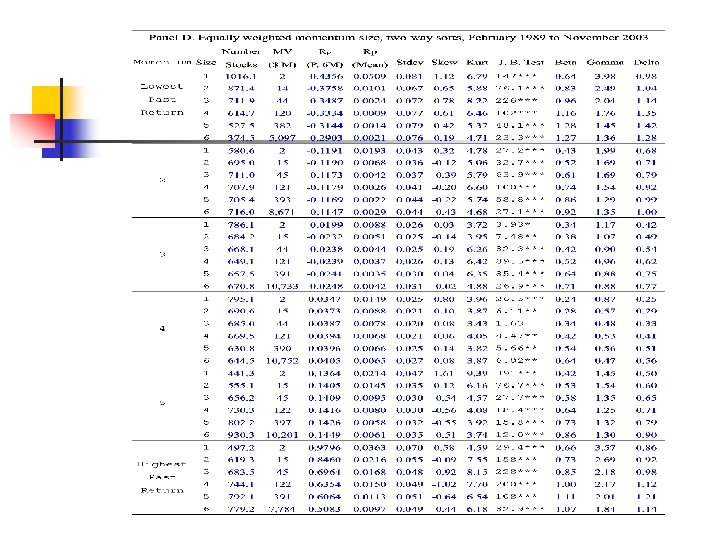
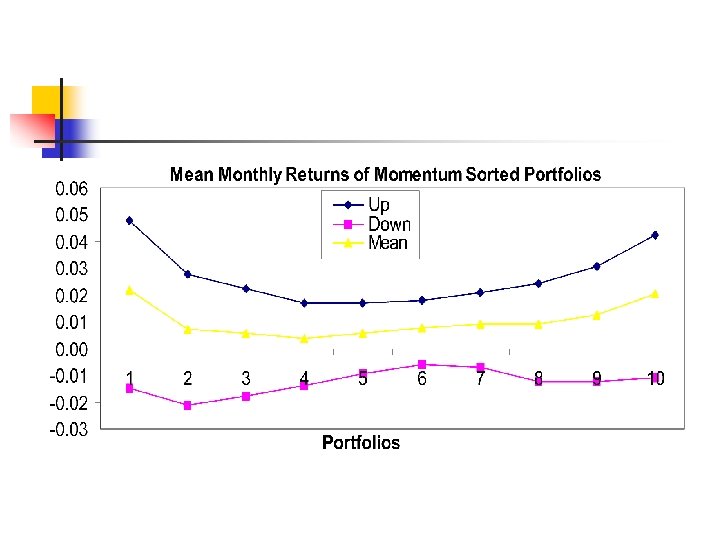
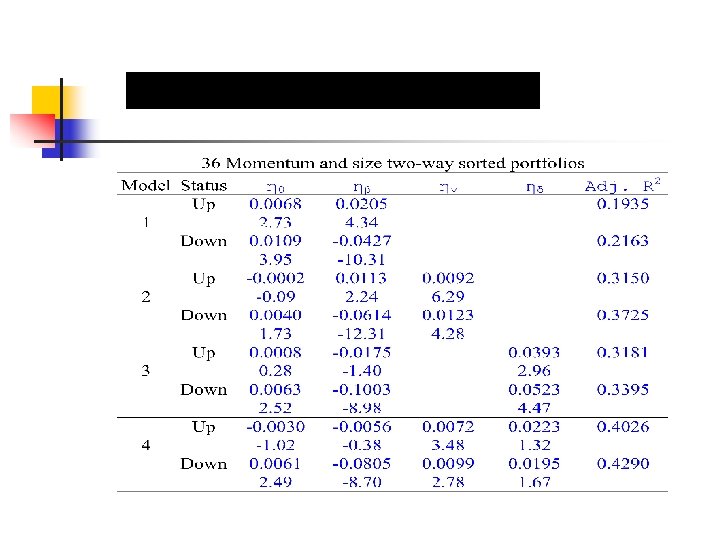
Methodology § Sorts and portfolio formation n n Size/Momentum/Country sorts Equally-weighted deciles are formed examining the characteristics of portfolios for 36 two-way sorted, size-momentum portfolios Returns of the two extreme deciles of size and momentum sorts are examined in the time series
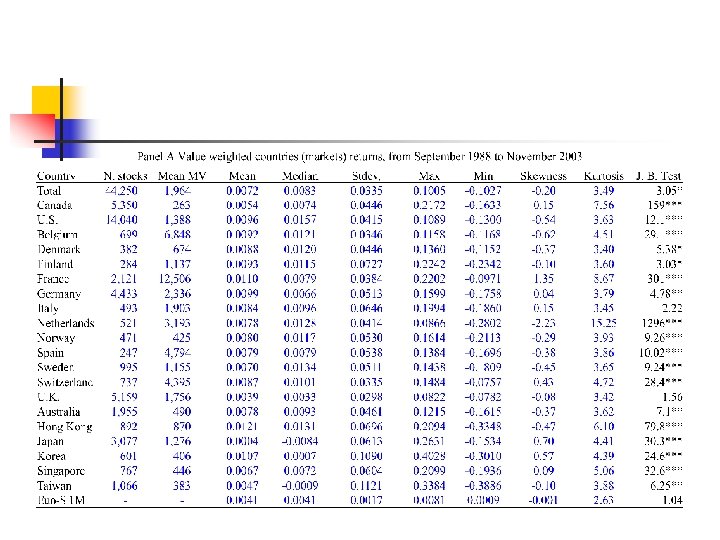
Data and descriptive Statistics § Monthly U. S. dollar returns, from August 1988 to November 2003 (Datastream) § 44, 290 stocks from 20 markets: Canada, U. S. , Belgium, Denmark, Finland, France, Germany, Italy, Netherlands, Norway, Spain, Sweden, Switzerland, U. K. , Australia, Hong Kong, Japan, Korea, Singapore and Taiwan n Market value of equity and the London Financial Times Euro dollar one-month rate (Datastream)
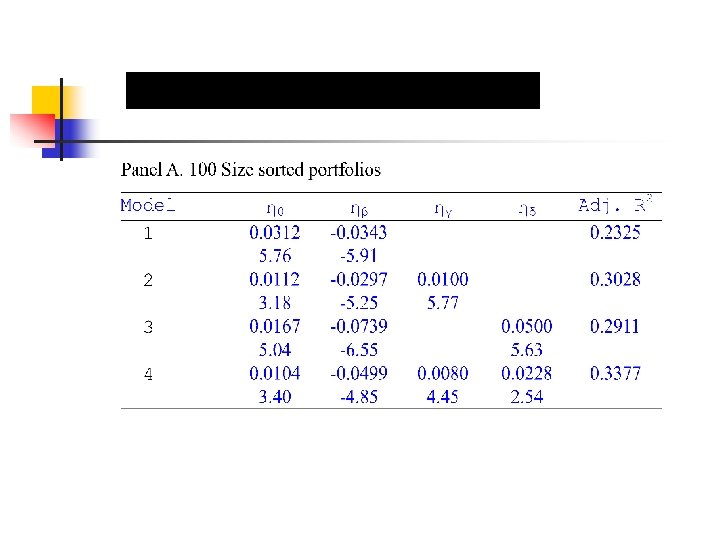
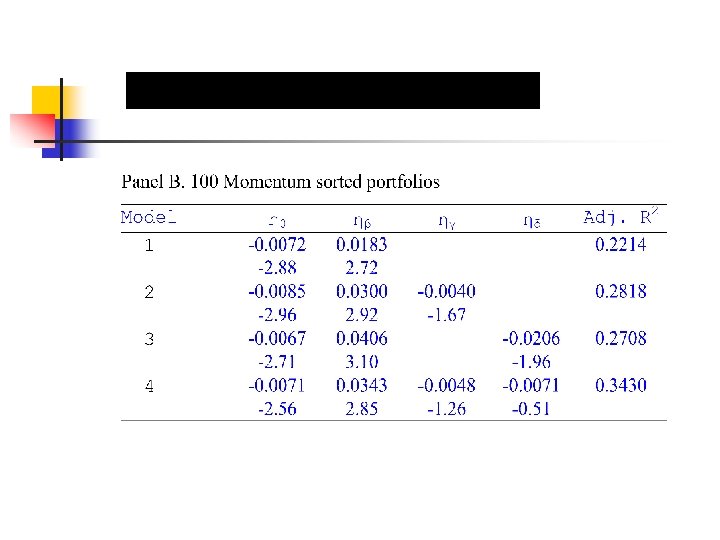
Cross-sectional tests of co-moment pricing § 100 size portfolios § 100 momentum portfolios § 36 two-way sorted, sizemomentum portfolios
Cross-sectional tests of co-moment pricing § Portfolio beta, gamma (Coskewness) and delta (Cokurtosis) estimation (2)
Cross-sectional tests of co-moment pricing § The estimates of βpt, γpt and δpt are used in crosssectional regressions to estimate premia ηβ, η γ and ηδ associated with covariance, coskewness and cokurtosis (4)
Tests of ex-post beta and return relationships 1. Pettengill et al. (1995): significance tests of beta premia should be separately conducted according to up- or down-market status 2. According to the CAPM, the ex ante market premium should be positive and that higher beta portfolios should have higher expected returns than lower beta portfolios
Tests of ex-post beta and return relationships § Ex post, the market premium can be negative in some periods. Thus, averaging all cross-sectional periods might result in an insignificant market premium § Even though the market premium is significant according to Sharp ratio of the market (Eq. 5) (5)
Tests of ex-post beta and return relationships § And also those portfolios with higher betas can have more negative (lower) realised returns than that of lower beta portfolios. Thus reduce the average realised returns of higher beta portfolios. § Consequently, the coefficient for beta might appear insignificantly
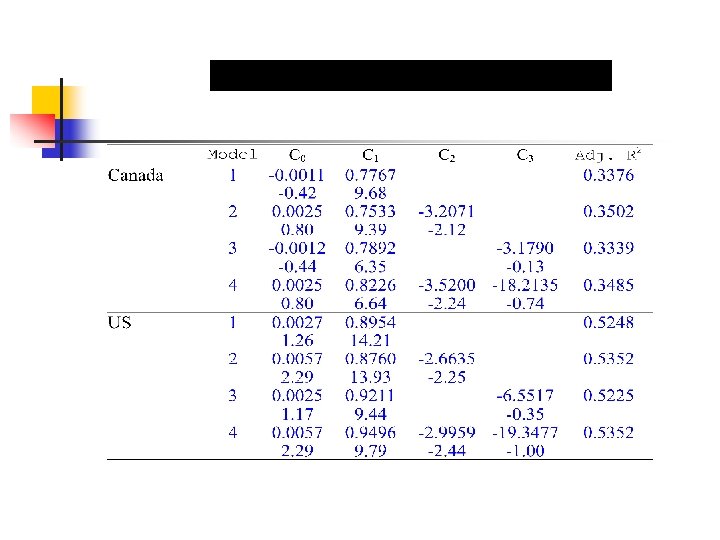
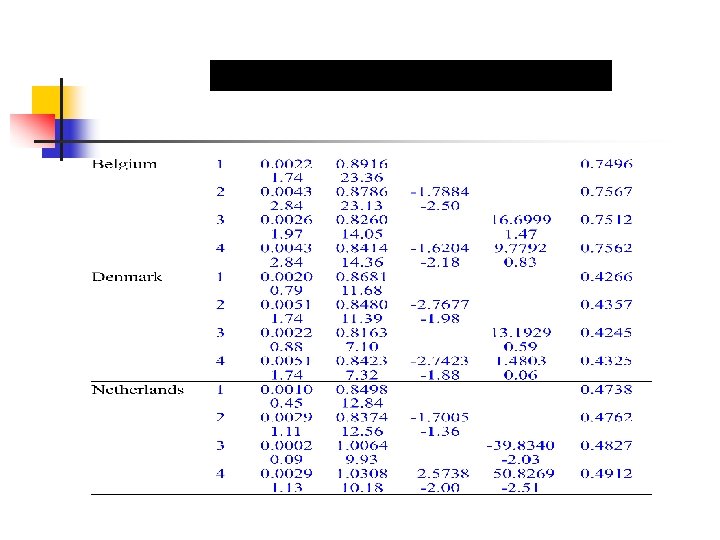
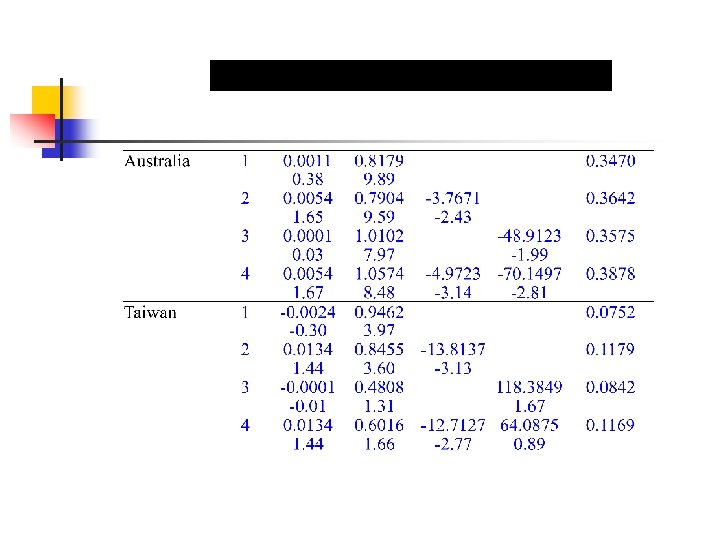
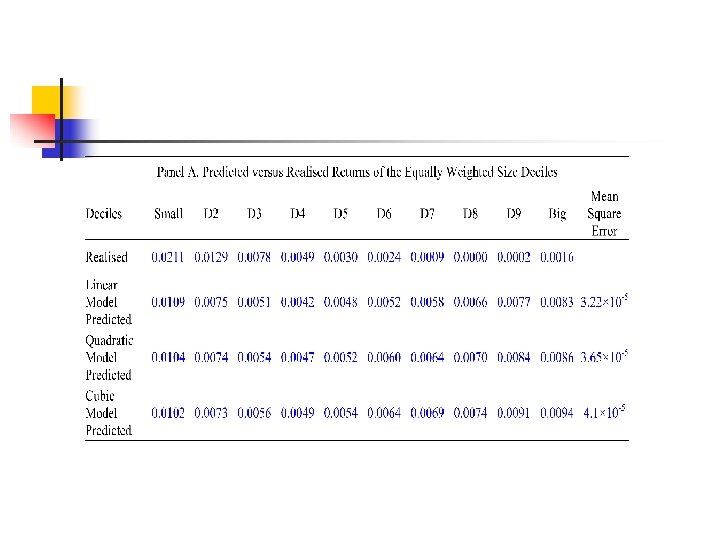
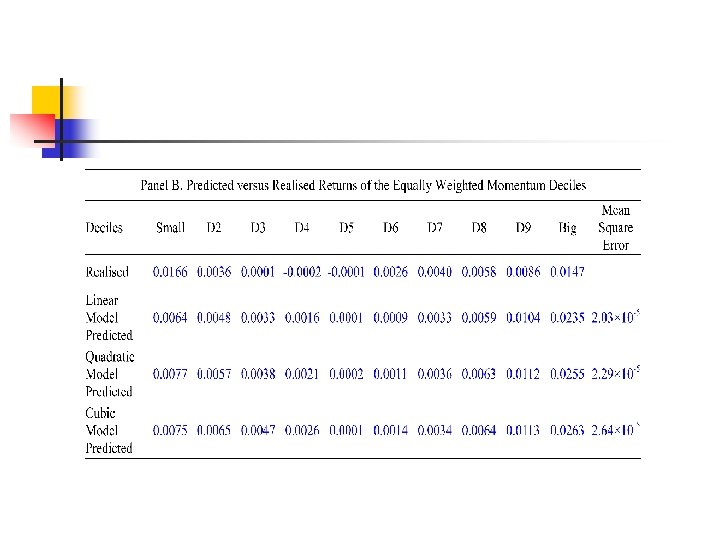
Time-series tests of nonlinear market models § A cubic model (Eq. 6), which is consistent with the four-moment extension of the CAPM is applied to explain the time-series returns of size, momentum and country sorted portfolios (6)
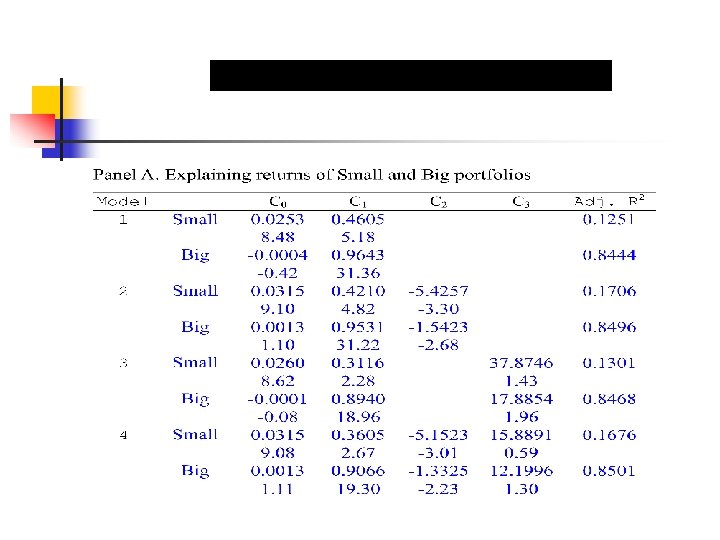
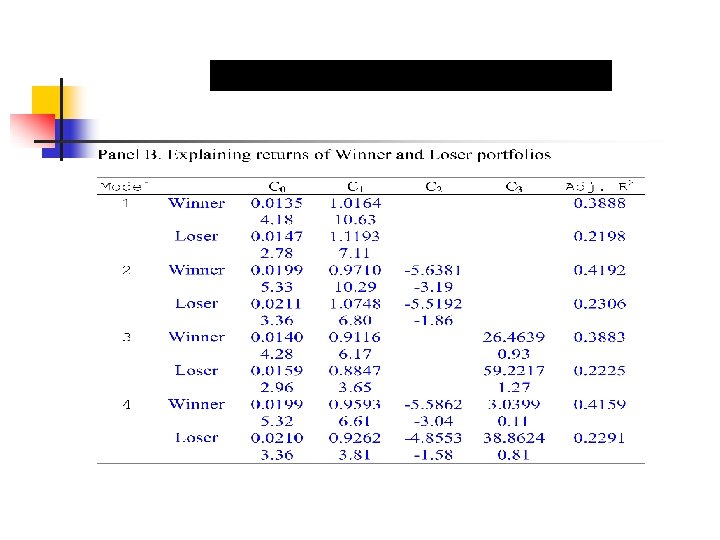
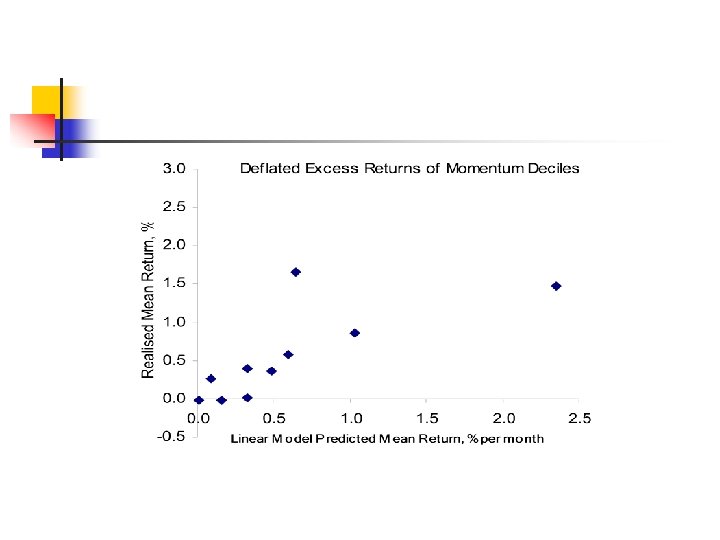
Model predicted returns of momentum and size deciles For each portfolio, the intercept and slope coefficients ( C 0, C 1, C 2 and C 3) of time-series regression model (Eq. 6) are estimated in each month on a rolling basis from the month of portfolio formation to the 5 th month following formation for momentum sorts (the 11 th month for size sorts) (6)
Model predicted returns of momentum and size deciles In the second stage, the estimates of C 0, C 1, C 2 and C 3 for each asset are used to predict excess return of the asset in the next period by utilizing realized excess market return in the next period (10)
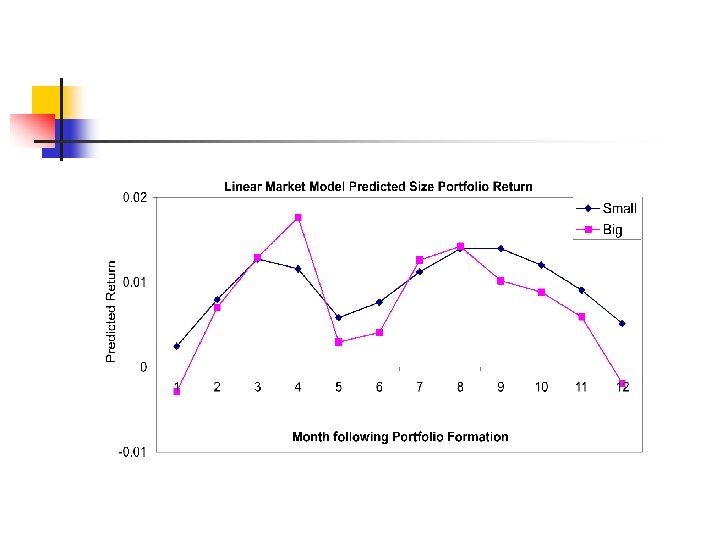
Linear model predicted returns of momentum deciles
Summary and conclusion n n By using a large international stock data, this paper shows evidence for the pricing of higher order systematic risks in returns of size and momentum portfolios The inclusion of coskewness and cokurtosis to the standard CAPM can provide incremental explanatory power on stock returns of size and momentum sorts
Summary and conclusion (continued) § This paper also develops and tests a cubic market model that is consistent with the four-moment CAPM § In time-series tests, the benefit of adopting non-linear market models is evidenced for both size and momentum sorts and also for eight international markets