Systematic Reviews and MetaAnalyses Important Clinical Question Study


 “系統性回顧”的評析 (一) • Are the results of the")
 Study design (研究設計) Diagnostic test 診斷性檢驗或檢查 Prospective, blinded cross-sectional study")
 “系統性回顧”的評析 (二) • What were the results (結果為何)?")
 • Therapy / Prevention (治療/預防) – Relative risk reduction (RRR, 相對風險性降低度) –")
 • Diagnosis (診斷) – Sensitivity (敏感度) – Specificity (特異度) – Positive predictive")


- Slides: 31
Systematic Reviews and Meta-Analyses 系統性回顧與統合分析 Important Clinical Question 某一臨床問題 Study 1 研究一 Study 2 研究二 Study 3 研究三 Study 4 研究四 ……. . . . Study n 研究 n 1. Comprehensive survey of the primary studies of the highest level of evidence 嚴格搜尋高證據度的研究 2. Meta-analysis: A survey in which the results of all included studies are similar enough statistically that the results are combined analyzed as if they were one study 統合分析:以統計方法將結論相似的各研究的結果整合分析做出結論 對臨床問題做出結論
Pitfalls to Meta-Analysis 統合分析的陷阱 • It’s rare that the results of different studies precisely agree • Difficult to have research with exactly the same measuring techniques, definitions of variables • The number of patients in a single study is not large enough to come up with a decisive conclusion • Authors selection bias • Publication bias
Forest Plot 森林圖
Explore Heterogeneity 檢驗異質性 • Statistical Heterogeneity – “Eyeball” test – Cochran chi-square ( Cochran Q ) • Definite heterogeneity (確定有差異) – Cochran Q ( P < 0. 1 ) • Possible heterogeneity (可能有差異) – Cochran Q is not statistically significant – Cochran Q / degrees of freedom (Q/df) > 1 • Heterogeneity unlikely (有差異機會不大) – Cochran Q is not statistically significant – Q/df < 1 – I 2 test • <25%異質性不大;>50%異質性大,不宜統合 • Clinical Heterogeneity – Differences in patients, interventions, outcomes • Methodological Heterogeneity – Different study designs, degree of bias control
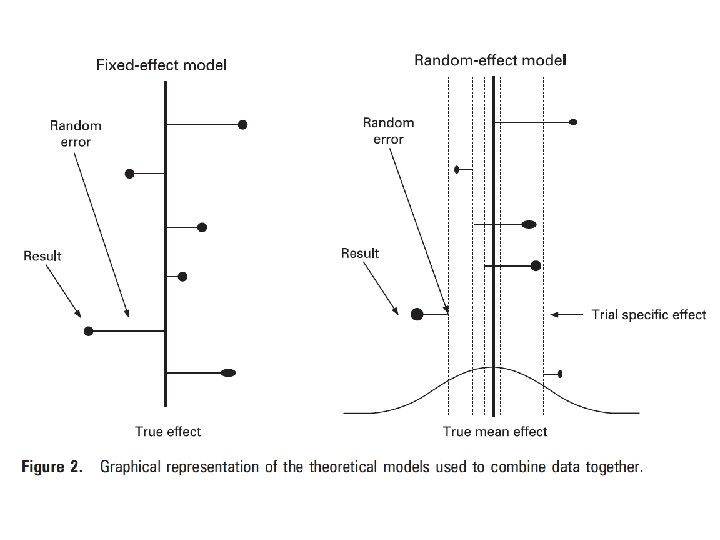
Forest plots of two distinct hypothetical meta-analysis Fixed effect model: The summary result provided the best estimate of an assumed common treatment effect Same summary estimate and 95% CI Random effect model: The summary result gives the average from distribution of treatment effects across studies BMJ 2011; 342: d 549
Publication Bias and Funnel Plot Symmetric Funnel Plot Asymmetric Funnel Plot
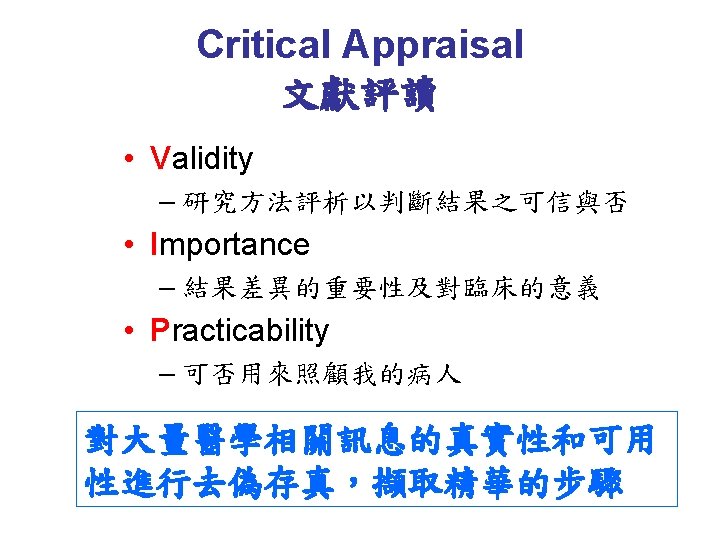
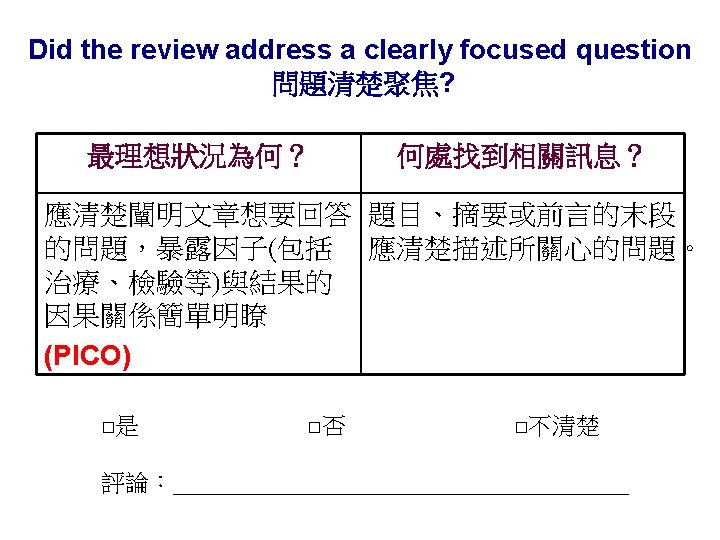
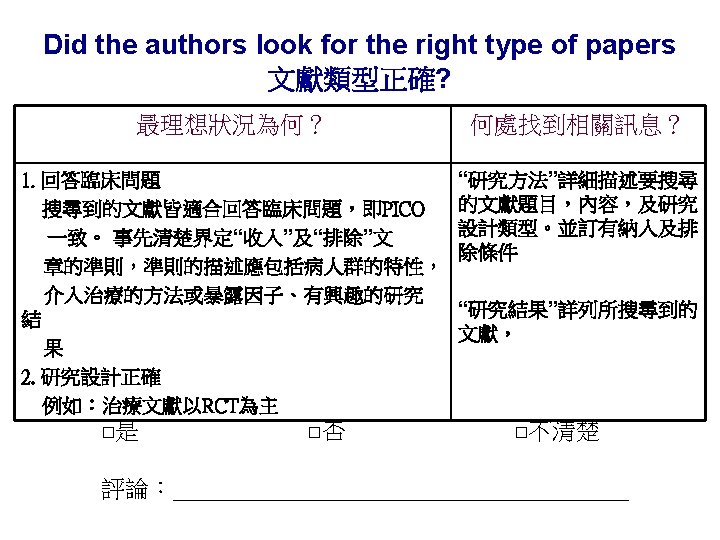
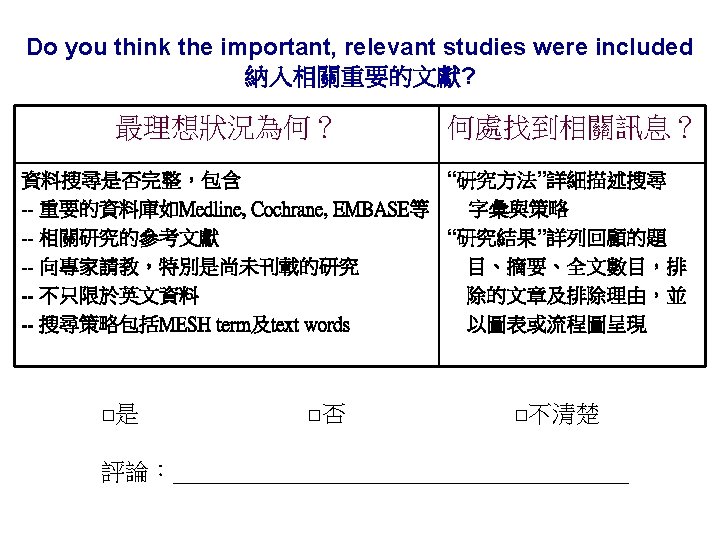
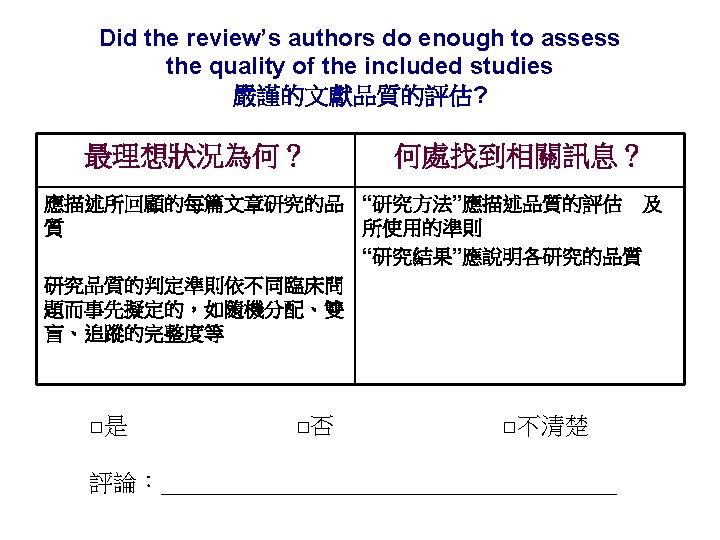
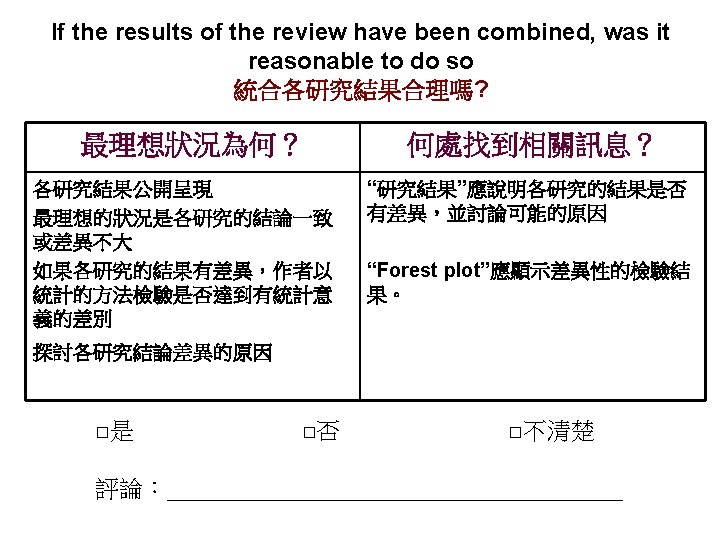
Critical Appraisal of Systematic Review (I) “系統性回顧”的評析 (一) • Are the results of the review valid (效度如何)? – Did the review address a clearly focused question (問題 清楚聚焦)? – Did the authors look for the right type of papers (文獻類 型正確)? – Do you think the important, relevant studies were included (納入相關重要的文獻)? – Did the review’s authors do enough to assess the quality of the included studies (嚴謹的文獻品質的評估)? – If the results of the review have been combined, was it reasonable to do so (將各研究結果做統合,合理嗎)?
解答不同類型臨床問題之最佳研究設計 Question type (問題類型) Study design (研究設計) Diagnostic test 診斷性檢驗或檢查 Prospective, blinded cross-sectional study comparing with gold standard 前瞻性、盲法、與黃金標準進行比較之斷面研究 Prognosis 預後 Cohort study > Case control study > Case series study 世代研究 > 病例對照研究 > 病例系列研究 Etiology 病因 Cohort study > Case control study > Case series study 世代研究 > 病例對照研究 > 病例系列研究 Therapy 治療 Randomised control trial (RCT) 隨機對照試驗 Prevention 預防 Randomised control trial (RCT) 隨機對照試驗 Cost effectiveness 成本效益 Economic analysis 經濟分析
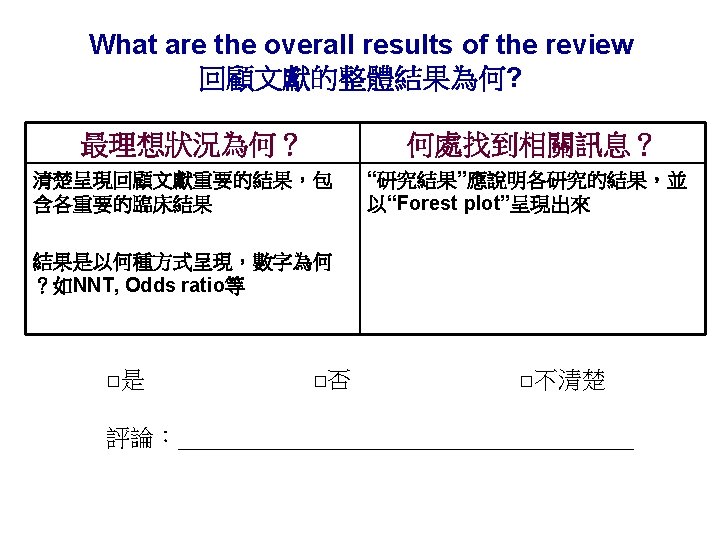
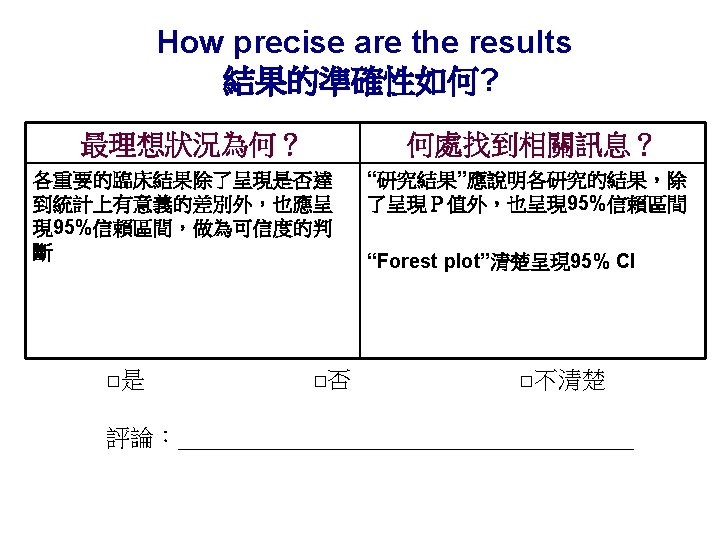
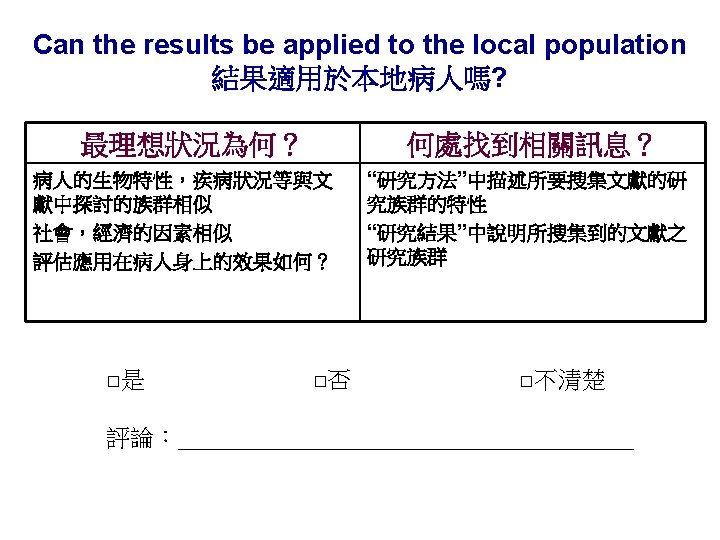
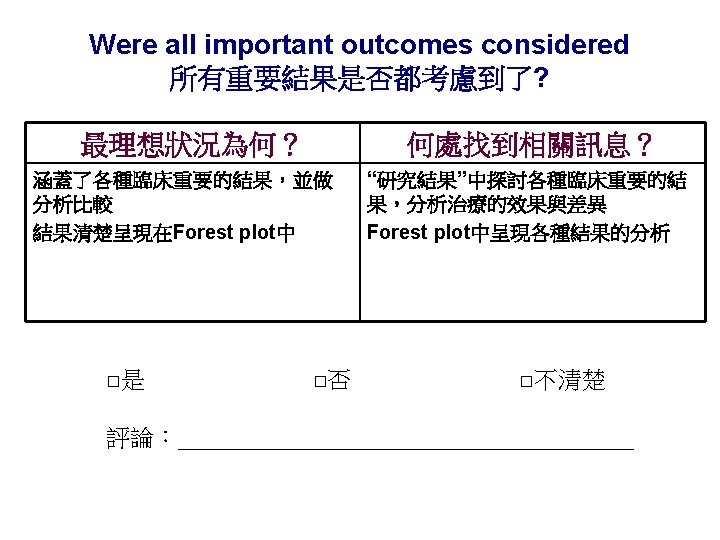
Critical Appraisal of Systematic Review (II) “系統性回顧”的評析 (二) • What were the results (結果為何)? – What are the overall results of the review (回顧文獻的整體結 果為何)? – How precise are the results (結果的準確性如何)? • Will the results help locally (結果對本地有幫助 嗎)? – Can the results be applied to the local population (結果適用 於本地病人嗎)? – Were all important outcomes considered (所有重要結果是否都 考慮到了)? – Are the benefits worth the harms and costs (考量利弊,花費, 是否值得)?
不同類型的研究結果分析 (1) • Therapy / Prevention (治療/預防) – Relative risk reduction (RRR, 相對風險性降低度) – Absolute risk reduction (ARR, 絕對風險性降低度) – Number needed to treat (NNT, 益一需治數) • Harm / Etiology (傷害/病因) – Relative risk (RR, 風險比) – Odds ratio (OR, 勝算比) – Number needed to harm (NNH, 害一需治數)
不同類型的研究結果分析 (2) • Diagnosis (診斷) – Sensitivity (敏感度) – Specificity (特異度) – Positive predictive value (陽性預測值) – Negative predictive value (陰性預測值) – Likelihood ratio (相似比) • Prognosis (預後) – Event rate (事件發生率) – Odds ratio (OR, 勝算比) – Survival curve
Meta-analysis Forest Plot Comparison: Treatment VS Placebo Outcome: Effect of treatment on mortality Study Brown 1998 Treatment n/N Control n/N 24/472 35/499 9. 6 0. 71(0. 42, 1. 21) 182/2838 51. 8 0. 64(0. 51, 0. 81) 84/2030 24. 4 0. 65(0. 46, 0. 92) Geoffrey 1997 120/2850 Mason 1996 56/2051 OR (95% CI) Treatment reduces mortality by 34% Weight % OR (95% CI) Peters 2000 5/81 4/78 1. 1 1. 22(0. 31, 4. 71) Scott 1998 31/788 46/792 13. 1 0. 66(0. 42, 1. 06) Total (95% CI) 236/6242 351/6237 100. 0 0. 66(0. 56, 0. 78) . 1. 2 Test for heterogeneity chi-square=0. 92 df=4 p=0. 92 Test for overall effect z=-4. 82 p<0. 00001 Favors treatment 1 5 10 Favors control No effect of treatment
Explore Heterogeneity Eyeball test – Overlap of the confidence intervals of the trials with the summary estimate Vertical light blue line through the combined Cochran Q and Q / df Study Brown 1998 Treatment n/N Control n/N 24/472 35/499 9. 6 0. 71(0. 42, 1. 21) 182/2838 51. 8 0. 64(0. 51, 0. 81) 84/2030 24. 4 0. 65(0. 46, 0. 92) Geoffrey 1997 120/2850 Mason 1996 odds ratio crosses the horizontal lines of all the individual studies OR Weight OR (95% CI) % (95% CI) 56/2051 Peters 2000 5/81 4/78 1. 1 1. 22(0. 31, 4. 71) Scott 1998 31/788 46/792 13. 1 0. 66(0. 42, 1. 06) Total (95% CI) 236/6242 351/6237 100. 0 0. 66(0. 56, 0. 78) . 1. 2 Test for heterogeneity chi-square=0. 92 df=4 p=0. 92 Test for overall effect z=-4. 82 p<0. 00001 Favors treatment 1 5 10 Cochran Q p=0. 92 Q / df = 0. 92 / 4 = 0. 23 (<1) Favors control
BMJ 2011; 342: d 549
BMJ 2011; 342: d 549
Methodology for a Systematic Review of RCTs