
System of customer satisfaction surveys calculation of customer
- Slides: 14
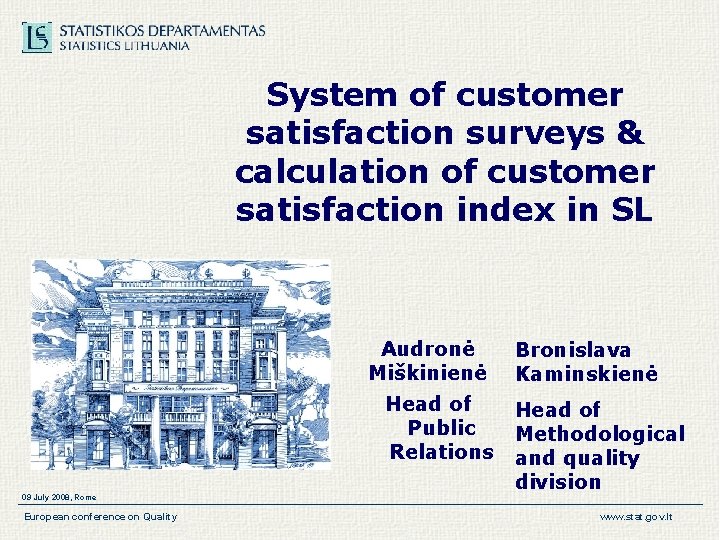
System of customer satisfaction surveys & calculation of customer satisfaction index in SL Audronė Miškinienė Head of Public Relations 09 July 2008, Rome European conference on Quality Bronislava Kaminskienė Head of Methodological and quality division www. stat. gov. lt
Subject-matter § Set-up of System of Customer satisfaction surveys § Position in QMS § Customer satisfaction index § Use of results 09 July 2008, Rome European conference on Quality www. stat. gov. lt
System of customer satisfaction surveys DG Decree signed 2006 § Internet-related customer surveys (3) § Traditional satisfaction surveys (5) § Specialised surveys (1 or 2 per year) 09 July 2008, Rome European conference on Quality www. stat. gov. lt
Internet-related surveys 1. Web accessibility (monthly, quarterly) 2. Web users registered to Alert-me services (monthly, quarterly) 3. Opinion survey of web visitors (monthly) 09 July 2008, Rome European conference on Quality www. stat. gov. lt
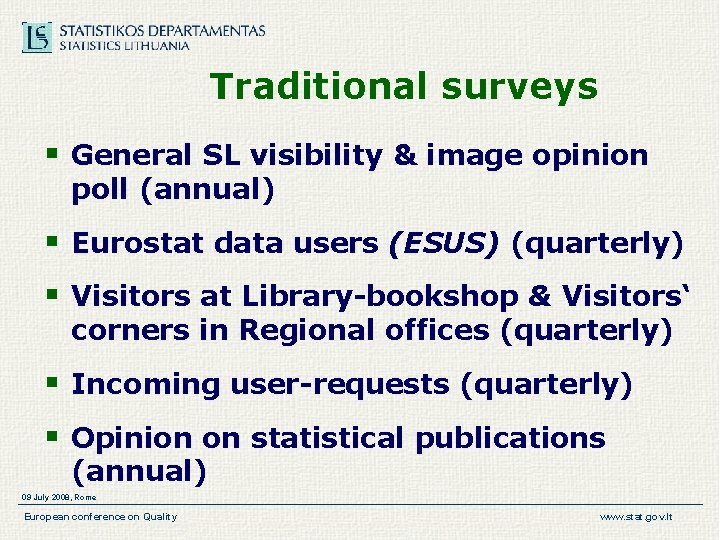
Traditional surveys § General SL visibility & image opinion poll (annual) § Eurostat data users (ESUS) (quarterly) § Visitors at Library-bookshop & Visitors‘ corners in Regional offices (quarterly) § Incoming user-requests (quarterly) § Opinion on statistical publications (annual) 09 July 2008, Rome European conference on Quality www. stat. gov. lt
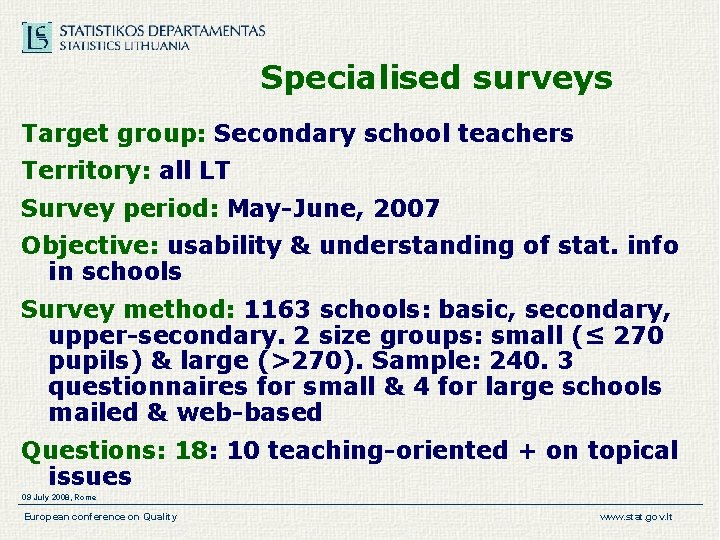
Specialised surveys Target group: Secondary school teachers Territory: all LT Survey period: May-June, 2007 Objective: usability & understanding of stat. info in schools Survey method: 1163 schools: basic, secondary, upper-secondary. 2 size groups: small (≤ 270 pupils) & large (>270). Sample: 240. 3 questionnaires for small & 4 for large schools mailed & web-based Questions: 18: 10 teaching-oriented + on topical issues 09 July 2008, Rome European conference on Quality www. stat. gov. lt
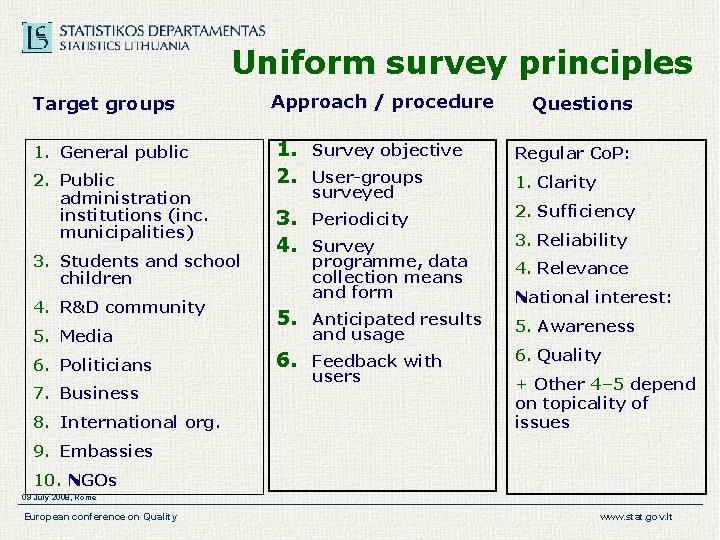
Uniform survey principles Target groups 1. General public 2. Public administration institutions (inc. municipalities) 3. Students and school children 4. R&D community 5. Media 6. Politicians 7. Business 8. International org. Approach / procedure Questions 1. Survey objective 2. User-groups Regular Co. P: 3. Periodicity 4. Survey 2. Sufficiency surveyed programme, data collection means and form 5. Anticipated results and usage 6. Feedback with users 1. Clarity 3. Reliability 4. Relevance National interest: 5. Awareness 6. Quality + Other 4– 5 depend on topicality of issues 9. Embassies 10. NGOs 09 July 2008, Rome European conference on Quality www. stat. gov. lt
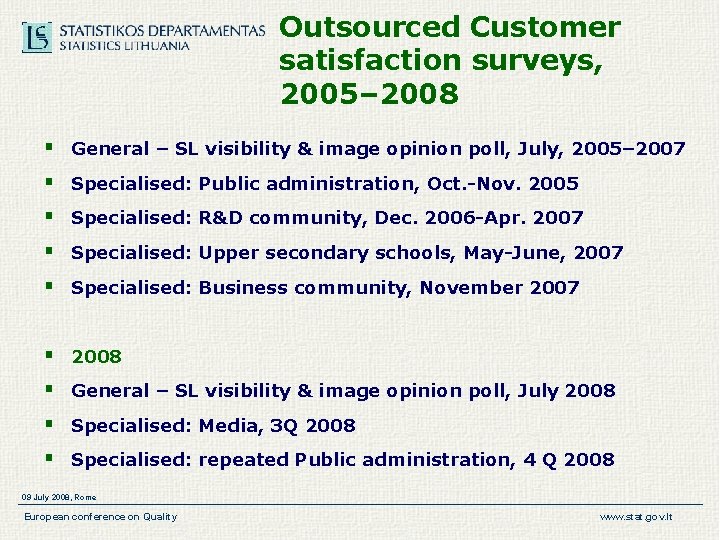
Outsourced Customer satisfaction surveys, 2005– 2008 § General – SL visibility & image opinion poll, July, 2005– 2007 § Specialised: Public administration, Oct. -Nov. 2005 § Specialised: R&D community, Dec. 2006 -Apr. 2007 § Specialised: Upper secondary schools, May-June, 2007 § Specialised: Business community, November 2007 § 2008 § General – SL visibility & image opinion poll, July 2008 § Specialised: Media, 3 Q 2008 § Specialised: repeated Public administration, 4 Q 2008 09 July 2008, Rome European conference on Quality www. stat. gov. lt
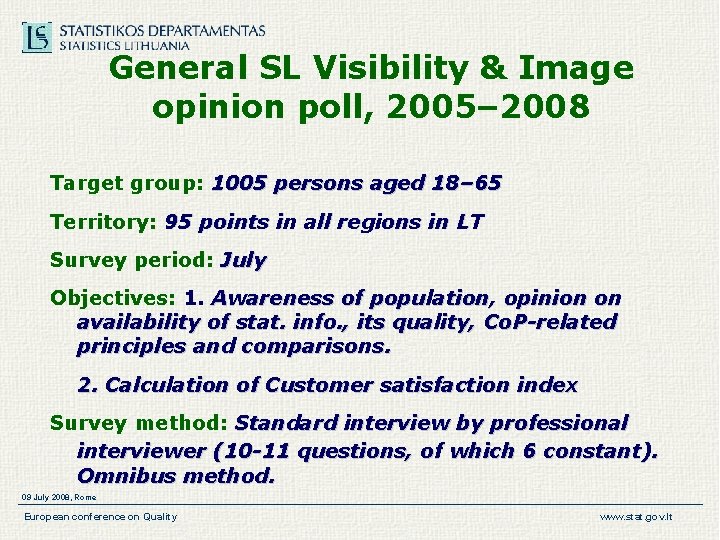
General SL Visibility & Image opinion poll, 2005– 2008 Target group: 1005 persons aged 18– 65 Territory: 95 points in all regions in LT Survey period: July Objectives: 1. Awareness of population, opinion on availability of stat. info. , its quality, Co. P-related principles and comparisons. 2. Calculation of Customer satisfaction index Survey method: Standard interview by professional interviewer (10 -11 questions, of which 6 constant). Omnibus method. 09 July 2008, Rome European conference on Quality www. stat. gov. lt
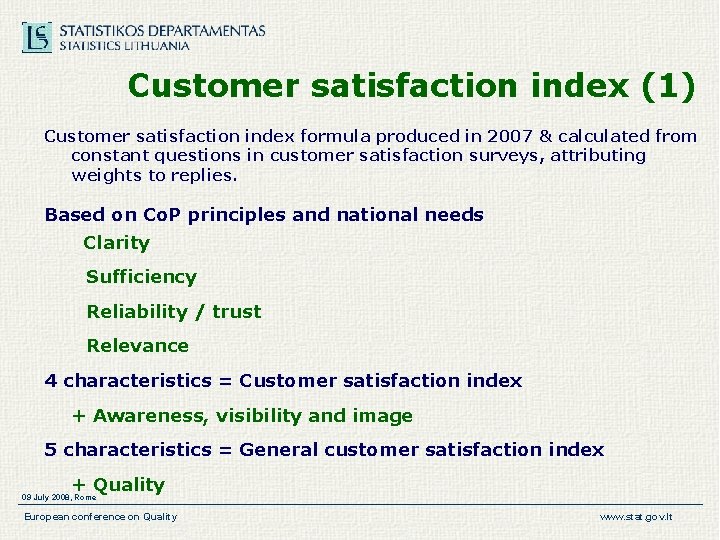
Customer satisfaction index (1) Customer satisfaction index formula produced in 2007 & calculated from constant questions in customer satisfaction surveys, attributing weights to replies. Based on Co. P principles and national needs Clarity Sufficiency Reliability / trust Relevance 4 characteristics = Customer satisfaction index + Awareness, visibility and image 5 characteristics = General customer satisfaction index + Quality 09 July 2008, Rome European conference on Quality www. stat. gov. lt
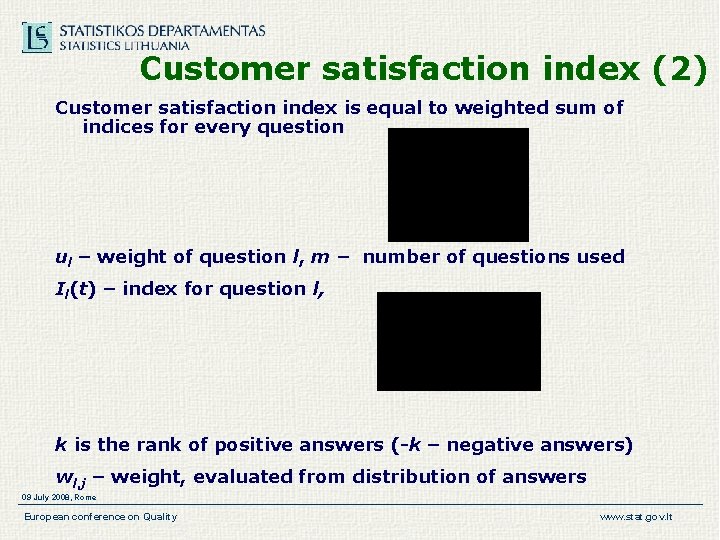
Customer satisfaction index (2) Customer satisfaction index is equal to weighted sum of indices for every question ul – weight of question l, m – number of questions used Il(t) – index for question l, k is the rank of positive answers (-k – negative answers) wl, j – weight, evaluated from distribution of answers 09 July 2008, Rome European conference on Quality www. stat. gov. lt
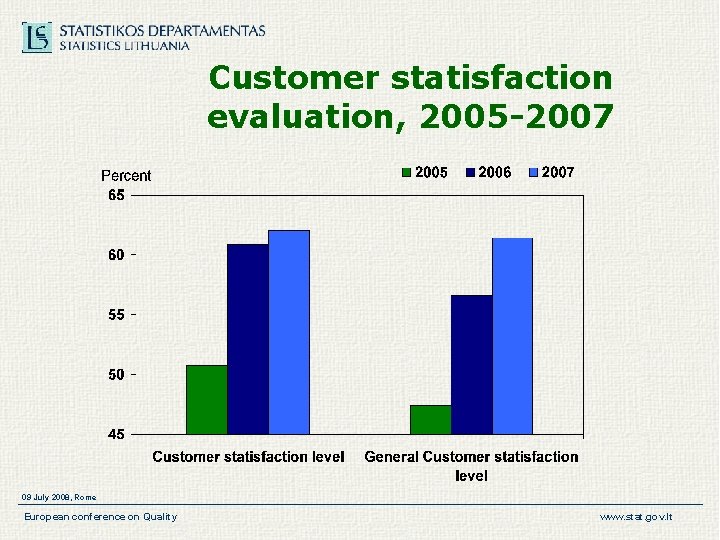
Customer statisfaction evaluation, 2005 -2007 09 July 2008, Rome European conference on Quality www. stat. gov. lt
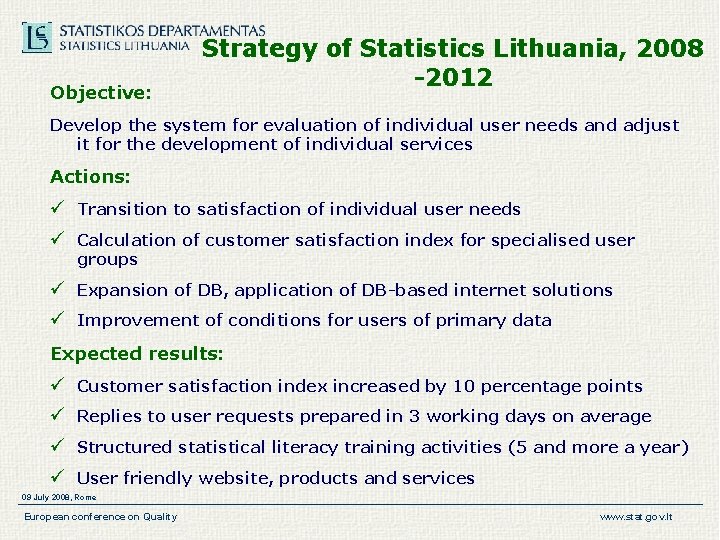
Objective: Strategy of Statistics Lithuania, 2008 -2012 Develop the system for evaluation of individual user needs and adjust it for the development of individual services Actions: ü Transition to satisfaction of individual user needs ü Calculation of customer satisfaction index for specialised user groups ü Expansion of DB, application of DB-based internet solutions ü Improvement of conditions for users of primary data Expected results: ü Customer satisfaction index increased by 10 percentage points ü Replies to user requests prepared in 3 working days on average ü Structured statistical literacy training activities (5 and more a year) ü User friendly website, products and services 09 July 2008, Rome European conference on Quality www. stat. gov. lt
Thank you. Questions are welcome 09 July 2008, Rome European conference on Quality www. stat. gov. lt