
System Administration Budget Office Update Faculty Council of
System Administration Budget Office Update Faculty Council of Community Colleges (FCCC) Spring Plenary April 6, 2018 1
Items for Discussion - Historical Trends - Revenue - Expenses - New York State Budget Update - Enrollment and High School Graduates - Questions / Concerns / Feedback 2
Historical Trends: Revenue and Spending 3
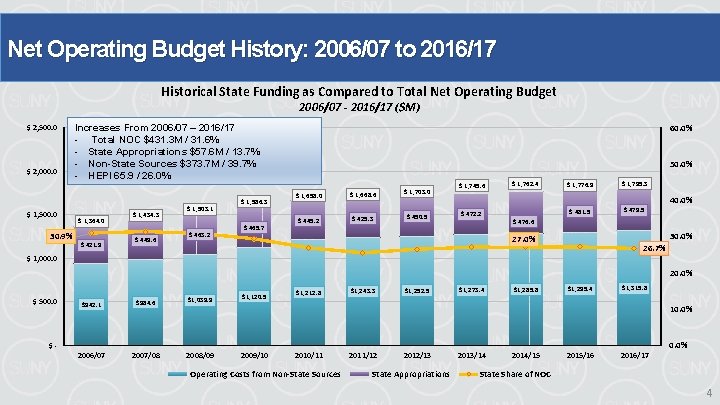
Net Operating Budget History: 2006/07 to 2016/17 Historical State Funding as Compared to Total Net Operating Budget 2006/07 - 2016/17 ($M) $ 2, 500. 0 $ 2, 000. 0 $ 1, 500. 0 30. 9% Increases From 2006/07 – 2016/17 - Total NOC $431. 3 M / 31. 6% - State Appropriations $57. 6 M / 13. 7% - Non-State Sources $373. 7 M / 39. 7% - HEPI 65. 9 / 26. 0% $ 1, 364. 0 $ 421. 9 $ 1, 434. 3 $ 449. 6 $ 1, 503. 1 $ 463. 2 $ 1, 586. 3 $ 465. 7 60. 0% 50. 0% $ 1, 658. 0 $ 445. 2 $ 1, 668. 6 $ 425. 3 $ 1, 703. 0 $ 450. 5 $ 1, 745. 6 $ 472. 2 $ 1, 762. 4 $ 1, 776. 9 $ 1, 795. 3 $ 481. 5 $ 479. 5 40. 0% $ 476. 6 30. 0% 27. 0% 26. 7% $ 1, 000. 0 20. 0% $ 500. 0 $942. 1 $984. 6 $1, 039. 9 2006/07 2007/08 2008/09 $1, 120. 5 $1, 212. 8 $1, 243. 3 $1, 252. 5 $1, 273. 4 $1, 285. 8 $1, 295. 4 $1, 315. 8 10. 0% $2009/10 2010/11 Operating Costs from Non-State Sources 2011/12 2012/13 State Appropriations 2013/14 2014/15 2015/16 2016/17 0. 0% State Share of NOC 4
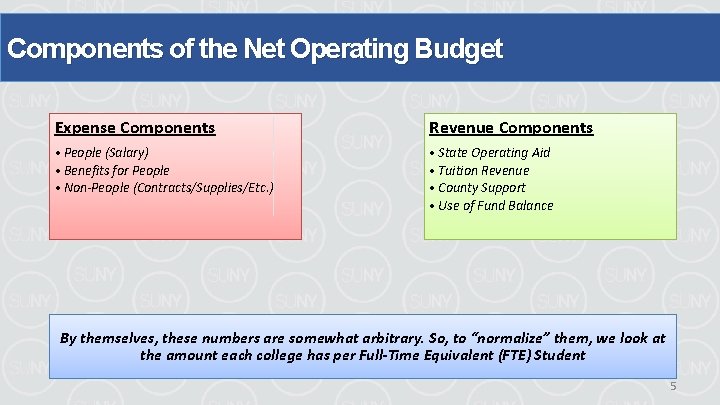
Components of the Net Operating Budget Expense Components Revenue Components • People (Salary) • Benefits for People • Non-People (Contracts/Supplies/Etc. ) • State Operating Aid • Tuition Revenue • County Support • Use of Fund Balance By themselves, these numbers are somewhat arbitrary. So, to “normalize” them, we look at the amount each college has per Full-Time Equivalent (FTE) Student 5
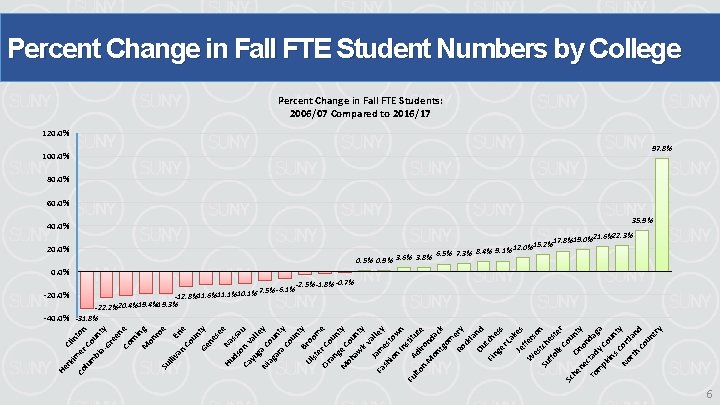
Cl rk in i Co mer ton lu m Cou bi a- nty Gr ee n Co e rn in M g on ro e Su lli va E n rie Co un Ge ty ne se e Hu Na ds ssa o Ca n V u yu al le g Ni a C y ag ou ar nt a Co y un Br ty Ul oo st er me Or C an ou ge nty M oh Cou aw nt k. V y Ja alle m Fa sh es y t io n own In st Fu i lto Adi tute r n. M ond on ac k tg om e Ro ry ck la Du nd t Fin che ge ss r. L a Je kes f W fers es o Su tch n ffo es lk ter Co Sc u he On nty ne on To ctad dag m y pk Co a in u s C nty o No r rth tlan Co d un try He Percent Change in Fall FTE Student Numbers by College Percent Change in Fall FTE Students: 2006/07 Compared to 2016/17 120. 0% 100. 0% -20. 0% -7. 5% -6. 1% -12. 8%-11. 6%-11. 1%-10. 1% -22. 2%-20. 4%-19. 3% -40. 0% -31. 8% 97. 8% 80. 0% 60. 0% 40. 0% 35. 9% 20. 0% 6. 5% 7. 3% 8. 4% 0. 5% 0. 9% 3. 6% 3. 8% 19. 0%21. 6%22. 3% 15. 2%17. 8% 12. 0% 9. 1% 0. 0% -2. 5% -1. 8% -0. 7% 6
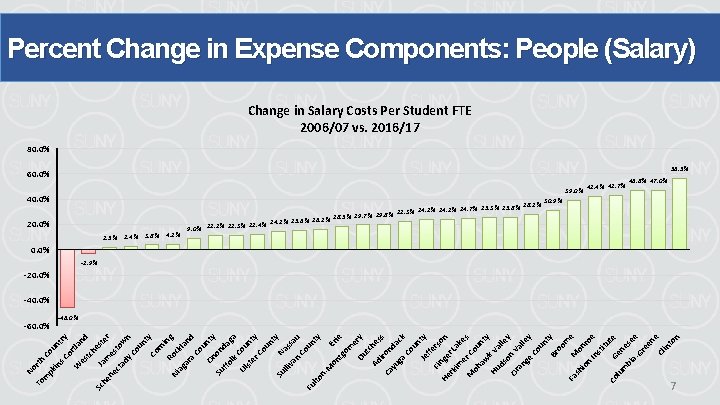
No To rth m pk Cou in n s C try or W tla n es tc d he Sc he Jam ster ne e ct sto ad w y. C n ou nt Co y rn i Ro ng Ni c k ag ar land a Co u On nty Su on ffo da ga lk Ul Cou st er nty Co un ty Su Na lli va ssa u n Co un Fu ty lto n. M on Eri e tg om e Du ry tc Ad hes iro s Ca yu nda ck ga Co un ty Je ffe rs Fi He nge on r rk im Lak e e M r. C s oh ou aw nt y Hu k Va l ds o ley Or n V a an ge lley Co un t Br y oo m e Fa sh Mo n io ro n e In st itu te Co lu Gen m bi ese ae Gr ee ne Cl in to n Percent Change in Expense Components: People (Salary) Change in Salary Costs Per Student FTE 2006/07 vs. 2016/17 80. 0% 60. 0% 40. 0% -60. 0% 39. 0% 20. 0% 1. 5% 2. 4% 3. 8% 4. 1% 42. 4% 42. 7% 46. 8% 47. 0% 56. 5% 28. 2% 30. 9% 24. 1% 24. 7% 25. 3% 25. 8% 22. 3% 18. 5% 19. 7% 19. 8% 15. 6% 16. 1% 12. 4% 14. 2% 9. 0% 11. 2% 11. 3% 0. 0% -2. 9% -40. 0% -46. 0% 7
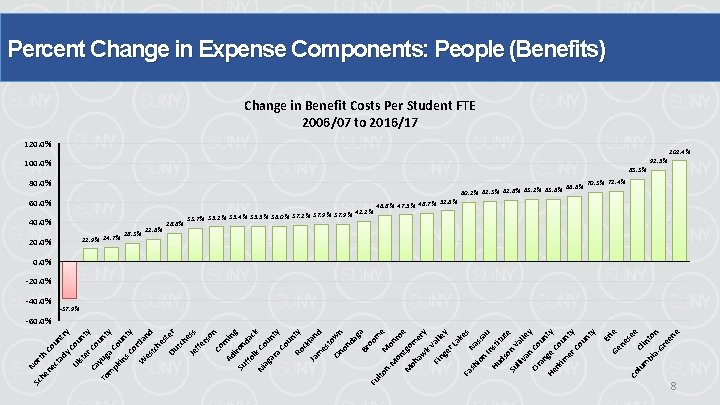
100. 0% in t a- on Gr ee ne bi m 22. 6% ee 18. 3% Cl -40. 0% 12. 9% 14. 7% 37. 9% 41. 1% 33. 7% 35. 2% 35. 4% 35. 5% 36. 0% 37. 1% Co lu 20. 0% 28. 8% ie 40. 0% 66. 6% 60. 2% 61. 3% 61. 8% 63. 2% 63. 6% ne s 60. 0% 51. 6% 46. 8% 47. 5% 48. 7% Er 80. 0% Ge No rth C ne ct oun ad try y Ul Cou st nt e y Ca r Co u nt To yug y a m pk Co un in s. C t or y t W l es and tc he st Du er tc he ss Je ffe rs o Co n Ad rnin g i Su ron ffo da ck l Ni k Co ag ar unt y a Co un Ro ty ck Ja lan m d es to On wn on da g Br a o om Fu lto M e no M on nro M tgo e oh m aw er k. V y Fin all ge ey r. L ak es Fa N sh a ss io au n In Hu sti ds tut o Su n V e lli va alle y n C Or an oun ty He ge C rk im oun ty er Co un ty he Sc Percent Change in Expense Components: People (Benefits) Change in Benefit Costs Per Student FTE 2006/07 to 2016/17 120. 0% 92. 5% 102. 4% 70. 3% 71. 4% 83. 3% 0. 0% -20. 0% -60. 0% -37. 9% 8
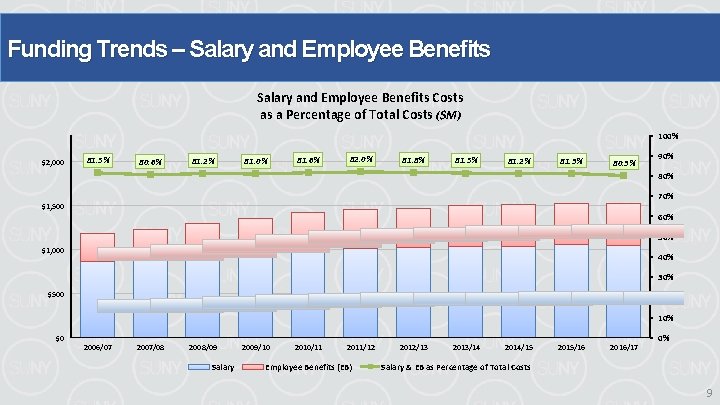
Funding Trends – Salary and Employee Benefits Costs as a Percentage of Total Costs ($M) 100% $2, 000 81. 5% 80. 6% 81. 2% 81. 0% 81. 6% 82. 0% 81. 8% 81. 5% 81. 2% 81. 3% 80. 3% 90% 80% 70% $1, 500 60% 50% $1, 000 40% 30% $500 20% 10% $0 2006/07 2007/08 2008/09 Salary 2009/10 2010/11 2011/12 Employee Benefits (EB) 2012/13 2013/14 2014/15 2015/16 2016/17 0% Salary & EB as Percentage of Total Costs 9
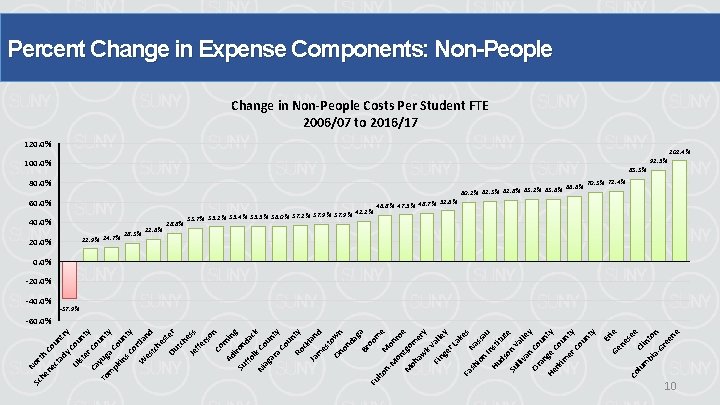
100. 0% in t a- on Gr ee ne bi m 22. 6% ee 18. 3% Cl -40. 0% 12. 9% 14. 7% 37. 9% 41. 1% 33. 7% 35. 2% 35. 4% 35. 5% 36. 0% 37. 1% Co lu 20. 0% 28. 8% ie 40. 0% 66. 6% 60. 2% 61. 3% 61. 8% 63. 2% 63. 6% ne s 60. 0% 51. 6% 46. 8% 47. 5% 48. 7% Er 80. 0% Ge No rth C ne ct oun ad try y Ul Cou st nt e y Ca r Co u nt To yug y a m pk Co un in s. C t or y t W l es and tc he st Du er tc he ss Je ffe rs o Co n Ad rnin g i Su ron ffo da ck l Ni k Co ag ar unt y a Co un Ro ty ck Ja lan m d es to On wn on da g Br a o om Fu lto M e no M on nro M tgo e oh m aw er k. V y Fin all ge ey r. L ak es Fa N sh a ss io au n In Hu sti ds tut o Su n V e lli va alle y n C Or an oun ty He ge C rk im oun ty er Co un ty he Sc Percent Change in Expense Components: Non-People Change in Non-People Costs Per Student FTE 2006/07 to 2016/17 120. 0% 92. 5% 102. 4% 70. 3% 71. 4% 83. 3% 0. 0% -20. 0% -60. 0% -37. 9% 10
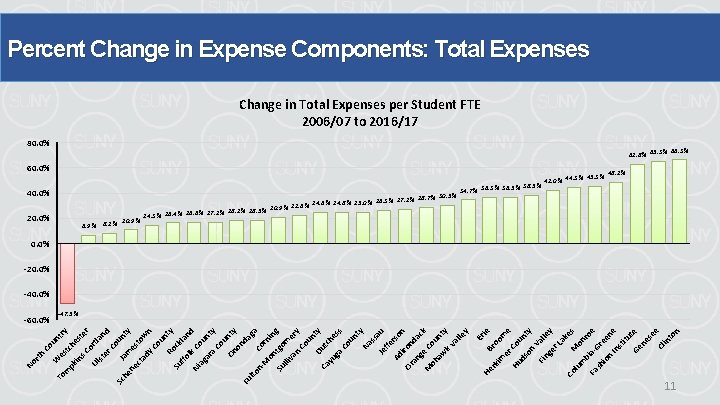
-60. 0% 6. 9% 8. 1% 10. 9% rk 20. 0% 30. 5% 26. 3% 27. 2% 28. 7% 22. 6% 24. 8% 25. 0% 20. 9% 17. 1% 18. 2% 18. 5% 14. 3% 16. 4% 16. 6% He 40. 0% Er i Br e im oom er e Hu Co ds unt on y V Fin all ge ey r. L ak es Co M lu on m r b Fa ia-G oe sh io ree ne n In st itu Ge te ne se e Cl in to n Co un W To try es m t pk che in s C ster or Ul tla st er nd Co u Sc he Jam nty ne e ct sto ad w y. C n ou nt R y Su ock ffo lan l d Ni k Co ag u nt ar y a Co un On ty on da Fu ga lto C no M r on nin g t g Su lli om va er y n Co un ty D Ca utc yu he ga ss Co un ty Na ss Je au ffe Ad rso n i Or ron da an c g M e. C k oh ou aw nt k. V y al le y No rth Percent Change in Expense Components: Total Expenses Change in Total Expenses per Student FTE 2006/07 to 2016/17 80. 0% 66. 3% 62. 8% 65. 3% 60. 0% 38. 5% 34. 7% 36. 3% 36. 5% 45. 3% 42. 0% 44. 3% 48. 2% 0. 0% -20. 0% -47. 5% 11
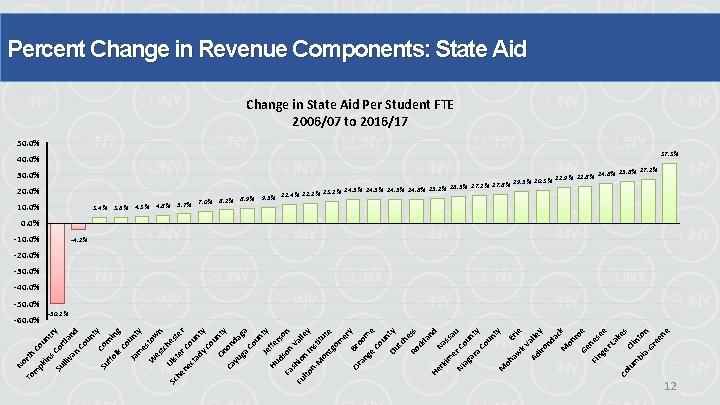
No To rth m pk Cou in nt s r Su Cor y tla lli va n nd Co un ty Su Cor n ffo lk ing Co Ja unt m y e W stow es tc n h U Sc lst est he e er ne Co r ct ad unt y. C y ou On nty Ca on d yu ga aga Co un ty Je f Hu fe rs d on Fa son sh Va Fu io lto n I lley n n. M stit on ut e tg om er y Or Bro an om ge e Co un Du ty tc he Ro ss ck la nd He Na rk s im er sau Ni C ag ou nt ar y a Co un ty M oh aw Eri k. V e Ad alle iro y nd ac M k on ro Ge e n Fin es ge ee r. L ak es Co Cl lu in m t bi a- on Gr ee ne Percent Change in Revenue Components: State Aid Change in State Aid Per Student FTE 2006/07 to 2016/17 50. 0% 40. 0% -60. 0% 37. 3% 30. 0% 20. 0% 10. 0% 3. 4% -10. 0% 3. 6% 4. 3% 4. 8% 5. 7% 7. 0% 8. 2% 8. 9% 27. 2% 24. 8% 25. 8% 21. 9% 22. 8% 20. 3% 19. 5% 17. 1% 17. 8% 14. 5% 14. 8% 15. 2% 16. 5% 12. 2% 13. 2% 11. 4% 9. 5% 0. 0% -4. 1% -20. 0% -30. 0% -40. 0% -50. 2% 12
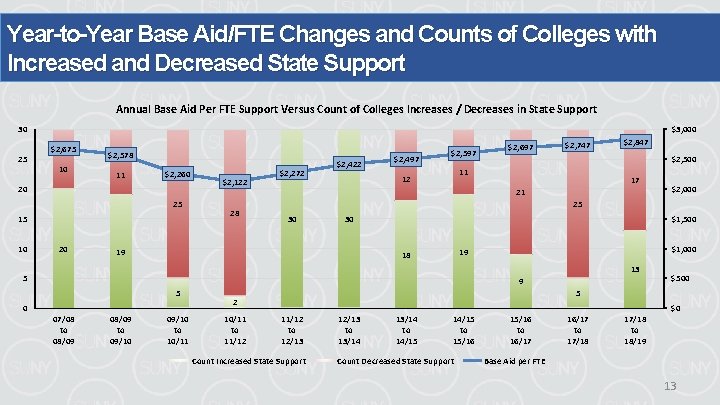
Year-to-Year Base Aid/FTE Changes and Counts of Colleges with Increased and Decreased State Support Annual Base Aid Per FTE Support Versus Count of Colleges Increases / Decreases in State Support 30 25 $3, 000 $2, 675 10 $2, 578 11 $2, 260 20 25 15 10 20 $2, 122 28 $2, 272 $2, 422 $2, 497 $2, 597 12 $2, 847 $2, 500 11 17 21 30 30 19 $1, 500 $1, 000 19 18 13 9 5 07/08 to 08/09 to 09/10 to 10/11 $500 5 2 10/11 to 11/12 $2, 000 25 5 0 $2, 697 $2, 747 11/12 to 12/13 Count Increased State Support 12/13 to 13/14 to 14/15 to 15/16 Count Decreased State Support 15/16 to 16/17 to 17/18 to 18/19 $0 Base Aid per FTE 13
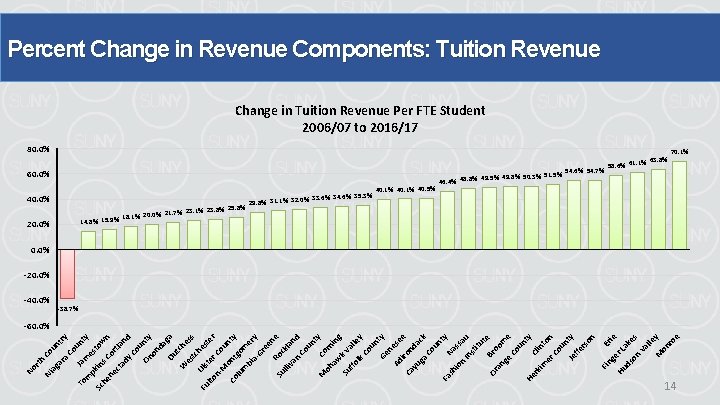
No rth C Ni ag oun ar try a Co Ja unt To m y m es p Sc kin tow s he ne Cor n t ct ad lan y. C d ou On nty on da Du ga W tche es ss tc he U Fu l s lto ster n. Co M u Co ont nty go lu m m er bi ay Gr ee n Su Roc e kl lli a va n nd Co un t Co y M oh rn aw in g Su k V a ffo l lk ley Co un Ge ty n Ad ese iro e Ca yu nda ck ga Co un ty Fa sh Na ss io au n In st itu te B Or r an oom ge e Co un ty He Cl rk i im nt er on Co un ty Je ffe rs on Fin E ge rie r Hu L ds ake on s Va lle M y on ro e Percent Change in Revenue Components: Tuition Revenue Change in Tuition Revenue Per FTE Student 2006/07 to 2016/17 80. 0% 60. 0% 40. 0% 20. 0% -40. 0% 25. 8% 21. 7% 23. 1% 23. 8% 18. 1% 20. 0% 14. 8% 15. 9% 33. 6% 34. 6% 35. 3% 29. 8% 31. 1% 32. 0% 40. 1% 40. 5% 49. 8% 50. 3% 51. 5% 46. 4% 48. 8% 54. 6% 54. 7% 63. 8% 58. 6% 61. 1% 70. 1% 0. 0% -20. 0% -38. 7% -60. 0% 14
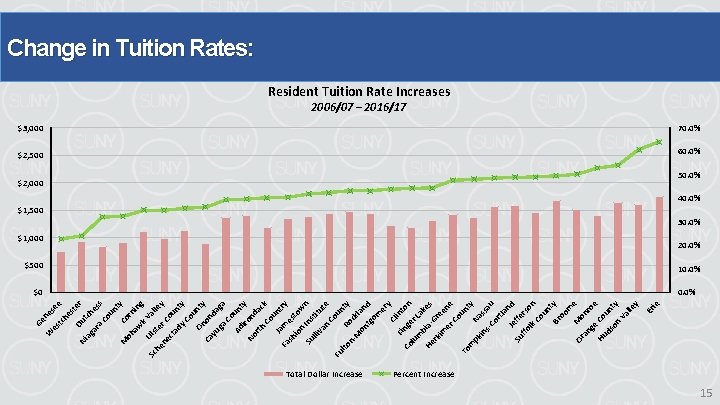
e se Ni Total Dollar Increase ie Er s Du ter t ag c ar hes a Co s un t M Co y oh rn aw in k. V g U Sc lst all he e e ne r C y ou ct ad n y C ty ou nt O y Ca non da yu ga ga Co u Ad nt y i No ron rth dac Co k un Ja m try Fa sh est io ow n Su Ins n t lli va itut e n Co Fu un lto Ro ty n. M ckla on nd tg om er y Cl Fin int on Co g lu er L m ak b es He ia. G rk r im ee ne er Co un To ty m N pk in ass s-C au or tla Je nd ff Su ffo ers on lk Co un t Br y oo m e Or Mo an nr oe ge Hu Co ds un on ty Va lle y he tc ne Ge es W Change in Tuition Rates: Resident Tuition Rate Increases 2006/07 – 2016/17 $3, 000 70. 0% $2, 500 60. 0% $2, 000 50. 0% $1, 500 40. 0% 30. 0% $1, 000 20. 0% $500 10. 0% $0 0. 0% Percent Increase 15
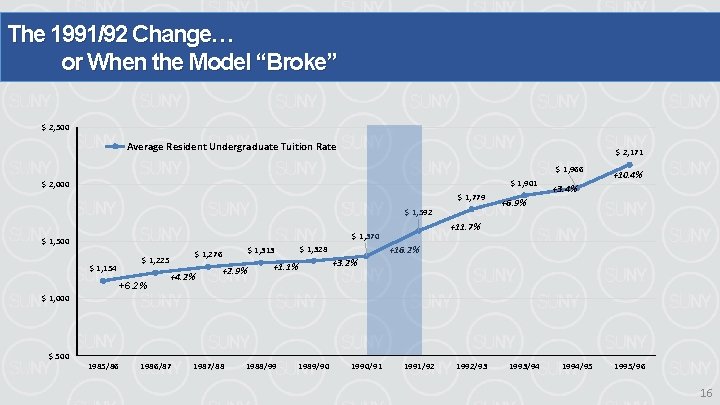
The 1991/92 Change… or When the Model “Broke” $ 2, 500 Average Resident Undergraduate Tuition Rate $ 2, 171 $ 1, 966 $ 1, 901 $ 2, 000 $ 1, 779 $ 1, 592 $ 1, 154 +6. 2% +4. 2% $ 1, 328 $ 1, 313 $ 1, 276 $ 1, 225 +2. 9% +1. 1% +3. 4% +6. 9% +11. 7% $ 1, 370 $ 1, 500 +10. 4% +16. 2% +3. 2% $ 1, 000 $ 500 1985/86 1986/87 1987/88 1988/99 1989/90 1990/91 1991/92 1992/93 1993/94 1994/95 1995/96 16
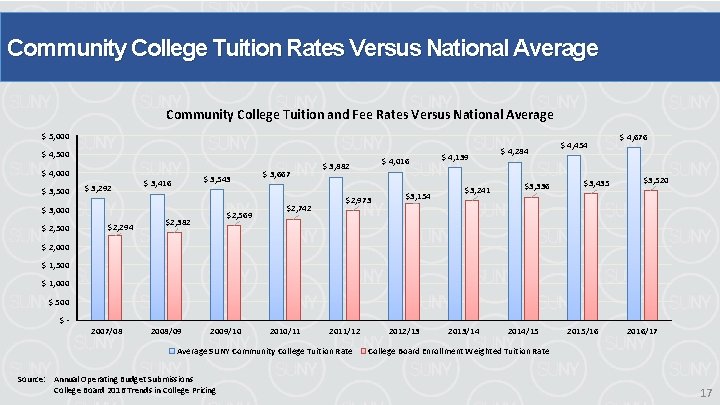
Community College Tuition Rates Versus National Average Community College Tuition and Fee Rates Versus National Average $ 5, 000 $ 4, 500 $ 4, 000 $ 3, 500 $ 3, 292 $ 3, 543 $ 3, 416 $ 3, 000 $ 2, 500 $2, 294 $2, 569 $2, 382 $ 3, 667 $2, 742 $ 4, 016 $ 3, 882 $2, 973 $3, 154 $ 4, 139 $3, 241 $ 4, 284 $3, 336 $ 4, 454 $3, 435 $ 4, 676 $3, 520 $ 2, 000 $ 1, 500 $ 1, 000 $ 500 $- 2007/08 2008/09 2009/10 2010/11 2011/12 Average SUNY Community College Tuition Rate Source: Annual Operating Budget Submissions College Board 2016 Trends in College Pricing 2012/13 2013/14 2014/15 2015/16 2016/17 College Board Enrollment Weighted Tuition Rate 17
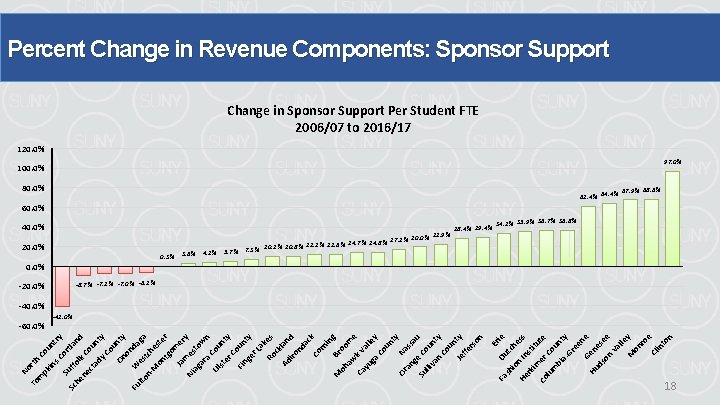
40. 0% 20. 0% -60. 0% 22. 9% 17. 1% 20. 0% 12. 2% 12. 6% 14. 7% 14. 8% 10. 1% 4. 1% 5. 7% 7. 3% 0. 3% 3. 6% -20. 0% E Du rie Fa sh t io che He n In ss s rk im titu te er Co Co lu m u nt bi ay Gr ee ne G Hu en ds ese on e Va lle M y on ro e Cl in to n No To rth m pk Cou in n s C try or S Sc uffo tlan he lk d ne Co ct u ad n y C ty ou On nty o W nda Fu ga lto es n- tch M es on t tg er om Ja er m y Ni es ag to w ar n a C o Ul u st er nty C Fin oun ge ty r. L ak Ro es ck Ad lan iro d nd ac Co k rn in g B M oh roo aw m e Ca k V al yu ga ley Co un ty Na Or an ss a g Su e C u o lli va unt y n Co un ty Je ffe rs on Percent Change in Revenue Components: Sponsor Support Change in Sponsor Support Per Student FTE 2006/07 to 2016/17 120. 0% 100. 0% 97. 0% 80. 0% 67. 9% 68. 6% 61. 4% 64. 4% 60. 0% 28. 4% 29. 4% 34. 1% 35. 9% 36. 7% 36. 8% 0. 0% -8. 7% -7. 2% -7. 0% -6. 2% -40. 0% -41. 0% 18
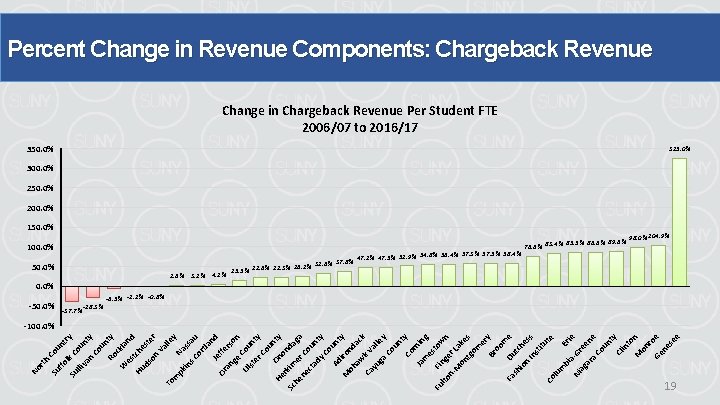
No rth Su Cou ffo nt r l Su k C y ou lli va nt y n Co un Ro ty c W kla nd es t Hu che s ds on ter Va lle To y m N pk in ass s C au or tla Je nd ff Or an ers ge on Ul Cou st er nty Co un O He no ty r n Sc kim da ga he er ne Co ct u ad n y C ty o Ad unt i ro y M oh nd aw ac k Ca k V al yu ga ley Co un t Co y rn Ja m ing es Fu Fin tow lto g n n- er La M k on tg es om er Br y oo m Du e Fa sh tc he io n In ss st itu te Co lu m E bi a- rie Ni Gr ag ee ar ne a Co un ty Cl in to M n on ro Ge e ne se e Percent Change in Revenue Components: Chargeback Revenue Change in Chargeback Revenue Per Student FTE 2006/07 to 2016/17 350. 0% -50. 0% 325. 0% 300. 0% 250. 0% 200. 0% 150. 0% 100. 0% 50. 0% 2. 6% 3. 1% 4. 1% -37. 7% 37. 8% 26. 1% 32. 6% 15. 5% 21. 6% 22. 3% 56. 4% 57. 3% 57. 5% 58. 4% 47. 2% 47. 5% 51. 9% 54. 8% 98. 0% 104. 9% 85. 5% 86. 6% 89. 6% 76. 6% 83. 4% 0. 0% -28. 3% -6. 5% -1. 1% -0. 8% -100. 0% 19
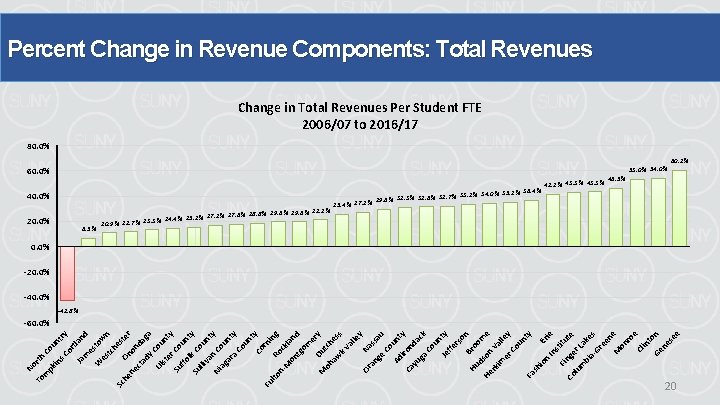
No To rth m pk Cou in n s C try or t Ja lan d m e W stow es tc n he Sc On ster he ne on ct ad dag a y Ul Cou st er nty C Su ffo oun t l Su k Co y lli u va nt y Ni n Co ag u nt ar y a Co un t Co y rn Fu i lto Ro ng nc k M on lan d tg om er M Dut y oh c aw hes k. V s al le y Na Or an ss au ge Co Ad unt y i Ca ron da yu ck ga Co un ty Je ffe rs on B Hu ro om d e He son rk V im all ey er Co un ty Fa sh io Er n In ie st itu F Co inge te lu r. L m bi ake a. Gr s ee n M e on ro e Cl in to Ge n ne se e Percent Change in Revenue Components: Total Revenues Change in Total Revenues Per Student FTE 2006/07 to 2016/17 80. 0% 60. 0% 40. 0% 20. 0% 6. 5% 21. 2% 17. 6% 18. 8% 19. 6% 14. 4% 15. 2% 17. 1% 10. 9% 11. 7% 13. 3% 36. 4% 33. 2% 34. 0% 35. 2% 29. 6% 31. 3% 31. 6% 31. 7% 25. 4% 27. 2% 41. 2% 43. 3% 46. 5% 53. 0% 54. 0% 60. 2% 0. 0% -20. 0% -40. 0% -60. 0% -42. 8% 20
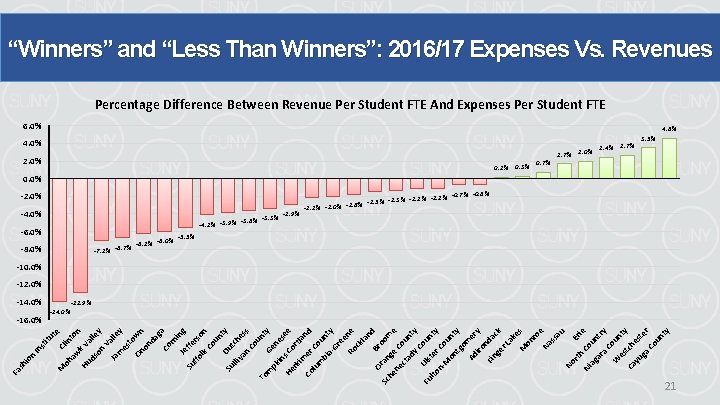
“Winners” and “Less Than Winners”: 2016/17 Expenses Vs. Revenues Percentage Difference Between Revenue Per Student FTE And Expenses Per Student FTE 6. 0% 4. 6% 4. 0% 2. 0% 0. 1% 0. 3% 0. 7% 1. 7% 2. 0% 2. 4% 2. 7% 3. 5% 0. 0% -2. 0% -4. 0% -3. 6% -3. 3% -4. 1% -3. 9% -6. 0% -7. 1% -6. 7% -8. 0% -6. 2% -6. 0% -2. 9% -1. 1% -1. 5% -1. 3% -1. 2% -2. 0% -1. 8% -0. 7% -0. 6% -5. 5% -10. 0% -12. 0% -14. 0% -12. 9% -14. 0% M Fa sh io n In st itu te oh Clin aw ton Hu k Va ds l on ley Va l Ja m ley es to On wn on da g Co a rn i Je ng ffe Su ffo rs on lk Co un t Su Dut y ch lli va es n s Co u n To G ty m pk en es in He s Co ee rk r im tlan er Co d Co lu m u nt bi ay Gr ee Ro ne ck la nd Or Bro a o Sc he nge me ne Co ct ad unt y. C y Fu Uls oun lto ter ty n. Co M u n on tg ty om Ad e iro ry nd Fin a ge ck r. L ak e M s on ro e Na ss au No rth Er ie C Ni ag oun ar try a Co u W es nty t Ca ch yu est ga e Co r un ty -16. 0% 21
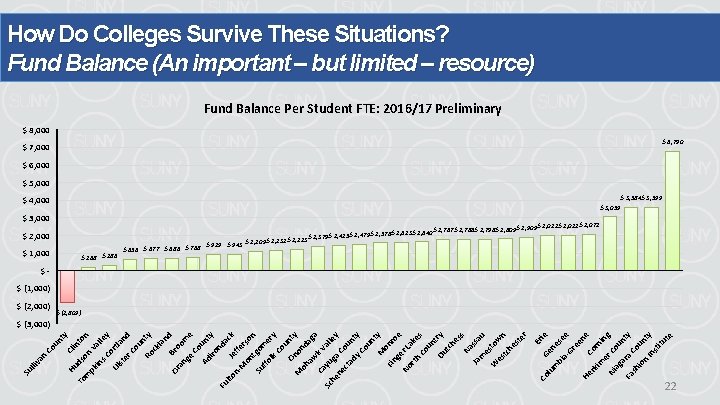
How Do Colleges Survive These Situations? Fund Balance (An important – but limited – resource) Fund Balance Per Student FTE: 2016/17 Preliminary $ 8, 000 $ 6, 790 $ 7, 000 $ 6, 000 $ 5, 000 $ 3, 584$ 3, 599 $ 3, 059 $ 4, 000 $ 3, 000 $ 2, 000 $ 168 $ 286 $ 1, 578$ 1, 623$ 1, 640$ 1, 767$ $ 1, 379$ 1, 415$ 1, 479 $ 1, 109$ 1, 131$ 1, 223 $ 943 $ 919 $ 656 $ 677 $ 686 $ 768 $ 2, 021$ 2, 022$ 2, 072 1, 786$ 1, 798$ 1, 809$ 1, 909 $$ (1, 000) $ (2, 000) $ (1, 809) ie ne s bi a- ee Gr ee ne He C or rk im ni n e Ni r Co g ag u nt a y Fa ra Co sh un io n In ty st itu te Er m Cl Ge Co lu Su lli va n Co un ty Hu i To ds nto on n m pk Va in s C lley Ul ortl a st er nd Co un Ro ty ck la nd Or Bro an o ge me Co Ad unt iro y nd Fu a lto Je ck nffe M on rso n Su tgom ffo lk ery Co u On nty M on oh d aw ag a k C Sc ayu Vall e he g ne a C y ou ct ad n y C ty ou nt M y o Fin nr oe g No er L rth ake Co s un Du try tc he s Na s Ja ssa m u e W stow es tc n he st er $ (3, 000) 22
New York State Budget Update 23
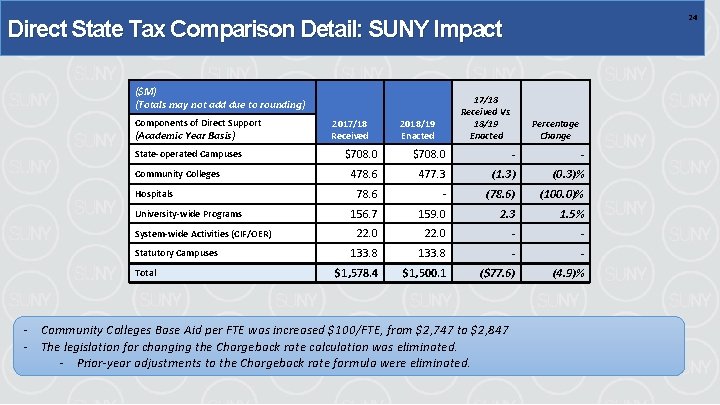
24 Direct State Tax Comparison Detail: SUNY Impact ($M) (Totals may not add due to rounding) Components of Direct Support (Academic Year Basis) State-operated Campuses Community Colleges Hospitals University-wide Programs System-wide Activities (CIF/OER) Statutory Campuses Total 2017/18 Received Vs. 18/19 Enacted 2018/19 Enacted Percentage Change $708. 0 - - 478. 6 477. 3 (1. 3) (0. 3)% 78. 6 - (78. 6) (100. 0)% 156. 7 159. 0 2. 3 1. 5% 22. 0 - - 133. 8 - - $1, 578. 4 $1, 500. 1 ($77. 6) (4. 9)% - Community Colleges Base Aid per FTE was increased $100/FTE, from $2, 747 to $2, 847 - The legislation for changing the Chargeback rate calculation was eliminated. - Prior-year adjustments to the Chargeback rate formula were eliminated.
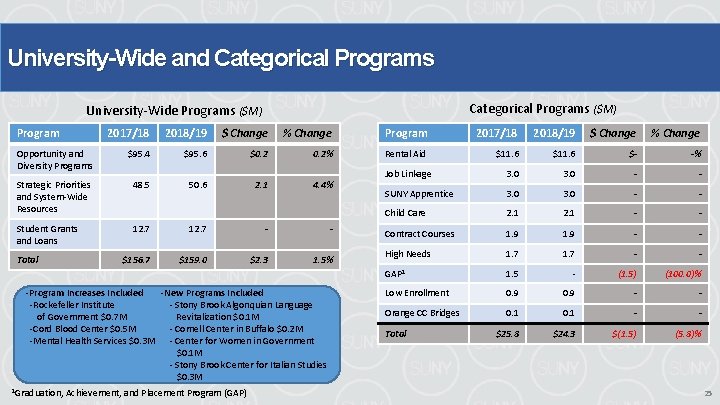
University-Wide and Categorical Programs ($M) University-Wide Programs ($M) Program 2017/18 2018/19 $ Change % Change Opportunity and Diversity Programs $95. 4 $95. 6 $0. 2% Rental Aid $11. 6 $- -% Strategic Priorities and System-Wide Resources 48. 5 50. 6 2. 1 4. 4% Job Linkage 3. 0 - - SUNY Apprentice 3. 0 - - Child Care 2. 1 - - Student Grants and Loans 12. 7 - - Contract Courses 1. 9 - - $156. 7 $159. 0 $2. 3 1. 5% High Needs 1. 7 - - GAP 1 1. 5 - (1. 5) (100. 0)% Low Enrollment 0. 9 - - Orange CC Bridges 0. 1 - - $25. 8 $24. 3 $(1. 5) (5. 8)% Total -Program Increases Included -New Programs Included -Rockefeller Institute - Stony Brook Algonquian Language of Government $0. 7 M Revitalization $0. 1 M -Cord Blood Center $0. 5 M - Cornell Center in Buffalo $0. 2 M -Mental Health Services $0. 3 M - Center for Women in Government $0. 1 M - Stony Brook Center for Italian Studies $0. 3 M 1 Graduation, Achievement, and Placement Program (GAP) Total 25
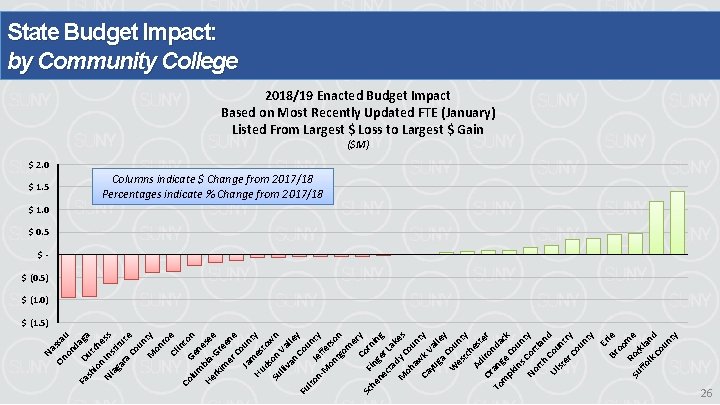
Na On ssa on u d Fa D ag sh ut a io ch n e Ni Ins ss ag tit ar ut a Co e un M ty on ro Cl e in to Co lu Ge n m ne He bia see rk -Gr im ee er n Co e Ja un m t Hu es y ds tow n Su on Va lli va n lley Co Fu un lto J n- ef ty M fer on so tg n om e Co ry Sc he Fing rnin ne er g ct ad Lak M y C es oh ou aw n Ca k V ty yu a ga lley Co W es unt y tc h Ad est Or iro er To an nda c m ge pk Co k in u nt s No Cor y rth tla nd Ul Cou st er ntry Co un ty Er Br ie oo m Su Roc e ffo kla lk nd Co un ty State Budget Impact: by Community College 2018/19 Enacted Budget Impact Based on Most Recently Updated FTE (January) Listed From Largest $ Loss to Largest $ Gain ($M) $ 2. 0 $ 1. 5 Columns indicate $ Change from 2017/18 Percentages indicate % Change from 2017/18 $ 1. 0 $ 0. 5 $- $ (0. 5) $ (1. 0) $ (1. 5) 26
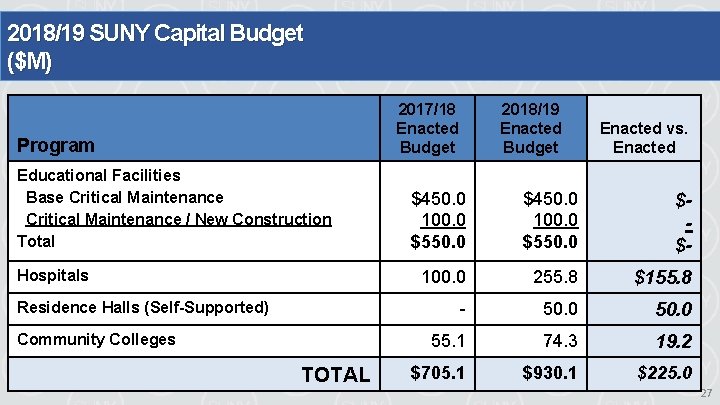
2018/19 SUNY Capital Budget ($M) 2017/18 Enacted Budget Program Educational Facilities Base Critical Maintenance / New Construction Total Hospitals Residence Halls (Self-Supported) Community Colleges TOTAL 2018/19 Enacted Budget Enacted vs. Enacted $450. 0 100. 0 $550. 0 $$- 100. 0 255. 8 $155. 8 - 50. 0 55. 1 74. 3 19. 2 $705. 1 $930. 1 $225. 0 27
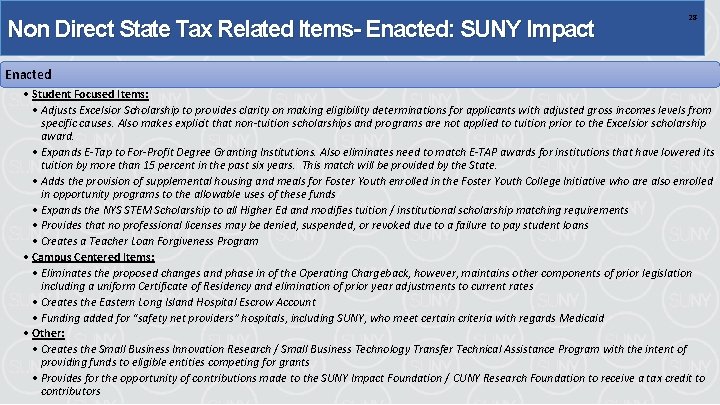
Non Direct State Tax Related Items- Enacted: SUNY Impact 28 Enacted • Student Focused Items: • Adjusts Excelsior Scholarship to provides clarity on making eligibility determinations for applicants with adjusted gross incomes levels from specific causes. Also makes explicit that non-tuition scholarships and programs are not applied to tuition prior to the Excelsior scholarship award. • Expands E-Tap to For-Profit Degree Granting Institutions. Also eliminates need to match E-TAP awards for institutions that have lowered its tuition by more than 15 percent in the past six years. This match will be provided by the State. • Adds the provision of supplemental housing and meals for Foster Youth enrolled in the Foster Youth College Initiative who are also enrolled in opportunity programs to the allowable uses of these funds • Expands the NYS STEM Scholarship to all Higher Ed and modifies tuition / institutional scholarship matching requirements • Provides that no professional licenses may be denied, suspended, or revoked due to a failure to pay student loans • Creates a Teacher Loan Forgiveness Program • Campus Centered Items: • Eliminates the proposed changes and phase in of the Operating Chargeback, however, maintains other components of prior legislation including a uniform Certificate of Residency and elimination of prior year adjustments to current rates • Creates the Eastern Long Island Hospital Escrow Account • Funding added for “safety net providers” hospitals, including SUNY, who meet certain criteria with regards Medicaid • Other: • Creates the Small Business Innovation Research / Small Business Technology Transfer Technical Assistance Program with the intent of providing funds to eligible entities competing for grants • Provides for the opportunity of contributions made to the SUNY Impact Foundation / CUNY Research Foundation to receive a tax credit to contributors
Enrollment and High School Graduates 29
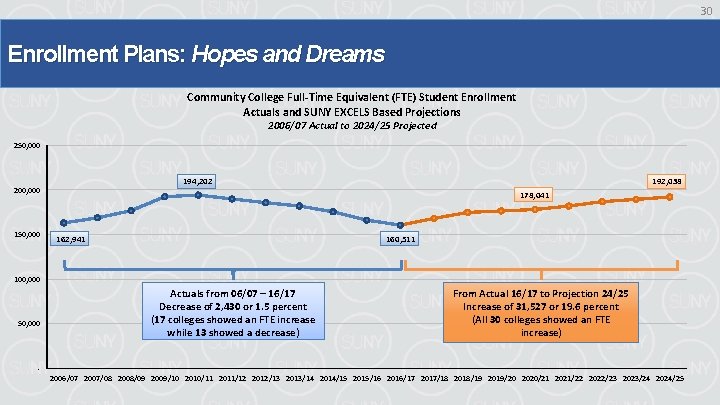
30 Enrollment Plans: Hopes and Dreams Community College Full-Time Equivalent (FTE) Student Enrollment Actuals and SUNY EXCELS Based Projections 2006/07 Actual to 2024/25 Projected 250, 000 194, 202 200, 000 150, 000 192, 038 178, 041 162, 941 160, 511 100, 000 50, 000 Actuals from 06/07 – 16/17 Decrease of 2, 430 or 1. 5 percent (17 colleges showed an FTE increase while 13 showed a decrease) From Actual 16/17 to Projection 24/25 Increase of 31, 527 or 19. 6 percent (All 30 colleges showed an FTE increase) 2006/07 2007/08 2008/09 2009/10 2010/11 2011/12 2012/13 2013/14 2014/15 2015/16 2016/17 2017/18 2018/19 2019/20 2020/21 2021/22 2022/23 2023/24 2024/25
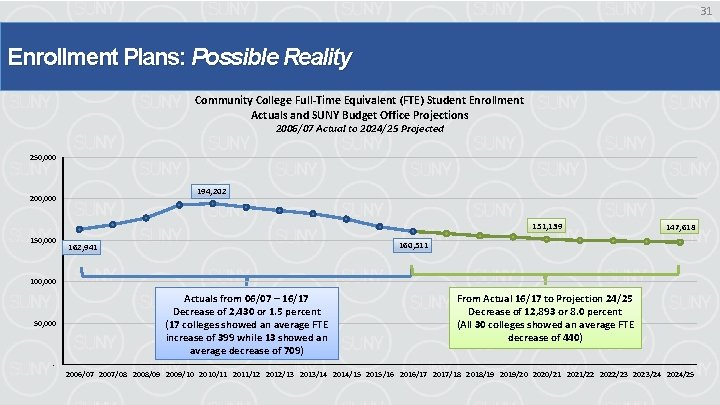
31 Enrollment Plans: Possible Reality Community College Full-Time Equivalent (FTE) Student Enrollment Actuals and SUNY Budget Office Projections 2006/07 Actual to 2024/25 Projected 250, 000 194, 202 200, 000 151, 139 150, 000 147, 618 160, 511 162, 941 100, 000 50, 000 Actuals from 06/07 – 16/17 Decrease of 2, 430 or 1. 5 percent (17 colleges showed an average FTE increase of 399 while 13 showed an average decrease of 709) From Actual 16/17 to Projection 24/25 Decrease of 12, 893 or 8. 0 percent (All 30 colleges showed an average FTE decrease of 440) 2006/07 2007/08 2008/09 2009/10 2010/11 2011/12 2012/13 2013/14 2014/15 2015/16 2016/17 2017/18 2018/19 2019/20 2020/21 2021/22 2022/23 2023/24 2024/25
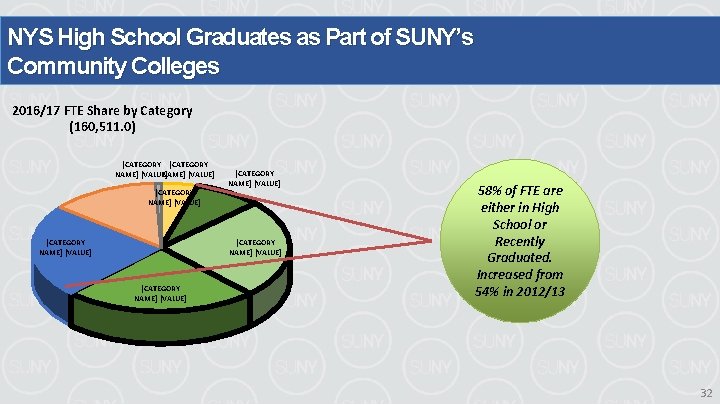
NYS High School Graduates as Part of SUNY’s Community Colleges 2016/17 FTE Share by Category (160, 511. 0) [CATEGORY NAME] [VALUE] [CATEGORY NAME] [VALUE] 58% of FTE are either in High School or Recently Graduated. Increased from 54% in 2012/13 32
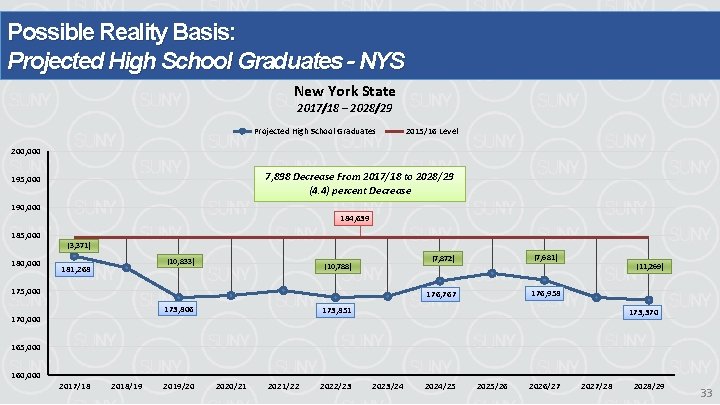
Possible Reality Basis: Projected High School Graduates - NYS New York State 2017/18 – 2028/29 Projected High School Graduates 2015/16 Level 200, 000 7, 898 Decrease From 2017/18 to 2028/29 (4. 4) percent Decrease 195, 000 190, 000 184, 639 185, 000 (3, 371) 180, 000 (10, 833) 181, 268 (10, 788) 175, 000 173, 806 170, 000 (7, 872) (7, 681) 176, 767 176, 958 (11, 269) 173, 851 173, 370 165, 000 160, 000 2017/18 2018/19 2019/20 2020/21 2021/22 2022/23 2023/24 2024/25 2025/26 2026/27 2027/28 2028/29 33
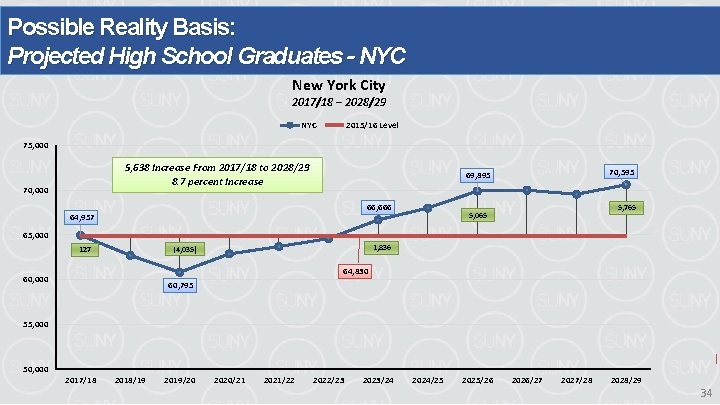
Possible Reality Basis: Projected High School Graduates - NYC New York City 2017/18 – 2028/29 NYC 2015/16 Level 75, 000 5, 638 Increase From 2017/18 to 2028/29 8. 7 percent Increase 70, 000 70, 595 69, 895 66, 666 64, 957 5, 765 5, 065 65, 000 1, 836 (4, 035) 127 64, 830 60, 000 60, 795 55, 000 50, 000 2017/18 2018/19 2019/20 2020/21 2021/22 2022/23 2023/24 2024/25 2025/26 2026/27 2027/28 2028/29 34
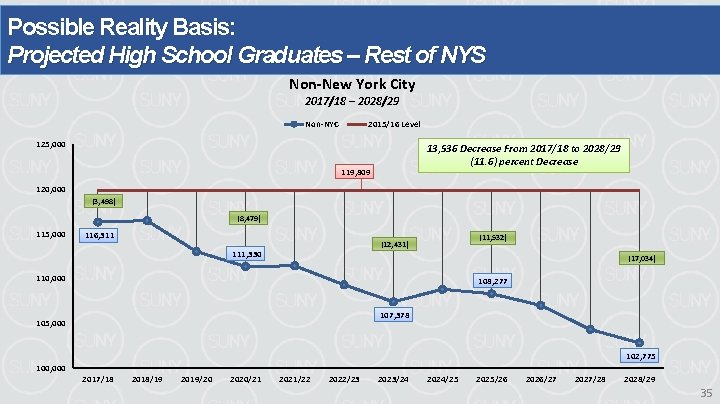
Possible Reality Basis: Projected High School Graduates – Rest of NYS Non-New York City 2017/18 – 2028/29 Non-NYC 2015/16 Level 125, 000 13, 536 Decrease From 2017/18 to 2028/29 (11. 6) percent Decrease 119, 809 120, 000 (3, 498) (8, 479) 115, 000 116, 311 (11, 532) (12, 431) 111, 330 (17, 034) 110, 000 108, 277 107, 378 105, 000 102, 775 100, 000 2017/18 2018/19 2019/20 2020/21 2021/22 2022/23 2023/24 2024/25 2025/26 2026/27 2027/28 2028/29 35
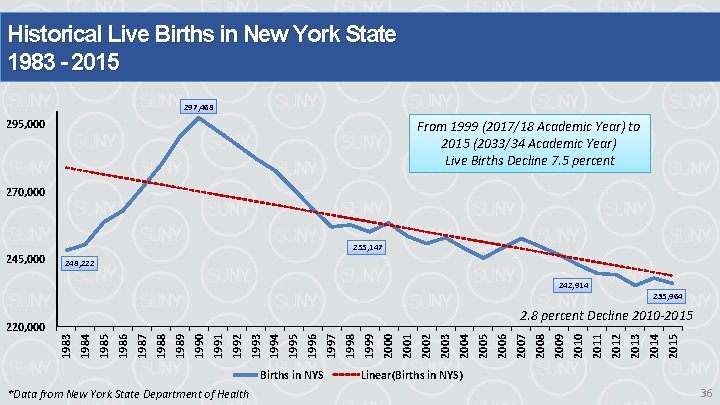
Historical Live Births in New York State 1983 - 2015 297, 468 295, 000 From 1999 (2017/18 Academic Year) to 2015 (2033/34 Academic Year) Live Births Decline 7. 5 percent 270, 000 245, 000 255, 147 248, 222 242, 914 235, 964 *Data from New York State Department of Health 2015 2014 2013 2012 2011 2010 2009 2008 2006 2005 2004 2003 2002 2001 2000 1999 1998 1997 1996 1995 1994 1993 1992 1991 1990 1989 1988 1987 1986 1985 1984 1983 Births in NYS 2007 2. 8 percent Decline 2010 -2015 220, 000 Linear(Births in NYS) 36
Thank You Questions? Concerns? 37
- Slides: 37