Synthetic Rock Mass modeling for determination of geomechanical


")


 and the Synthetic Rock Mass approach - Numerical tool for")
 and the Synthetic Rock Mass approach - Microproperties of bonds")
 and the Synthetic Rock Mass approach - Smooth Joint contact")
 and the Synthetic Rock Mass approach - Discrete fracture network")
 and the Synthetic Rock Mass approach + Intact rock representation")
 and the Synthetic Rock Mass approach - Run pseudo-laboratory tests")

 0. 038 × 0. 076")
 0.")
")


 Narr")
 Narr")
: 0, 3")
 Producing reservoir Stress increase")


 How is REV dependent on variations in bed")
 Post-peak behavior 2× 2× 4 m rock mass")

- Slides: 32
Synthetic Rock Mass modeling for determination of geomechanical properties reservoir rock masses Nicholas Thompson Postdoctoral researcher Department of Petroleum Engineering and Applied Geophysics Norwegian University of Science and Technology
Outline: - Rock mass heterogeneity and scale effects - DEM/Synthetic Rock Mass modeling approach - Example – Effect on reservoir compaction - Discussion of on-going work
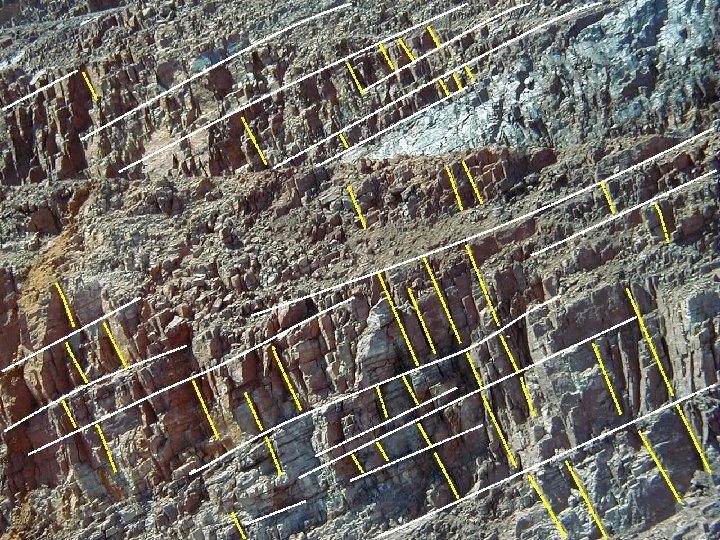
Rock mass heterogeneity Image: Helge Langeland/Statoil Archive
Rock mass heterogeneity -MDEM simulation of stress changes due to depletion at the Elgin-Franklin reservoir (North Sea, UK sector) ∆σ’v (MPa) - Alassi et al. (2010) m-km scale
Rock mass heterogeneity σ 0. 076 m Image: SINTEF Petroleum Research 0. 038 m ε
Rock mass heterogeneity – scale effects Intact laboratory sample σ ε Reservoir rock mass
Rock mass heterogeneity – scale effects Decreasing strength/stiffness Hoek & Brown (1997)
Rock mass heterogeneity – scale effects Property V E R Volume Hoek & Brown (1997) REV – Representative Elementary Volume
Rock mass heterogeneity – scale effects - Discontinuities are commonly present in rock units - Discontinuities have significant effects on the geomechanical parameters of the rock mass - Rock mass might be treated as a equivalent continuum at the REV - These effects should be accounted for in reservoirscale geomechanics simulations
Discrete element modeling (DEM) and the Synthetic Rock Mass approach - Numerical tool for analysis of geomaterials and particulate systems - Bonded particle assemblies simulate the geomechanical behavior of rock
Discrete element modeling (DEM) and the Synthetic Rock Mass approach - Microproperties of bonds calibrated so that the macroresponse of the particle assembly matches that of the material in question E 1
Discrete element modeling (DEM) and the Synthetic Rock Mass approach - Smooth Joint contact model - Representation of rock mass discontinuities (smooth interface) g Discontinuity
Discrete element modeling (DEM) and the Synthetic Rock Mass approach - Discrete fracture network (DFN) Discontinuity
Discrete element modeling (DEM) and the Synthetic Rock Mass approach + Intact rock representation = DFN SRM
Discrete element modeling (DEM) and the Synthetic Rock Mass approach - Run pseudo-laboratory tests - Determine REV of rock mass in question - Determine geomechanical parameters - Observe changes in post-peak behavior
Example – Effect on reservoir compaction Producing reservoir Arbitrary reservoir, 2. 5 km depth
Example – Effect on reservoir compaction Laboratory Size (m) 0. 038 × 0. 076 Particles -- Particle radii (m) -- UCS (MPa) 14. 7 E (GPa) 4. 2 ν 0. 28 φ 35°
Example – Effect on reservoir compaction Laboratory PFC 2 D calibration Size (m) 0. 038 × 0. 076 0. 1 × 0. 2 Particles -- 367 Particle radii (m) -- 3 e-3 – 4. 98 e-3 UCS (MPa) 14. 7 E (GPa) 4. 2 ν 0. 28 φ 35° 27. 4°
Example – Effect on reservoir compaction Laboratory PFC 2 D calibration Large-scale Size (m) 0. 038 × 0. 076 0. 1 × 0. 2 0. 5 × 1 Particles -- 367 9197 Particle radii (m) -- 3 e-3 – 4. 98 e-3 UCS (MPa) 14. 7 17. 7 E (GPa) 4. 2 4. 4 ν 0. 28 φ 35° 27. 4° 24°
Example – Effect on reservoir compaction
Example – Effect on reservoir compaction - Vertical spacing – λ λ RQD = Palmstrom (2005) Σ length of core pieces > 10 cm Total length of core
Example – Effect on reservoir compaction - Vertical spacing – λ RQD = 100 e-0. 1λ(0. 1λ + 1) Priest and Hudson (1975) λ RQD Range (%) Qualitative description Selected RQD Equivalent spacing (m) 0 -25 Very poor 12. 5 0. 028 25 -50 Poor 37. 5 0. 047 50 -75 Fair 62. 5 0. 077 75 -90 Good 82. 5 0. 133 90 -100 Excellent 95 0. 282
Example – Effect on reservoir compaction - Horizontal spacing Fracture Spacing Index (FSI) Narr and Suppe (1991) - FSI = 1. 3 (Range 0. 5 -1. 5) - FSI = 0. 5, 1, 1. 5 to create DFNs
Example – Effect on reservoir compaction - Horizontal spacing Fracture Spacing Index (FSI) Narr and Suppe (1991) - Discontinuity properties: • k. N = 100 GPa/m • k. S = 50 GPa/m • μ = 0. 6 • cohesion = dilation = 0
Example – Effect on reservoir compaction - Laboratory results (FSI = 1): 0, 3 E (GPa) 3 2 0, 1 1 E v 0 0 0 25 50 75 100 RQD% 20 40 15 35 10 30 5 25 UCS 0 0 25 φ 50 20 75 RQD% • Decreasing strength/stiffness with decreasing rock mass quality • Best case (RQD = 100%) • Worst case (RQD = 12. 5%) 100 Friction angle 0, 2 Poisson’s ratio 4 UCS (MPa) 5
Example – Effect on reservoir compaction Stress decrease ∆σ’v (MPa) Producing reservoir Stress increase Best case (RQD = 100%) Stress decrease - MDEM, 10 MPa depletion - Stress arching ∆σ’v (MPa) Stress increase Worst case (RQD = 12. 5%, FSI = 1. 0)
Example – Effect on reservoir compaction - Limitations to example presented: - 2 D - REV not considered - Discontinuity properties - Idealized fracture network
On-going work - 3 D - Determine REV - Discontinuity property calibration 2× 2× 4 m rock mass
On-going work - Key questions: 1) How is REV dependent on variations in bed height and fracture spacing? 2) Degree of change in geomechanical parameters at REV? 2× 2× 4 m rock mass 3) How do the results match with analytical solutions?
On-going work - Key questions: 4) Post-peak behavior 2× 2× 4 m rock mass
Thank you! Acknowledgements - ROSE project partners - Rune Holt, Idar Larsen, Haitham Alassi (SINTEF), Diego Mas Ivars (Itasca), Ian Clark (Geo. Net)