Sustaining our Future by Rebuilding our Past Energy

Sustaining our Future by Rebuilding our Past Energy Efficiency in Existing Buildings – Our Greatest Opportunity for a Sustainable Future

ASHRAE’s Sustainability Goals The Path Towards Net Zero Energy Buildings Resolving the Issues of Increasing Demand, Decreasing Supply and Environmental Impact.

ASHRAE Sustainability Initiatives ASHRAE is working hard in a wide range of areas to support the goals of sustainability for reduction in energy use and green house gas emissions. • • 2006 Strategic Plan Green Guide 2 nd Edition Sustainability Roadmap Vision 2020 Report – NZEB goals Building Performance Metrics Projects ASHRAE Building Energy Labeling Program Educational, Certification & Research Programs www. ashrae. org

Total Energy Consumption www. highperformance buildings. gov Buildings Consume 40% of US Primary Energy

Buildings Represent • 17% of fresh water consumption • 25% of wood consumption • 33% of CO 2 emissions • 30% of waste generation • 40% of energy use • 55% of natural gas use • 72% of electrical energy use

PER CAPITA ENERGY CONSUMPTION Worldwide Average 200 Kwh/capita/year India 450 Kwh/ca[pita/year China 1800 Kwh/capita/year Argentina/Brazil 2, 200 Kwh/capita/year Europe 6, 000 Kwh/capita/year Kuwait 13, 600 Kwh/capita/year USA 16, 000 Kwh/capita/year

Available Data Bases for Commercial Buildings Energy Information Agency under US Department of Energy Commercial Building Energy Consumption Survey – CBECS www. eia. doe. gov/emeu/cbecs Whole Building Design Guide www. wbdg. org

Driven by the relentless growth in human population and in individual consumption, our global footprint now exceeds the world’s capacity to regenerate (itself) by about 30% James P. Leape – Director General World Wide Fund for Nature

Why Are We Here?

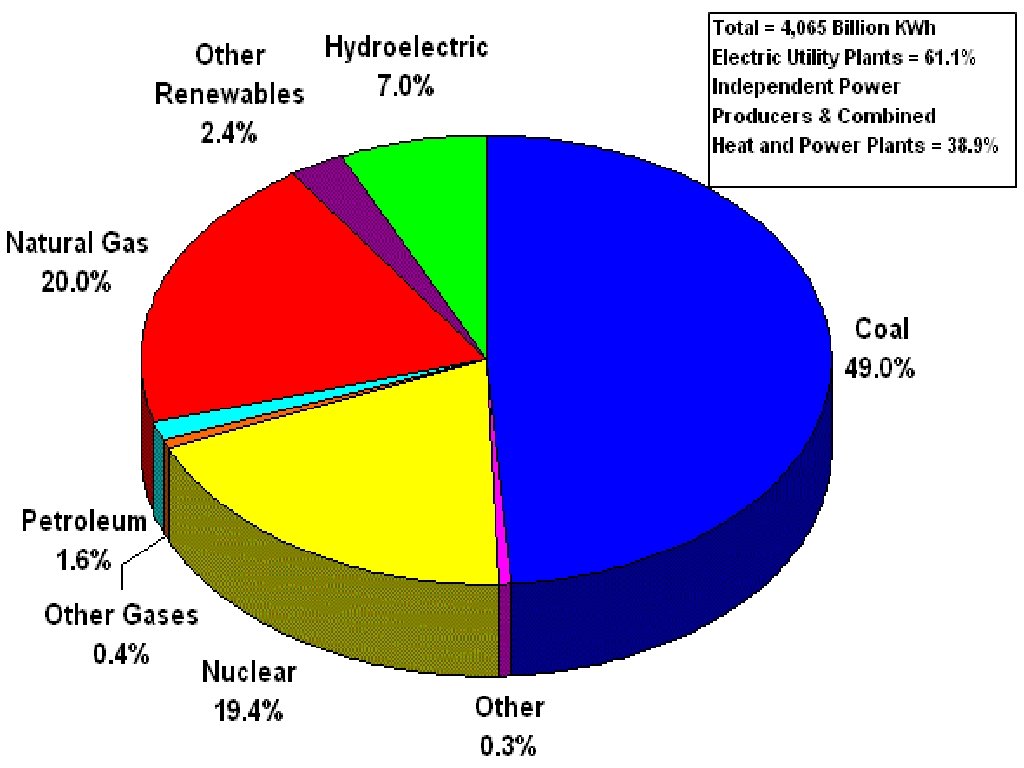
USA Energy Production and Imports 1975 Oil Gas 2005 2030 70%/30% 30%/70% ? ? ? 100% 70%/30% ? ? ?

Global warming IPCC - Intergovernmental Panel Global warming Climate Change The true rise of sea level might be as great as several meters by 2010

EUROSURVEILLANCE The August 2003 Heat Wave in EU A record heat wave scorched Europe in August 2003, claiming an estimated 35. 000 lives. In France alone, 14. 802 people died from the searing temperatures— more than 19 times the death toll from the SARS epidemic worldwide. In the worst heat spell in decades, temperatures in France soared to 104 degrees Fahrenheit (40 degrees Celsius) and remained unusually high for two weeks.
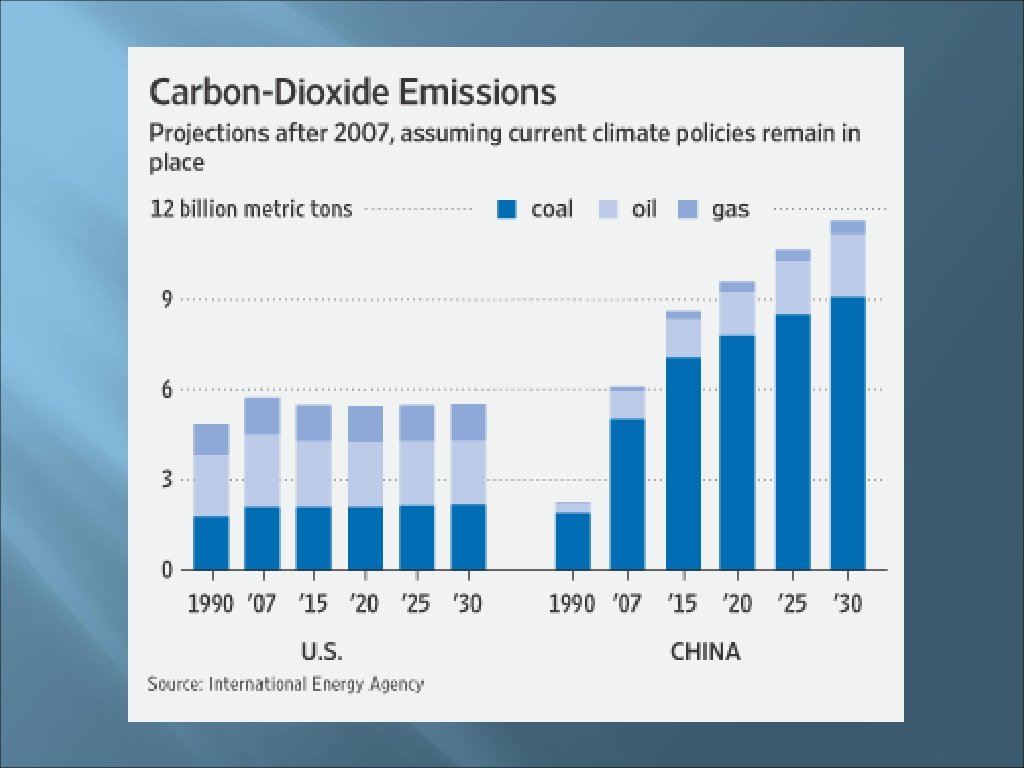

Atmospheric CO 2 Levels Pre-industrial: 180 - 280 PPM 2007: 380 PPM 2050 Business as usual: 580 PPM Can we afford to take a chance?

Per Capita CO 2 Emissions World: 4. 3 Metric tons/person OECD Nations: 11 Metric tons/person USA: 19 Metric tons/person Global CO 2 Emissions 2009: 30 Billion metric tons 2030: 42 Billion metric tons

CO 2 Emission Reduction USA Copenhagen Commitment 17% Reduction by 2020 Previous Commitment 45% by 2030 80% by 2050 How do we achieve that without significantly raising energy prices?

The Cost of Being Green What is the cost of taking energy out of buildings? Estimated clean energy annual investment WEO 2008 550 ppm - $380 Billion per year WEO 2008 450 ppm - $542 Billion per year G I - $450 - $600 Billion per year until 2030 Mc. Kinsey - Energy Efficiency - $170 Billion per year in the USA Offering 17% ROI Saving 9. 3 Quads/yr (23%) by 2020 Mc. Kinsey Global Institute

Our Greatest Opportunities? 2% of Building Projects are New Construction 86% of Construction Dollars go into Existing Buildings 75% to 80% of All Buildings That will Exist in 2030 Exist Today!

Our Greatest Opportunities Existing Buildings Barriers To Success 1. 2. 3. 4. 5. Legislative/ Political Economic Technical Cultural Societal

Our Greatest Opportunities Existing Buildings

Energy Efficiency in Existing Buildings What Have We Learned?

ASHRAE – Cohesive Program to Promote Energy Efficiency in Existing Buildings • Standards • Guidelines • Design Guides • Design Manuals • Handbooks • Educational Programs

Why Energy Efficiency and In the Life Cycle of a Building Sustainable Buildings Initial Construction Cost is only 2% In the Life Cycle of a Building Operational and Energy Cost is only 6% Initial Construction Cost is only 2% Occupancy Cost Accounts for 92% Operational and Energy Cost is only 6% Occupancy Cost Accounts for 92%

Energy Saving Incentive Programs Energy Policy Act - EPAC 2005 Energy Independence and Security Act - EISA 2007 American Clean Energy and Security Act ACES 2009? ? ? Tax Incentive & Assistance Program - TIAP American Recovery and Reinvestment Act – ARRA www. dsireusa. org
 requires new")
NZEB for Federal Facilities Energy Independence and Security Act of 2007 (EISA) requires new federal buildings to reduce their fossil fuel based energy use by 55% by 2010 and to zero by 2030. EPAC 2005 / EISA 2007 Existing Federal Buildings 30% reduction in energy use by 2015 Co-Sponsors: ASHRAE, AIA, ACCA, GBI, ICC, IFMA, NFPA, NIBS, USGBC and others

FEDERAL ENERGY LEGISLATION HR 2454 AMERICAN CLEAN ENERGY AND SECURITY ACT – 2009 S. 1462 Energy Bill & S. 1733 CLIMATE CHANGE 30% Reduction in Energy by 2010 50% Reduction in Energy by 2016 Res & Com

Net-Zero-Energy Buildings which, on an annual basis, use no more energy than is provided by on-site renewable energy sources.

David JC Mac. Kay, Ph. D Physics Professor University of Cambridge Sustainable Energy – without the hot air Renewable Energy Sources in the UK Source Capacity 35 GW 20 GW Cost Billions £ 27 £ 36 Yield per Billion £ 1. 3 GW/£ 0. 8 GW/£ On Shore Wind Off Shore Wind Photo Voltaic Farm Waste Incineration Heat Pumps Clean Coal Nuclear Power Cost Per Cost/Person /GW £ 450 £ 12. 8 £ 650 £ 32. 5 48 GW £ 190 0. 25 GW/£ £ 3200 £ 66. 6 3. 0 GW £ 8. 5 0. 35 GW/£ £ 140 £ 46. 6 210 GW 8. 0 GW 45 GW £ 60 £ 16 £ 60 35 GW/£ 0. 75 GW/£ £ 1000 £ 270 £ 1000 £ 4. 75 £ 33. 75 £ 22. 2
")
The Path to a Net Zero Building cash flow Lease Costs (or Finance Costs) Total Annual Costs ($/year) utility bills 1 2 0 0% Source Energy Savings (%) 100%

ASHRAE’s Path Forward Tools for Energy Efficient Buildings • Advanced Energy Design Guides • Standard 90. 1 • Standard 189. 1 • Standard 100 • Commissioning and Retro Commissioning • Operation and Maintenance Guidance
 30% Series –Retail, Office ,")
ASHRAE Sustainability Initiatives b Advanced Energy Design Guides (AEDG) 30% Series –Retail, Office , K-12 Schools, Warehouses , Highway Lodgings, - Already Published Health Care Facilities out shortly

ASHRAE AEDGs If Every One of the 225, 000 Downloads of the AEDGs Resulted in Just One Project Being Designed at 30% Saving We Would Save: 115 Trillion Btu/Year 19. 8 Million Tons CO 2/Year $1. 30 Billion Per Year

Now What? Additional Advanced Energy Design Guides Planned or In Process Energy Efficiency Guides for Existing Buildings Business Case Technical Guide Owning and Operating Guide

Our Path Forward for the AEDGs • Complete the 30% Guide Series • Complete the Existing Building Guide Series • Develop the 50% and NZEB Design Guides • Target completion of the 50% series is 2009 -2011 • Target completion of the NEZB series is 2013 -2015

Current State Adoptions of Standard 90. 1

Our Path Forward for Standard 90. 1 • Consider Plug and Process Loads • Evaluate use of Cost Based Site or Source EUIs • Develop the User’s Manual • Consider Performance Based Analysis

ANSI/ASHRAE/IESNA Standard 189. 1 P

Our Path Forward for Standard 189. 1 • Complete and Publish the Standard in 2009 • Set a Clear Timeline to Get to Net Zero in 2030 • Develop the User’s Manual • Identify Application of Renewables in Dense Urban Areas Consider Two Tiers of Energy Performance

ANSI/ASHRAE/IESNA Standard 100 -2010? 40

Our Path Forward for Standard 100 • Further develop the standard • Include Energy Conservation Measures (ECMs) • Include Life Cycle Cost Analysis techniques. • Consider requirements to do Energy Modeling and Load Simulation

ASHRAE Energy Targets Year 2004 2007 2010 2013 2016 2020 2025 2030 * Excludes ASHRAE ENERGY TARGETS Standard 90. 1* 90. 1 ** 189. 1 1# 2## 43. 75 70. 70 --40. 60 -33. 1 49. 0 30. 6* 49. 0 ! 28. 2 40. 95 27. 0* 42. 0 ! 24. 7 36. 1 21. 85* 35. 35 ! 18. 0 31. 85 18. 0* 24. 0 ! 12. 6 18. 2 14. 0* 18. 0 ! 6. 30 9. 10 10. 0* 16. 0 ! Zero AEDGs ### 1# 2## 37. 3 54. 26 26. 7 38. 27 24. 0 35. 70 18. 0 31. 85 Zero Zero Plug and Process Loads ** Including Plug and Process Loads #Targeted at 30% below Standard 90. 1 -2004 Excludes Plug and Process Loads # #Targeted at 30% below Standard 90. 1 -2004 Includes Plug and Process Loads ### Targeted to be at 30% below Standard 90. 1 for 2007 -09 50% for 2009 -11 and net zero 20013 -15
 36000 Standard 90. 1 AEDG ASHRAE BOD")
Energy Reduction Proposal Ene rgy (k. Btu/yr) 36000 Standard 90. 1 AEDG ASHRAE BOD Goal 2010 2015 2020 Year 2025 2030 Standard 189

Identify Potential Energy Saving Measures for Existing Buildings Routine Maintenance and Repairs Retro – Commissioning Utility Tariffs/Negotiations Tenant Fit Out and Improvements Equipment Replacement Major Renovations

Identify Potential Energy Saving Measures for Existing Buildings Building Envelope Lighting Systems Window Replacement T 5 Versus T 8/T 12 Lamps Solar Films Caulking/Sealing Enhanced Insulation HVAC Systems Higher Equip. Efficiencies Heat Recovery Displacement Ventilation DOAS GSHP Compact Fluorescent Bulbs Electronic Ballasts Day Lighting Controls Motion Sensors Controls/Other Management Systems Maintenance Systems Monitoring/Auditing Applied Photo Voltaics Variable Speed Drives

Role of Commissioning and Retro Commissioning Why is Cx or RCx so Critical? • Buildings are very complex prototypical machines • Unique • Built on-site • Built by hand • Thousands of independent components Most buildings do not operate as intended

ASHRAE Guidelines ASHRAE Guideline 0 -2005, The Commissioning Process Describes the commissioning process capable of verifying a facility and its systems meet the owner’s project requirements ASHRAE Guideline 1 -2007, The HVAC Commissioning Process Describes the technical requirements for the application of the commissioning process that will verify HVAC systems achieve the owner’s project requirements

Our Path Forward for Operation and Maintenance • Complete the Work of the TRGs • Provide Training through the Chapters • Provide Educational Programs • Provide Certification Programs

ASHRAE Sustainability Initiatives Integrated Building Design IBD Manual of Practice Building Information Modeling BIM Guide “SMART” Documents Building Performance Metrics Carbon Equivalency Based ASHRAE Building Energy Labeling Program

ASHRAE Energy Labeling Building e. Q Program

2008 ASHRAE Environmental Guidelines for Datacom Equipment • Real Time Energy Consumption Measurement in Data Centers • Particulate and Gaseous Contamination in Datacom Environments • High Density Data Centers - Case Studies Best Practices - Second Edition • Best Practices for Datacom Facility Energy Efficiency - Second Edition • Structural and Vibration Guidelines for Datacom Equipment Centers • Liquid Cooling Guidelines for Datacom Equipment Centers • Design Consideration s for Datacom Equipment Centers - Second Edition • Datacom Equipment Power Trends and Cooling Applications - Second Edition • Thermal Guidelines for Data Processing Environments - Second Edition

ASHRAE HEADQUARTERS RENOVATION PROJECT – A LIVING LABORATORY 30% Higher Ventilation Rate than 62. 1 30% Lower Energy Use than 90. 1 2004


ASHRAE Educational and Certification Initiatives • ASHRAE Educational Programs - e. Learning • Complying with Standard 90. 1 • Building Commissioning • Engineering for Sustainability • ASHRAE Certification Programs - Engineering for Sustainability Professional - Building Ownership and Operation - Commissioning

High Performing Buildings Magazine § Launched November 2007 § Case Studies § Lessons Learned

Sustaining Our Future By Rebuilding Our Past Together We Can Make A Difference Together we can Build a Better World

Sustaining Our Future By Rebuilding Our Past When we build let it not be for present use alone. Let it be such work as our descendants thank us” John Ruskin 1875
- Slides: 58