
Sustainable Townsville By Michael Lunn Managing Director Sustainable
Sustainable Townsville By Michael Lunn Managing Director Sustainable Management Systems Consultancy
SUSTAINABILITY, INDICATORS, STRATEGY Australia 2001 N W E S
Drivers for Sustainable Queensland Comparative advantage Cost competitiveness and profitability Resource savings - more with less Risk reduction Performance standardisation internationally Community & Consumer expectations International trends
Sustainable Roadmap for Industry
Destination 1 The EPA helps industry to; – Measure and benchmark what they currently do – To conduct audits, reviews and assessments or – To develop a vision for progressing towards sustainability. back The EPA helps Communities to; – Develop sustainability indicators – Engage community in gathering performance data – To establish community aims, objectives and targets for progressing towards sustainability.
Destination 2 The EPA helps a industry to; – Use the knowledge gained in destination 1 to develop action plans and systems – Implement processes and technologies that will lead to improved economic, environmental and social performance The EPA helps communities to; – Develop a community strategy and action plans that have the ownership of key stakeholders – Establish strategic partnerships to integrate existing programs – Develop new initiatives to maintain and enhance the quality of life within the community
Destination 3 The EPA helps industry to; – leverage strategic, innovation and marketing benefits from their learnings » » » Eco-labelling External Verification Supply Chain influence Public Reporting Socially Responsible Investment » Spin-off technology opportuntities » Re-boot product or company life cycle The EPA helps Communities to; – To position and market themselves as a sustainable destination for working, living & visiting – Engage community in sustainable production & consumption – Provide feedback loops to Local, State & Federal Government – Foster true community engagement in addressing sustainability issues
Destination 4 The EPA helps industry to position themselves to; – Adapt to the rapidly changing market place – Be ready to exploit new opportunities – Set or influence future market realities – Be Sustainable The EPA helps communities to position themselves to; – Ensuring that the community as a whole is able to adapt to the changing world – Give community members a sense of control over their own destiny – Be Smart and Sustainable
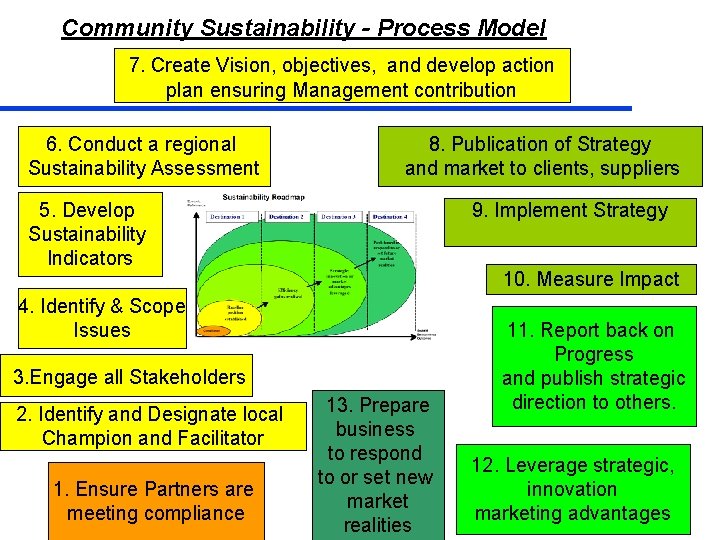
Community Sustainability - Process Model 7. Create Vision, objectives, and develop action plan ensuring Management contribution 6. Conduct a regional Sustainability Assessment 8. Publication of Strategy and market to clients, suppliers 9. Implement Strategy 5. Develop Sustainability Indicators 10. Measure Impact 4. Identify & Scope Issues 3. Engage all Stakeholders 2. Identify and Designate local Champion and Facilitator 1. Ensure Partners are meeting compliance 13. Prepare business to respond to or set new market realities 11. Report back on Progress and publish strategic direction to others. 12. Leverage strategic, innovation marketing advantages
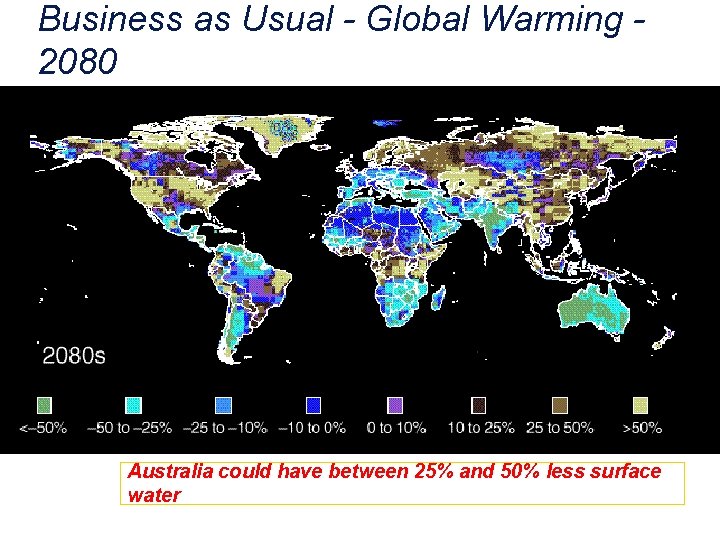
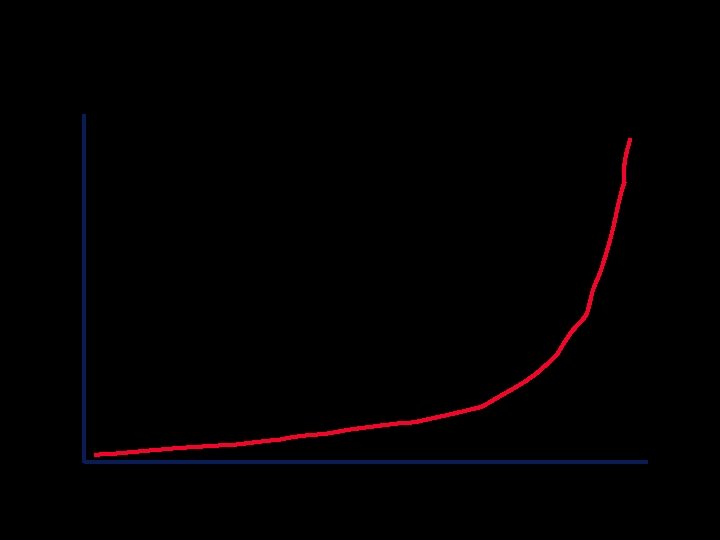
Business as Usual - Global Warming 2080 Australia could have between 25% and 50% less surface water
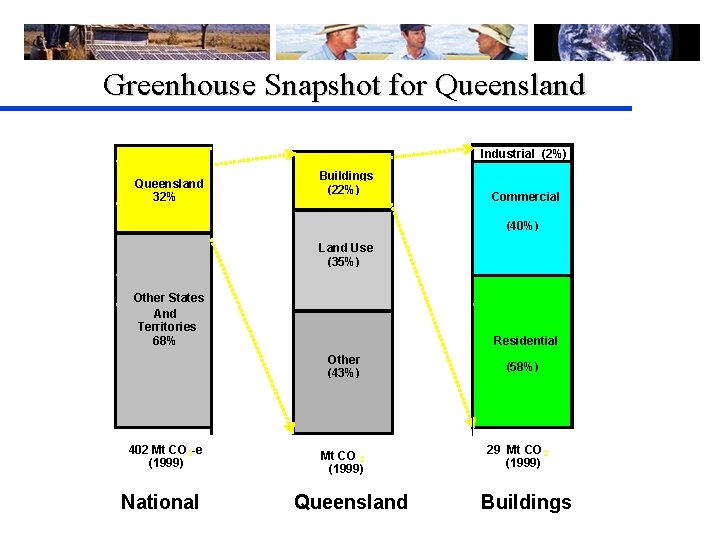
Greenhouse Snapshot for Queensland Industrial (2%) Queensland 32% Buildings (22%) Commercial (40%) Land Use (35%) Other States And Territories 68% Residential Other (43%) 402 Mt CO 2 -e (1999) National 128 Mt CO 2 -e (1999) Queensland (58%) 29 Mt CO 2 -e (1999) Buildings
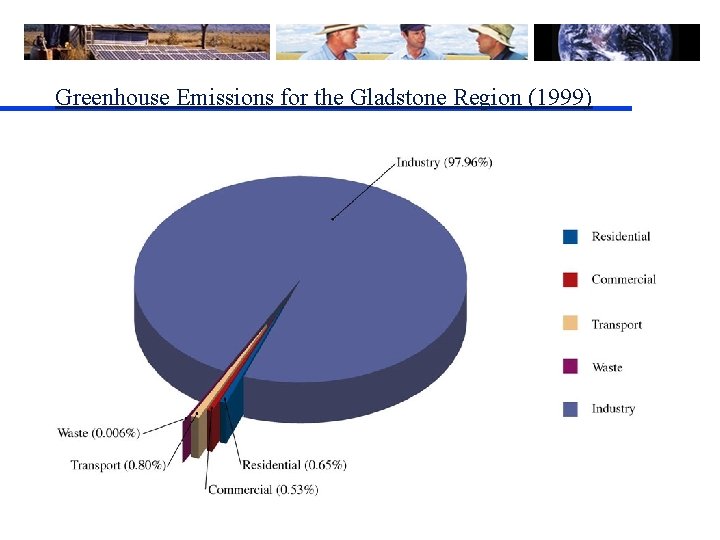
Greenhouse Emissions for the Gladstone Region (1999)


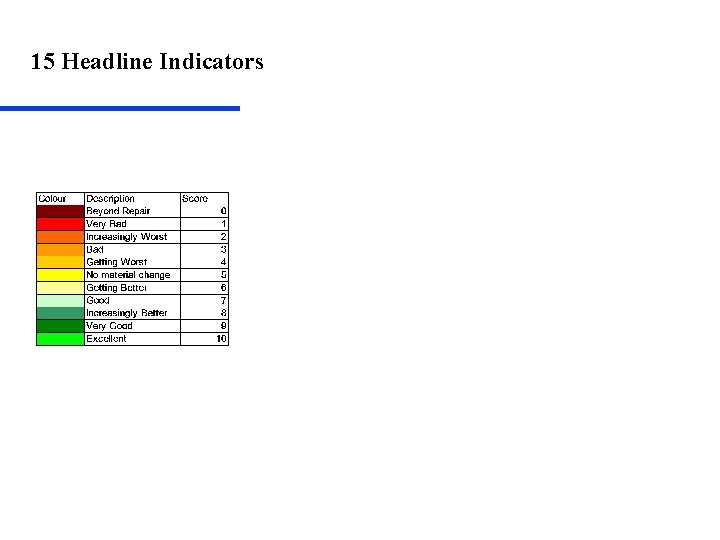
15 Headline Indicators
www. sustainablegladstone. com
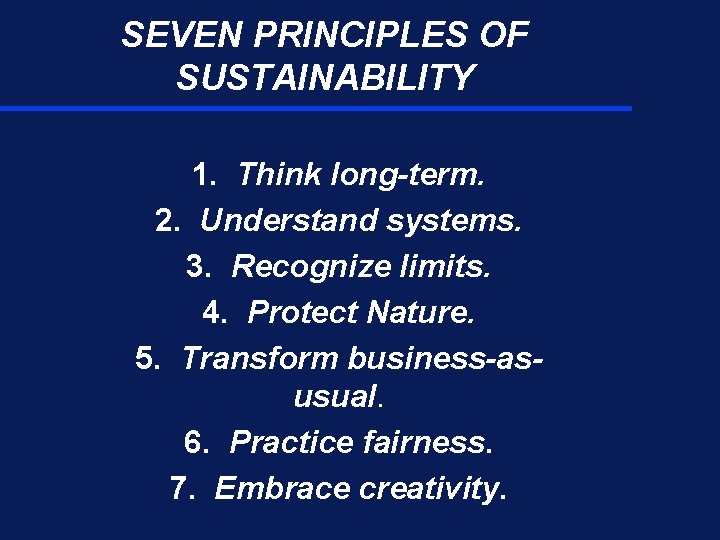
SEVEN PRINCIPLES OF SUSTAINABILITY 1. Think long-term. 2. Understand systems. 3. Recognize limits. 4. Protect Nature. 5. Transform business-asusual. 6. Practice fairness. 7. Embrace creativity.

N W E S
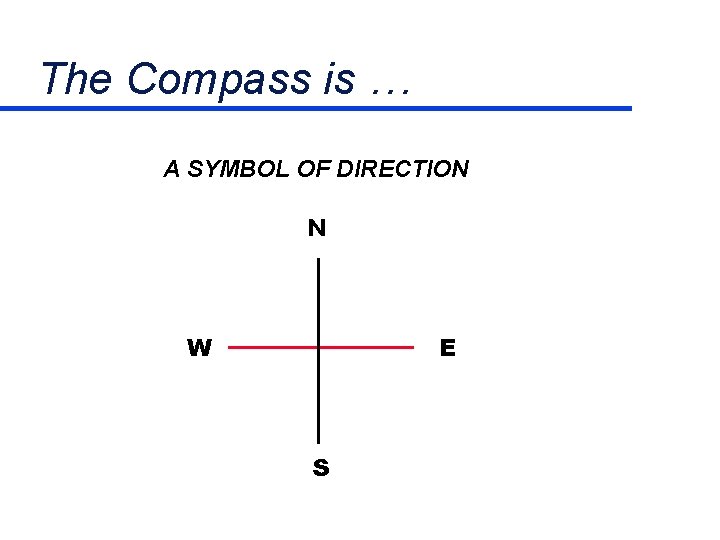
The Compass is … A SYMBOL OF DIRECTION N W E S
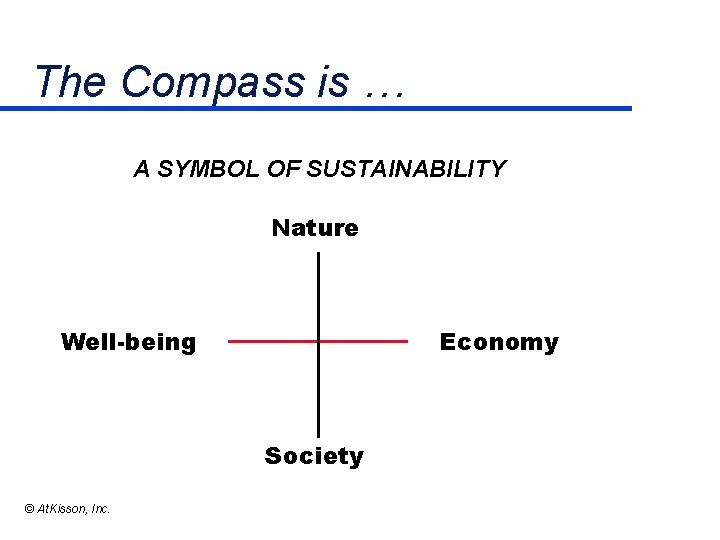
The Compass is … A SYMBOL OF SUSTAINABILITY Nature Well-being Economy Society © At. Kisson, Inc.
The Compass is …
“WALL CHART” Orlando, Florida, USA, 2000
INDICATORS An Introduction
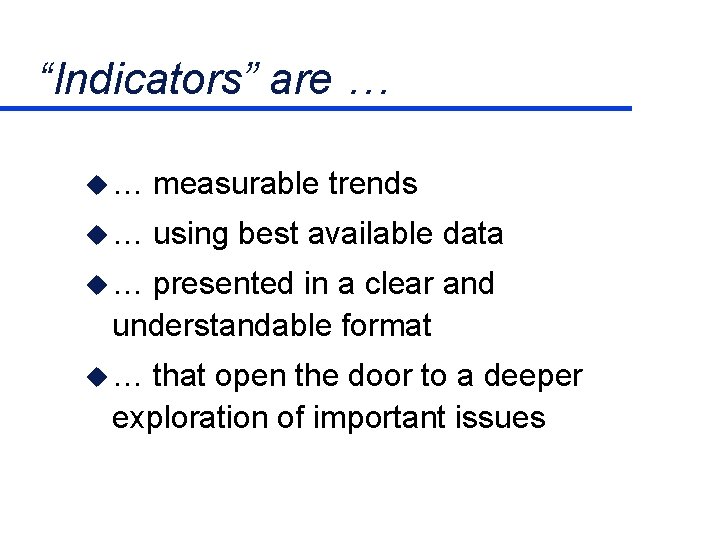
“Indicators” are … … measurable trends … using best available data … presented in a clear and understandable format … that open the door to a deeper exploration of important issues
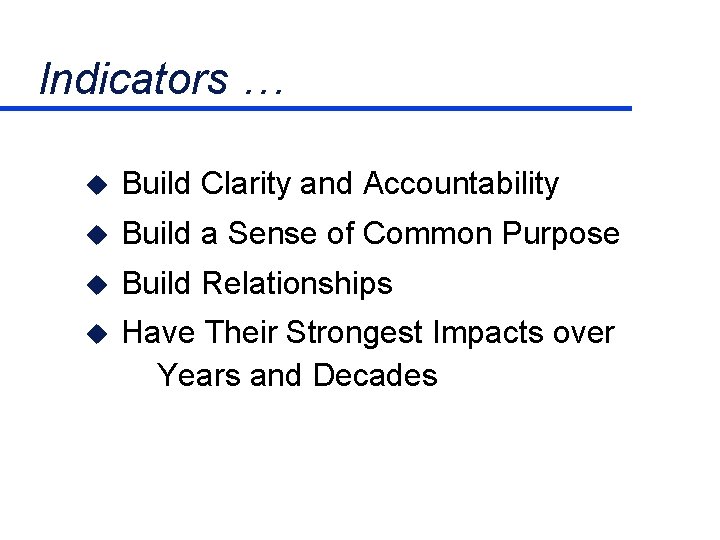
Indicators … Build Clarity and Accountability Build a Sense of Common Purpose Build Relationships Have Their Strongest Impacts over Years and Decades
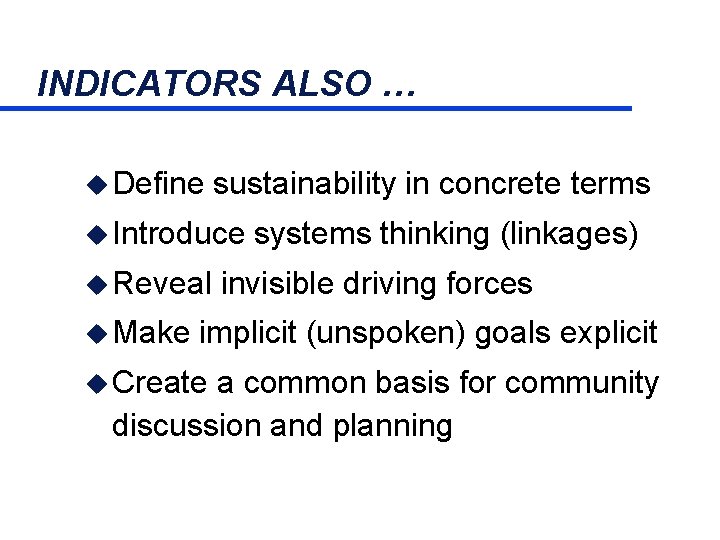
INDICATORS ALSO … Define sustainability in concrete terms Introduce Reveal Make systems thinking (linkages) invisible driving forces implicit (unspoken) goals explicit Create a common basis for community discussion and planning
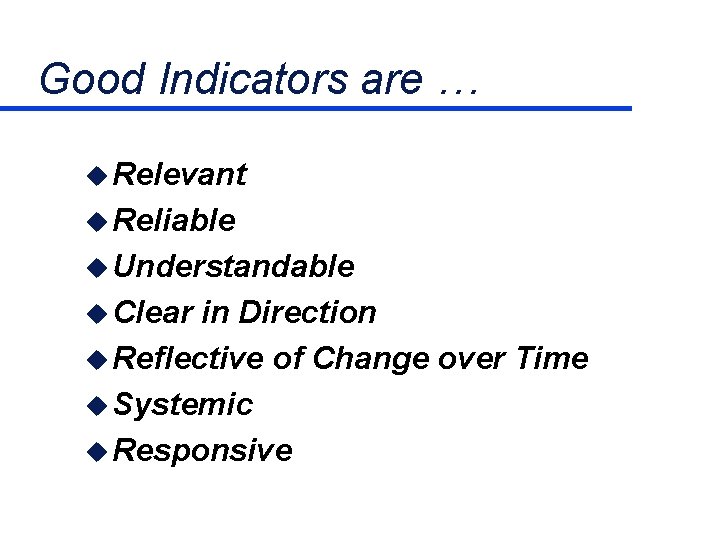
Good Indicators are … Relevant Reliable Understandable Clear in Direction Reflective of Change over Time Systemic Responsive
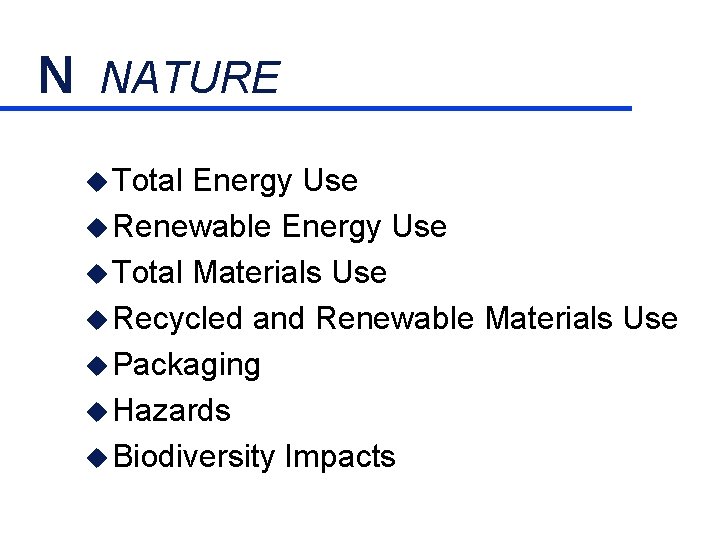
N NATURE Total Energy Use Renewable Energy Use Total Materials Use Recycled and Renewable Materials Use Packaging Hazards Biodiversity Impacts
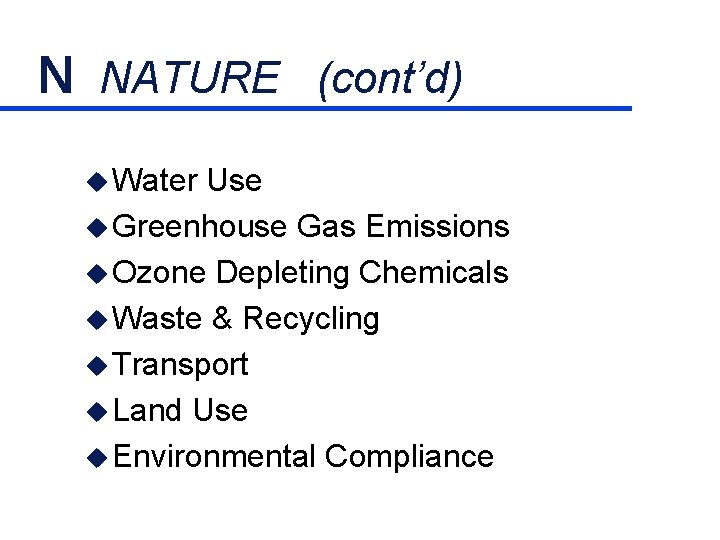
N NATURE (cont’d) Water Use Greenhouse Gas Emissions Ozone Depleting Chemicals Waste & Recycling Transport Land Use Environmental Compliance
E ECONOMY Scale of Operation Sales/Revenues Costs Value Added Assets & Liabilities Profits/Losses Productivity Patents and Intellectual Property
S SOCIETY Management Quality Management Systems Stakeholder Relationships Sustainability Policies (e. g. , Precautionary Principle) Participation in Industry Associations Performance and Compensation Issues
W WELL-BEING Employee Retention Employee Orientation to Vision Job Satisfaction Wage Sufficiency Health and Safety Non-Discrimination Training Human Rights
The Indicator Process Moving from Values To Metrics
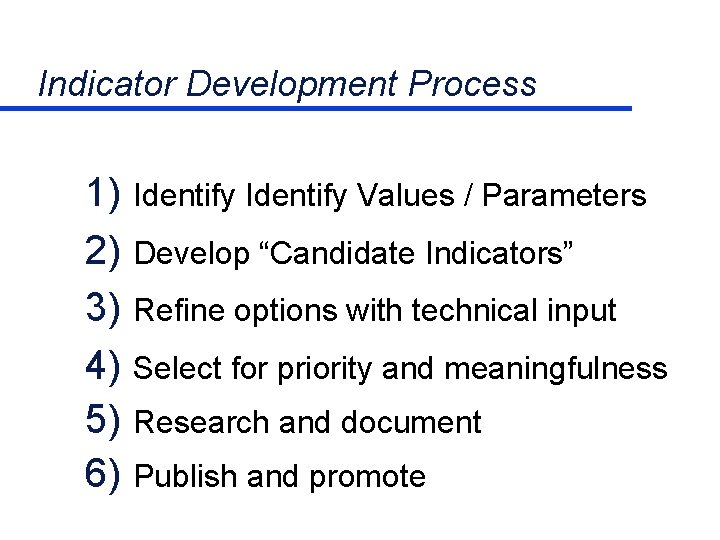
Indicator Development Process 1) Identify Values / Parameters 2) Develop “Candidate Indicators” 3) Refine options with technical input 4) Select for priority and meaningfulness 5) Research and document 6) Publish and promote
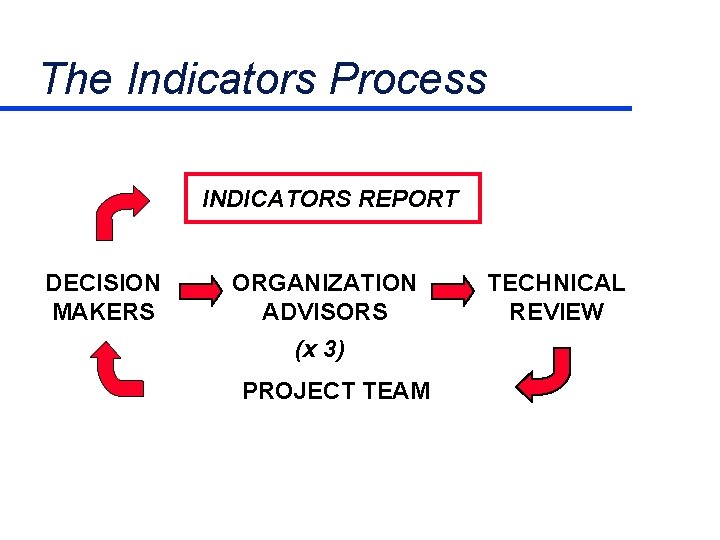
The Indicators Process INDICATORS REPORT DECISION MAKERS ORGANIZATION ADVISORS (x 3) PROJECT TEAM TECHNICAL REVIEW
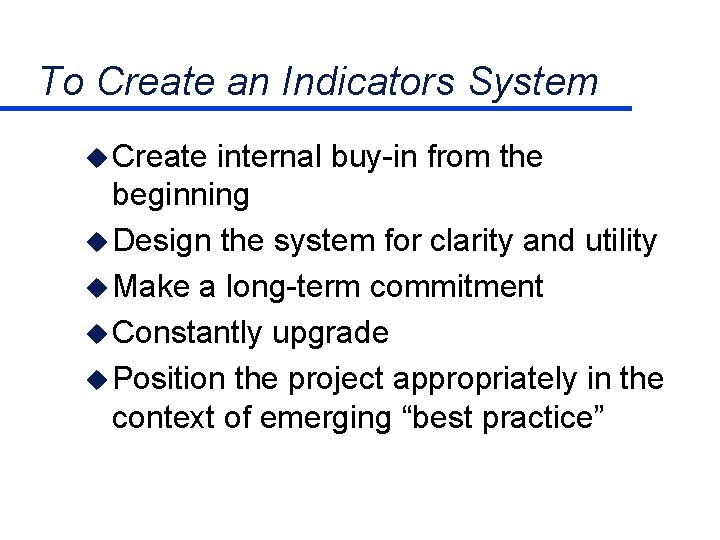
To Create an Indicators System Create internal buy-in from the beginning Design the system for clarity and utility Make a long-term commitment Constantly upgrade Position the project appropriately in the context of emerging “best practice”
Indicators and Innovation General Considerations on Introducing New Ideas

Source: Everett Rogers, reported in Alan At. Kisson, “Believing Cassandra”
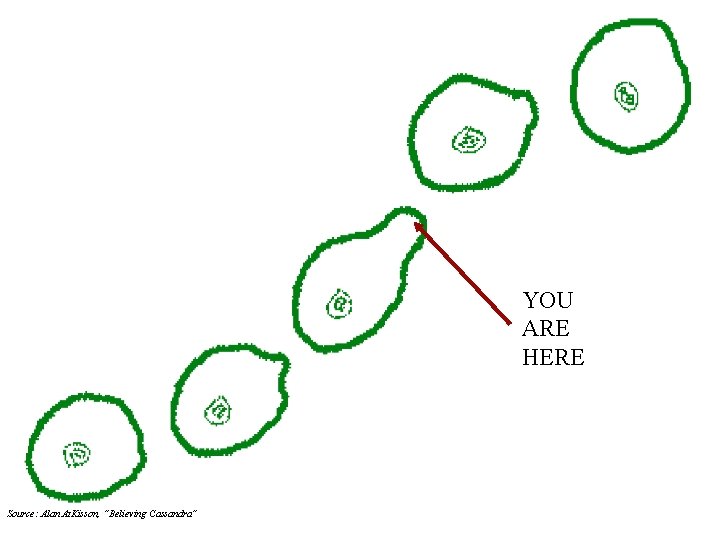
YOU ARE HERE Source: Alan At. Kisson, “Believing Cassandra”
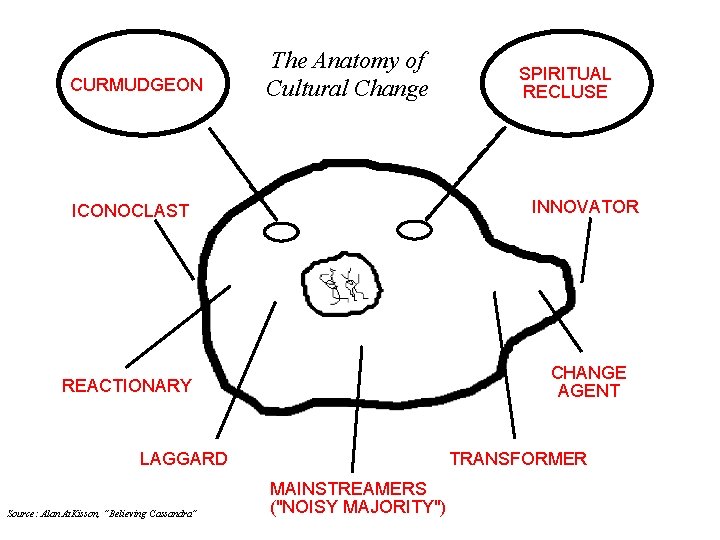
CURMUDGEON The Anatomy of Cultural Change SPIRITUAL RECLUSE ICONOCLAST INNOVATOR REACTIONARY CHANGE AGENT LAGGARD Source: Alan At. Kisson, “Believing Cassandra” TRANSFORMER MAINSTREAMERS ("NOISY MAJORITY")
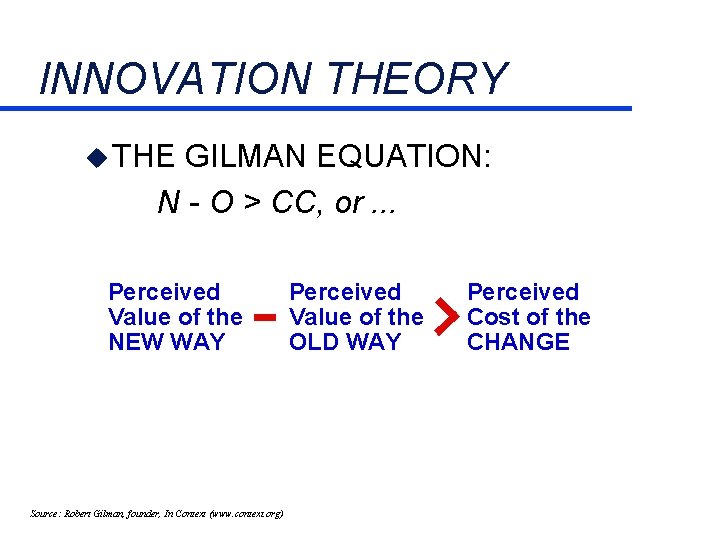
INNOVATION THEORY THE GILMAN EQUATION: N - O > CC, or. . . Perceived Value of the NEW WAY Source: Robert Gilman, founder, In Context (www. context. org) Perceived Value of the OLD WAY Perceived Cost of the CHANGE
From Indicators to Strategy Introducing The Pyramid of Sustainable Development
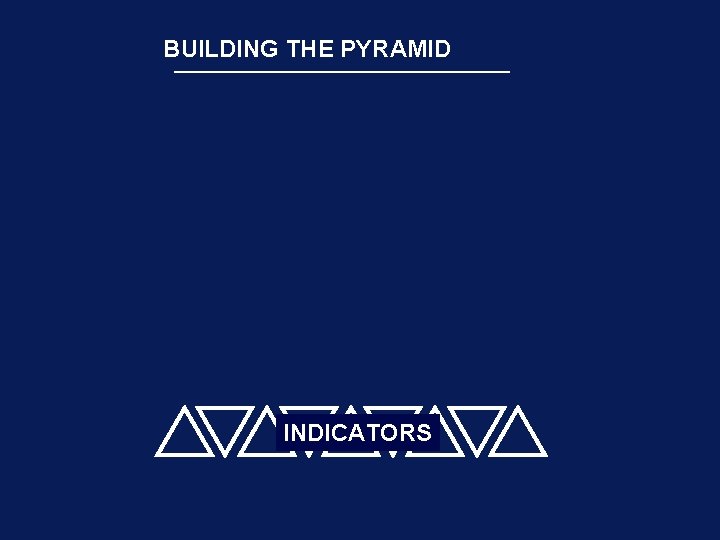
BUILDING THE PYRAMID INDICATORS
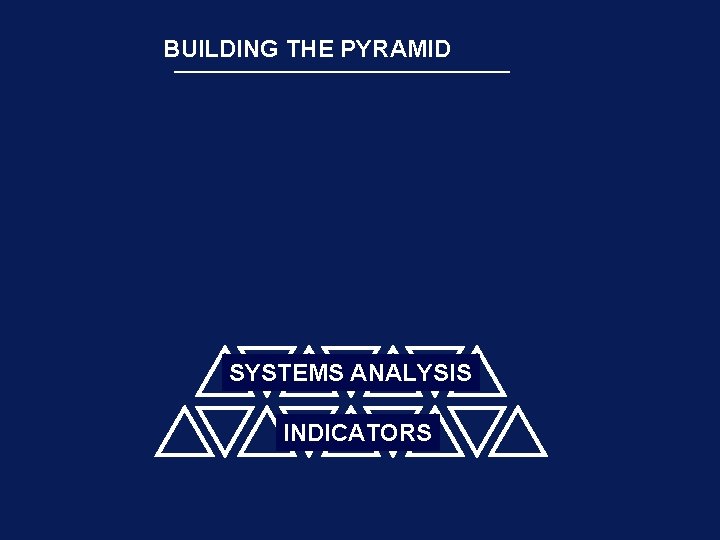
BUILDING THE PYRAMID SYSTEMS ANALYSIS INDICATORS
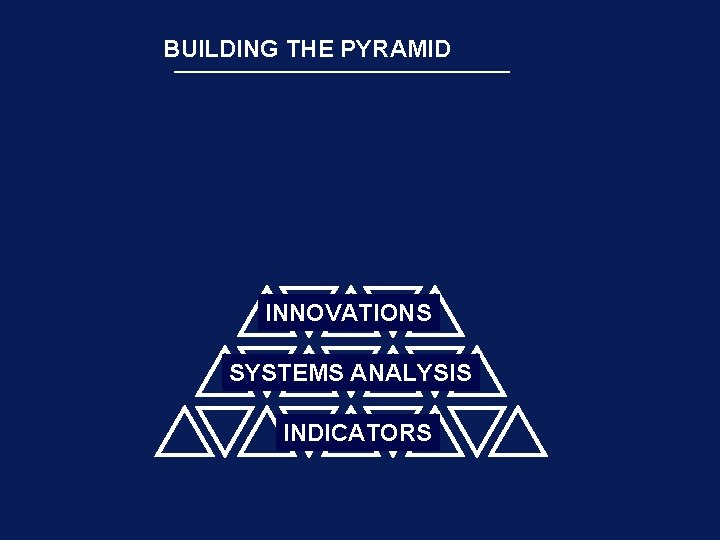
BUILDING THE PYRAMID INNOVATIONS SYSTEMS ANALYSIS INDICATORS
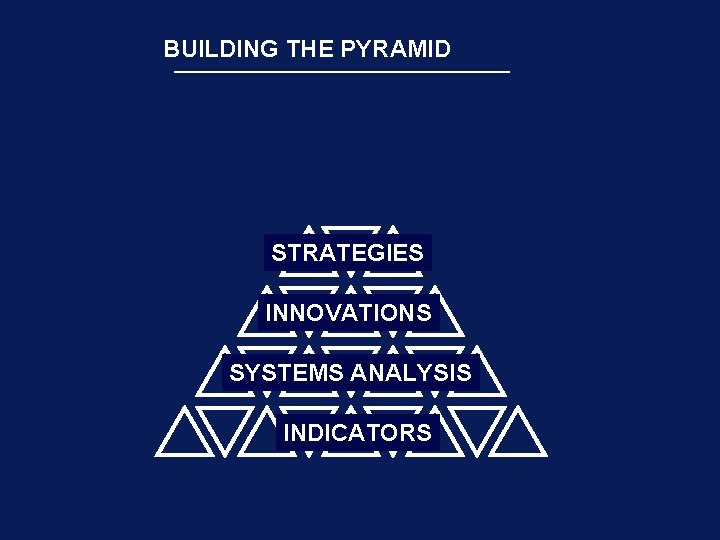
BUILDING THE PYRAMID STRATEGIES INNOVATIONS SYSTEMS ANALYSIS INDICATORS
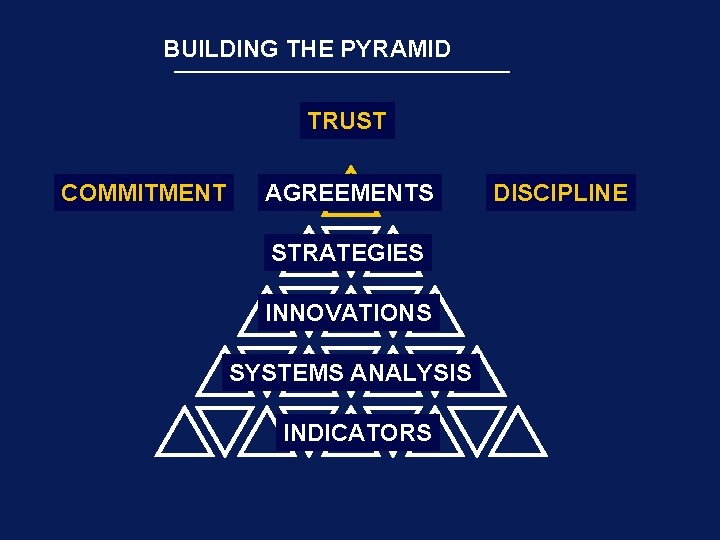
BUILDING THE PYRAMID TRUST COMMITMENT AGREEMENTS STRATEGIES INNOVATIONS SYSTEMS ANALYSIS INDICATORS DISCIPLINE
- Slides: 49