Sustainable Power Development through Green Power Technologies Presented

“Sustainable Power Development through Green Power Technologies” Presented By:

The Major Contradictory Challenges Faced by Developing world n n stinued n Quest for increased Generation capacity - Terawatt Challenge Climate Change - rising GHG level generation

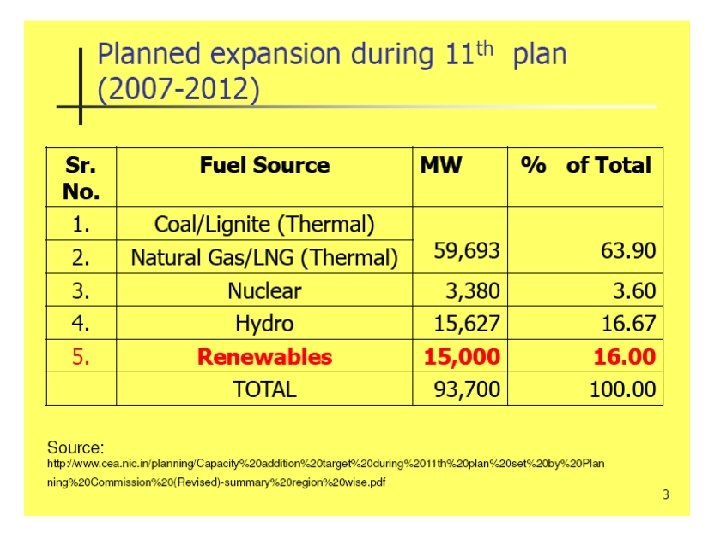
Government of India’s National Missions n n National Solar Mission 2009 National Renewable Energy Mission “A target of 10% of Renewable Energy by 2012” n n National Mission on Combating Climate Change through Green & Clean Power National Bio-diesel Mission National Mission of Hydro Potential Exploitation National Mission on ‘Clean Coal Technologies’ for Mega Power Generation

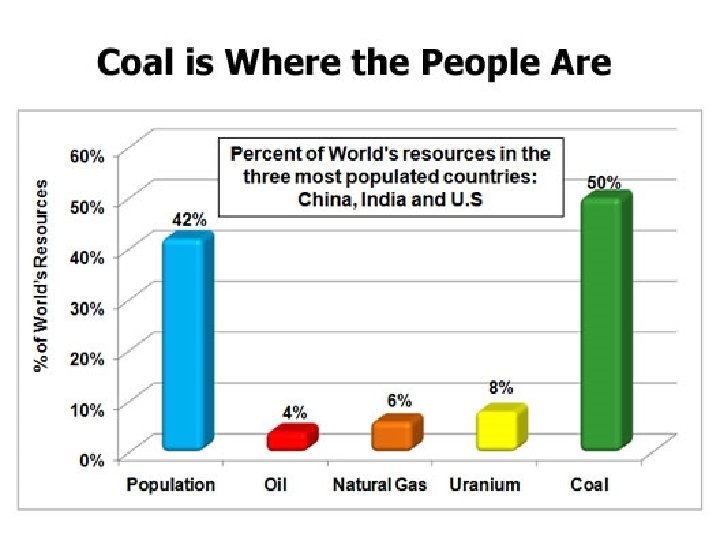
CLIMATE CHANGE CAUSED BY INCREASED GHG EMISSION • • • Green House Gas level rise to a current level of 390 ppm and consequent climate change, floods and draughts has affected 260 million people between 2000 and 2004 through natural calamities, of these, 98% were in developing nations. Developed countries with population of 15% of world population have the share of CO 2 emissions at 50%. CO 2 level has risen to 390 ppm from 1975 level of 330 ppm. There is so much momentum in the system that we will certainly double CO 2 level by end of the century. Global temperature rise by 3 to 4 0 C will cause displacement of over 330 million people in developing world.

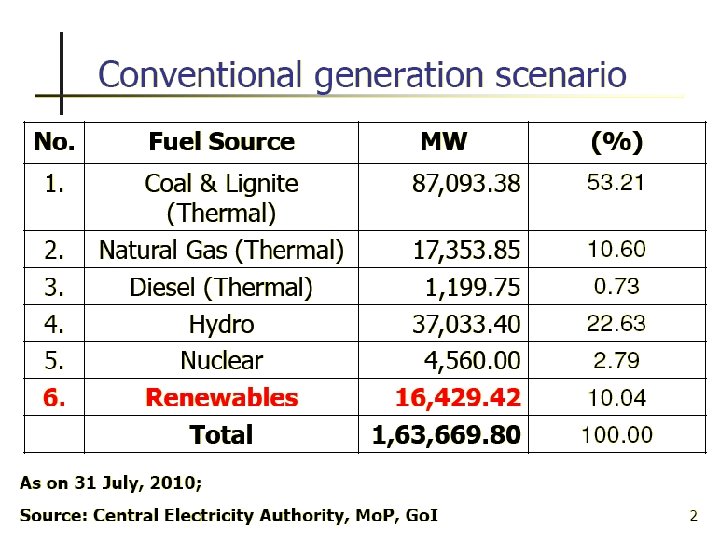
• China and India are projected to account for 30% of the world’s increase in energy consumption between and 2000 -2020 use. • World Green House inventory is over 29, 000 Million tones per annum (MTPA) with US over 20% (India with total emission of about 1400 MTPA is only at 4. 8 %. ) • power generation in at least next Three decades for India (87, 093 MW Coal based generation out of 1, 63, 669 MW total power installed capacity)
 Energy")
Green House inventory for India for Energy Sector (Million Tonnes of CO 2) Energy Sector CO 2 equivalent (CO 2+CH 4+NOX) Total Emission 834 (58% of total) 928 (64% of total) Source: IAE: 1999

Tera-watt Challenge for synergy in Energy & Environment n A terawatt Challenge of 2012 for India To give over one billion people in India the minimum Electrical Energy they need by 2012, we need to generate over 0. 2 terra watt (oil equivalent to over 3 million barrels of oil per day) and 1 TW by 2050, primarily through Advanced fossil fuel technologies like CCTs for limiting GHG emission levels n By 2020 our mix of generation would have the Peak in Thermal, certainly it would be the Green Thermal Power: n n Thermal Renewable & Hydro Nuclear Total 326, 000 MW 104, 000 MW 20, 000 MW 450, 000 MW

Energy for the Earth Planet- Non-CO 2 Options n n n World Generates 15 Terawatt of Energy (the US about 3 TW, India - 0. 16 TW) today to support 10 billion world population. This is Equivalent to 230 million barrels of oil /day. By 2050 it is projected to need about 35 TW. The world would need about 20 TW of non-CO 2 energy to stabilize CO 2 in the atmosphere by mid century. Among the non-CO 2 options , it is possible that solar is the only one that can meet this Terawatt challenge and at the same time contribute to the reduction of climate change, with about 125, 000 TW of global incident sunlight.

The National Solar Mission is a major initiative of the Government of India and State Government to promote ecologically sustainable growth while addressing India’s energy security challenge. It will also constitute a major contribution by India to the Global efforts to meet the challenges of Climate Change

INDIAN POWER SECTOR - TOWARDS SUSTAINABLE POWER DEVELOPMENT n n Total Installed Capacity … 1, 63, 669 MW Thermal Generation … over 64 % Although no GHG reduction targets for India but taken steps through adoption of Renewable Energy Technologies, Combined cycles, Co-generation, Coal beneficiation, Plant Performance optimization Under Kyoto Protocol; Clean Development Mechanism (CDM) conceived to reduce cost of GHG mitigation, while promoting sustainable development as per Framework Convention on Climate change (FCCC)

FRONTALS IN ENERGY & ENVIRONMENT n n GREEN ENERGY TECHNOLOGIES – PRIMARILY THE CLEAN COAL TECHNOLOGIES ZERO EMISSION TECHNOLOGIES FOR TRANSPORT, POWER PLANTS & INDUSTRIAL SECTOR n AFFORDABLE RENEWABLE ENERGY TECHNOLOGIES n ENERGY EFFICIENCY n CDM OPPORTUNITIES IN ENERGY SECTOR

Mission Energy Security and Energy independence n n n n Climate Change – Nature’s Fury Solar for irrigation High Efficiency CNT Based PV Cells Hydrogen as Fuel for future Accelerated Program on Thorium based Nuclear Reactor Clean coal Technologies like SCR, IGCC Bio-fuels for Railways and Mass Transport Energy Security by 2020, Energy Independence by 2030 …. Reference: Address by President of India 14 th Aug 2005
 is the critical enabling technology")
“We conclude that CO 2 capture and sequestration (CCS) is the critical enabling technology that would reduce CO 2 emissions significantly while also allowing coal to meet the world’s pressing energy needs. ” – MIT 2007 “Citizens of poor countries have the right to aspire to better standards of living… clean coal is key. ” – Arun Ghosh, Global Economic Fellow, Oxford University “For decades, the coal industry has supported quality high-paying jobs for American workers, and coal has provided an important domestic source of reliable, affordable energy…. Charting a path toward clean coal is essential to achieving my Administration’s goals of providing clean energy…” – President Barack Obama, 2010

Prime Clean Coal Technology Options for India for 11 th & 12 th Plans n n n Supercritical Power Plants Integrated Gasification Combined Cycle (IGCC) Power Plants Circulating Fluidized Bed Combustion (CFBC) Power Plants

SUPER CRITICAL UNITS n n Standardized Unit Size 660 MW, 246 ata, 537 o C Station Size 2 x 660 MW (Minimum) Common Off site facility FW Temperature 270 o. C – 275 o. C with 6 Heaters. Total Capacity Planned Number of Units 14, 560 MW * 22 Units * Includes 6 x 720 MW and 2 x 500 MW Imported sets.

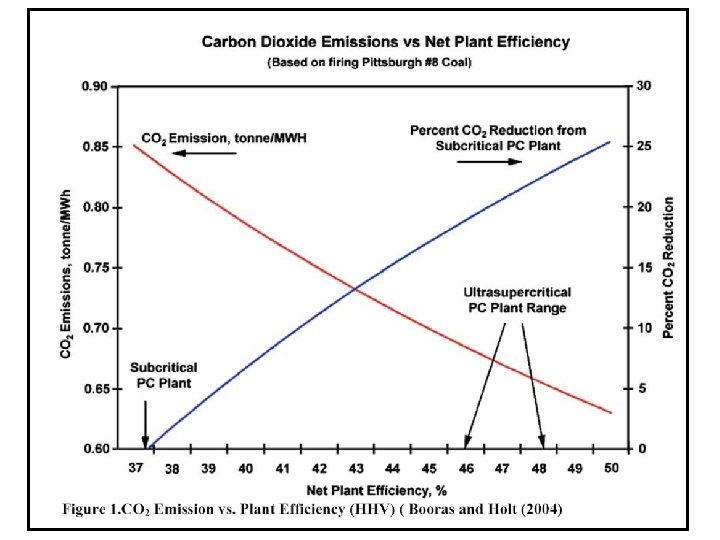
Main advantages of Super-Critical Steam Cycle n Reduced fuel cost due to improved thermal efficiency n Reduction of CO 2 emissions by 15% per unit of Power generated compared to sub-critical n Very good part load efficiencies n Plant costs are comparable with sub-critical units

Current State-of-Art Super-critical Steam Power Generation Plants Pressure 300 bar Temperature 600 o. C Efficiency 45% (LHV Basis) Nickel based alloys allows up 650 o. C By the year 2011 620 o. C By the year 2020 650 -700 o. C Cycle Efficiency 50 -55%

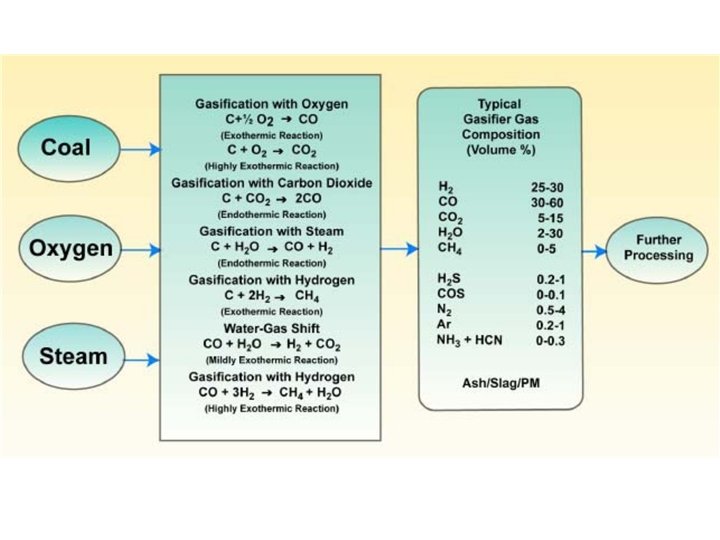
IGCC TECHNOLOGY. . . n n n Gasification of coal is the cleanest way of utilization of coal, while combined cycle power generation gives the highest efficiency. Integration of these two technologies in IGCC power generation offers the benefits of very low emissions and efficiencies of the order of 44 -48%. The comparative indices show that in case of IGCC, emission of particulate, NOx and SOx are: 7. 1%, 20% and 16%, respectively, of the corresponding emissions from PC plant. - Three major areas of technology that will contribute to improvements in IGCC are : · hot gas de-sulfurisation · hot gas particulate removal · advanced turbine systems

IGCC
 technology has selectively been")
Circulating fluidized Bed Combustion n Circulating Fluidized Bed Combustion (CFBC) technology has selectively been applied in India for firing high sulphur refinery residues, lignite, etc. CFBC Technology is superior to PC Power Plant Technology: n Lower NOx formation and the ability to capture SO 2 with limestone injection the furnace.

Circulating Fluidised Boiler Steam to Super Heater Cyclone Coal Feed Hopper Ash Cooler Back-Pass Furnace ESP External Heat-Exchanger HP Air

CFBC Vs Other Clean Coal Technologies ITEM CFBC PF+FGD/SCR IGCC Cycle Efficiency % 34. 8 36. 7 41 -42 Relative Capital Cost/k. W 1. 03 -1. 19 1. 15 -1. 42 Relative O&M Cost/k. W 1. 0 1. 49 0. 8 -0. 98 At present pulverized fuel firing with FGD are less costly than prevailing IGCC technology. However, firing in CFB Boiler is still more economical when using high sulfur lignite and low-grade coals and rejects.

Green Energy solutions Ø Promote CCT in countries like India & China where coal is main stay fuel for Power Generation. Ø Increased use of Advanced Fossil Fuel Technology Ø Energy Farming Ø Energy Efficiency Ø Major shift towards Green Technologies Ø Adoption of Renewable Energy Technologies in Rural Sector
 mitigation options in India Technology")
Table: 05 Cost of various CO 2 (carbon dioxide) mitigation options in India Technology Greenhouse gas emission reduction Investment cost Cost-effectiveness (dollars/tonne CO 2) Green Power generation Cogeneration 1. 50 kg/k. Wh 900 dollars/k. W 10 (most cost effective) Combined cycle 0. 96 kg/k. Wh 818 dollars/k. W 54 (cost effective) Inter-cooled steam-injected gas turbine 0. 76 kg/k. Wh 947 dollars/k. W 77 Pressurized combustion 0. 18 kg/k. Wh 1894 dollars/k. W 503 Integrated gasification combined cycle 0. 23 kg/k. Wh 1578 dollars/k. W 340 (at par) Pulverized coal super-critical boilers 0. 18 kg/k. Wh 1202 dollars/k. W 342 (at par) Coal washing 0. 125 kg/k. Wh 11 dollars/k. W 179 CFBC 0. 20 kg/k. Wh 1000 dollars/k. W 250 small hydro 1. 3 kg/k. Wh 1950 dollars/k. W 88 (cost effective) wind farms 1. 3 kg/k. Wh 1405 dollars/k. W 257 Biomass 1. 6 kg/k. Wh 710 dollars/k. W 102 (cost effective) Solar thermal 1. 3 kg/k. Wh 3730 dollars/k. W 592 Solar PV (photovoltaic) 1. 6 kg/k. Wh 5952 dollars/k. W 541 fluidized bed Renewable energy for power

Impact Green Projects at RGTU n n n CO 2 Capture, Sequestration and Production of Multi-purpose fuels – Hydrogen, Methane and Biodiesel through Algae route Production of CNG from Coal–gasification route Solar, Wind & Biomass Hybrid System 60 k. W Solar-Wind Hybrid system at Hill top of RGTU High yield Jatropha plantation and Bio-diesel production using indigenously designed Bio-diesel reactors

CO 2 Capture & Sequestration Project An Impact Project of DST at RGPV Bhopal MODELING & SIMULATION OF CARBON RECYCLING TECHNOLOGY THROUGH CONVERSION OF CO 2 INTO USEFUL MULTIPURPOSE FUEL

Broad area of Research: CO 2 SEQUESTRATION (Under the National Program on Carbon Sequestration – NPCS of DST) Sub Area – Project Title: Modeling & Simulation of Carbon Recycling Technology Through Conversion of CO 2 Into Multipurpose Fuels. Objectives of the Proposal:

The following incorporated: four systems have been 1. CO 2 Capture & sequestration system – Indigenous Development 2. Catalytic Flash Reduction of CO 2 using charcoal from gasifier /lignite. Production of Hydrogen from CO 3. Production of Methane using Catalytic Conversion process 4. Production of Algae from CO 2 Sequestration with Solar flux.

CO 2 Sequestration Pilot Plant installed under the DST Project

Methodology Description of the Pilot Plant: Rated Capacity of the Capture of CO 2 : 500 kg/ day Source of CO 2: Boiler of capacity 100 kg/hr. steam & Biomass Gasifier of 10 k. We Solvent used for capture of CO 2 : Mono Ethanol Amine (MEA) SOx & NOx Removal: Na H CO 3, Na. OH & Lime. Catalytic Converters / Reduction Unit - For Methane. . Input CO and H 2, Catalyst “R - 01 * - For Hydrogen. . Input CO and Steam, Catalyst “R - 02 * - For CO. . . Input CO 2 and Lignite /charcoals

Scheme Diagram of CO 2 Capture Pilot Plant

Innovations: • Capture of CO 2 from Biomass and a Boiler on Pilot Scale and achieving capture efficiency of the order of 78% • Production of CO in stable form and Water Gas shift reaction to produce fuel molecules like H 2 • Catalyst development to produce Methane from the captured CO 2 • Enhancing productivity of selected Micro-Algae for production of Bio- diesel • Plant Cost optimization through in-house designing and erection work

THE ROAD MAP n n n Government of India has declared its policy on CO 2 abatement by the announcement and adoption of the ‘National Action Plan on Climate Change’. It has also made voluntary commitment at the Copenhagen Summit that the Country shall decrease its Carbon Intensity by 20% by 2020 and 50% by 2050. The bulk of CO 2 is emitted by the Thermal Plants in the Power Sector. For EPA regulations to be implemented there have to be a road map as to how this can be done without major impact on the cost or efficiency of the Thermal Plants

Solution lies in… n n The thermal plants in India have a thermal efficiency of 35% and an emission ratio of 0. 90 Kg/k. Wh of CO 2 emissions as published by CEA. The reduction of 20% intensity would translate to a decrease of 0. 20 Kg/k. Wh of CO 2 emissions i. e. below 0. 70 Kg/k. Wh CO 2 emissions by 2020. This decrease is possible by a combination of abatement and recycling measures. The CO 2 reduction by an Amine system of 30% CO 2 capture would mean a decrease of Thermal Efficiency by 2%

Recycling of CO 2 n n n The CO 2 so captured needs to be either compressed to be used in Enhanced Oil Recovery or recycled. The better option would be that the same be recycled. The system additions to the existing thermal plants would be a two stage gasifier to use up this CO 2. This would help recycle the Carbon of the CO 2 and the treated/ converted CO would be refed into the Boiler by means of a Gas Burner. This two stage gasifier would be made of a Gasifier Chamber where the Coal is gasified by an Oxy Fuel Process and this heated Gas fed into the second Reactor where treated Carbon is fed to react with the CO 2 being fed from the Amine stripper. The CO 2 so fed would be converted into CO having a LHV of 2414 kcal/Kg or 64. 37% coal equivalent in terms of the Indian Coal having an average heat value of 3750 kcal/Kg

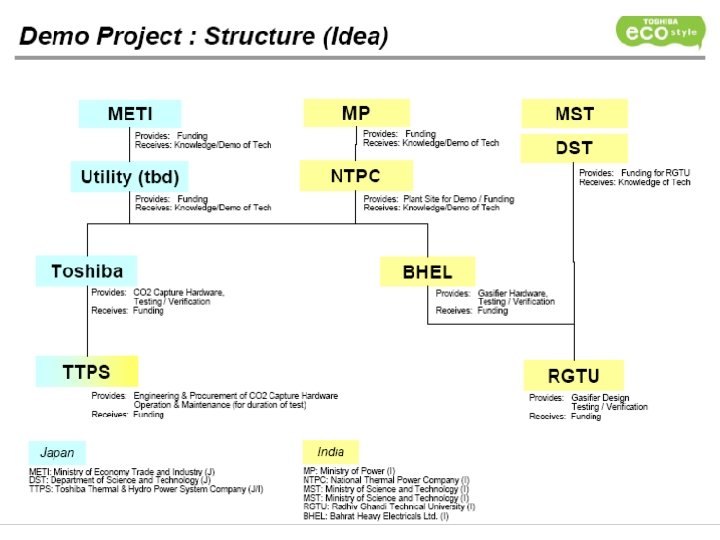
Application Potential: Long Term • Deployment of the Technology to Actual Power Plants of NTPC through BHEL / TOSHIBA or any other major player Immediate • Green Energy Technology Centre (GETC) being set-up for Teaching & Research (M. Tech & Ph. D) Future action plan: Efforts are underway to extend the scope of the process by incorporation a Coal gasifier and recycling of carbon through collaborative research and Distributive Research Initiatives (DRI) with Research Organizations and Power Industries.

Carbon Capture & Sequestration • • India’s position with regard to Carbon Capture & Storage (CCS) is very clear. We don’t make any commitment at this stage regarding deployment of CCS technologies. India advocates very strongly the Carbon Capture & Sequestration. Some of the demo pilot projects include. -Pilot project on Geological CO 2 sequestration in basalt rock formation. The question of adoption of CCS will depend on this technology being cost effective. -Projects under DST sponsored National Program on Carbon Sequestration (NPCS)

CO 2 mitigation Options: Case of Electricity Sector n n n Coal: Dominates the electricity sector today Fuel switching (Coal NG) Conventional Plants + Carbon Capture & Sequestration (CCS) (Post –Combustion CO 2 Capture) Gasification/ Reforming + CCS (Pre-Combustion CO 2 Capture) Oxyfuel Combustion + CCS
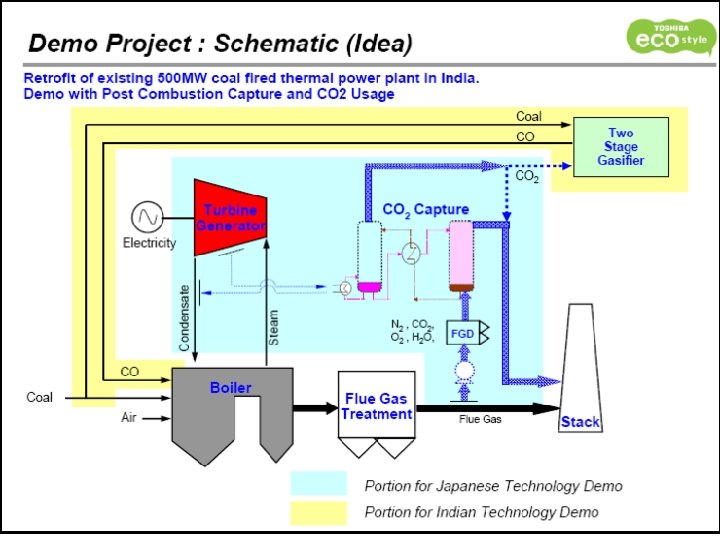

Demo Project –Strategy Plan n n Retrofit of existing 500 MW coal fired thermal power plant in India. Demo with Post Combustion Capture and CO 2 Usage Coal First full by-pass CO 2, then to recycling Scale of carbon capture 30% CO 2 CO Converter CO H 2 Converter H 2 CO 2 Capture Turbine Generator Algae Plant Electricity Bio-Fuel Storage/EOR Coal Air Recycled Fuel Steam Modification to turbine cycle Condensate Catalyst Dev. Boiler N 2 , CO 2, O 2 , H 2 O, Flue Gas Treatment FGD Storage or EOR N 2 , O 2 , H 2 O Implementation strategy: Algae plant from beginning Flue Gas Stack Addition of gas treatment facility required, depending on present application Work on burner By OEM Plant engineers construction or modification RGTU specifies requirements – Industry partner Engineers’ construction or modification

$ per tonne CO 2 avoided 200 150 CO 2 Capture/Sequestration 100 500 1000 1500 2000 $ per tonne CO 2 avoided 200 150 Nuclear 100 50 $ per tonne CO 2 avoided 00 500 1000 200 Renewable 150 100 500 1000 1500 Million tones CO 2 2000 Figure: Comparison of CO 2 capture & Sequestration Technologies with other leading mid-to long-term option

Issues before the house n n n Promotion of Clean Coal Technologies Technology break thoughts in the areas like CO 2 capture and Clean Coal Technologies Development of low cost solar photo voltaic cells Bringing Energy Efficiency & Energy Conservation on the top of the National Agenda Promotion of Carbon Trading on the strength of Energy Efficiency and Green Environment initiatives. Base line methodologies for variety of Clean and Green Technologies need to be redefined.

- Slides: 50