Sustainable Development Practice in China Energy and Industry

Sustainable Development Practice in China Energy and Industry - 2

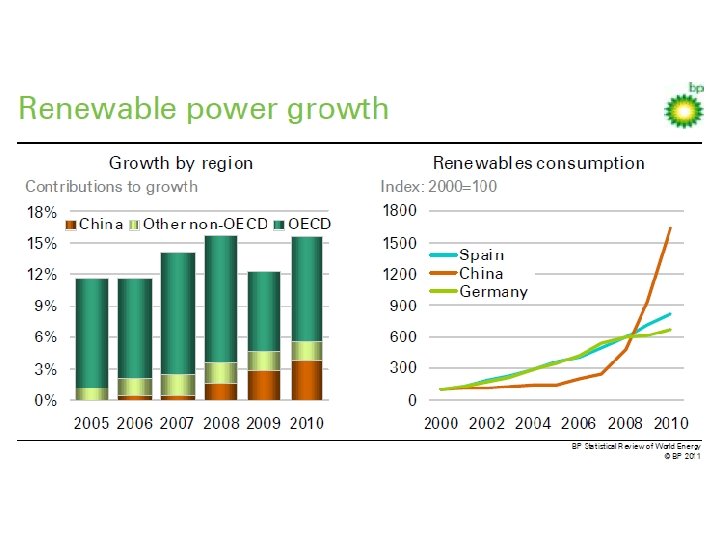
Energy and Industry • Energy principles: “Useful” energy, thermal dynamic laws; “Entropy” and 2 nd law of thermal dynamics • Energy challenges: climate change, energy crisis, energy security • Renewable energy: wind, water, solar …

General situation • • The energy flow chart; Energy crisis Energy security Energy consumption reduction for climate change mitigation

Energy in the world • BP statistical review 2012 • IPCC report volume III

Energy Issues in China

World primary energy consumption by fuel in 2005~2010, in million toe

World primary energy consumption since 1965, according to BP-2011

World coal consumption since 1965, according to BP-2011

World oil consumption since 1965, according to BP-2011

World gas consumption since 1965, according to BP-2011

World hydro-power supply since 1999, according to BP-2011

World nuclear power consumption since 1965, according to BP 2011

World solar energy consumption since 1996, according to BP-2011

World wind power consumption since 2003, according to BP 2011

Energy consumption structure in 2010 nes oil Million ton equivalent --- Based on BP world energy statistics 2011 China burns coal more than 3 times than that by US and more than 6 times than that by India.

Current energy situation of China Proved reserves: • Fossil fuel – Coal in 2006, proved reserve 1034. 5 billion tonnes, 13% of the world, 3 rd place. – Proved reserves of oil and gas are relatively limited. – Some unconventional fossil energies including oil shale and coal seam gases • Renewable energy resources – Hydro power: theoretical reserves were equal to 6, 190 billion kwh, economically exploitable annual power output was 1, 760 billion kwh, equivalent to 12% of the global, 1 st place

Low per-capita average of energy resources • The per-capita averages of both coal and hydropower resources are 1/2 of the global average; • The per-capita average of both oil and natural gas resources is only about 1/15 of the global average; • The per-capita average of arable land is less than 30% of the global average, which has hindered the development of biomass energy.

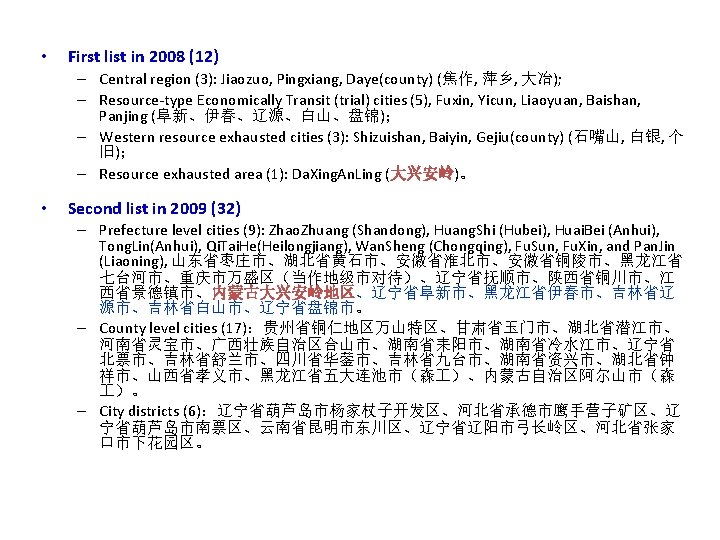
A number of “Resource Exhausted” cities • Criterion: – Accumulated production has reached 70% or more of the proved reserve originally found, or – to last 5 years or less with the current technologies; • Two lists were announced in 2008 and 2009, including coal mines, oil fields, non-ferrous mines, and wood-industry regions; • 44 out of 114 “Resource Cities” are now on the “exhausted” list.

Sectoral energy consumption of China

China energy consumption structure change: Oil consumption is increasing quickly, however, coal consumption increases no less …

Changes in sectoral energy consumption of China
 104 tonnes coal equivalent Non-metal")
Energy consumption in industrial sectors, excluding electricity production (2008) 104 tonnes coal equivalent Non-metal Prod. Ferrous metal manufacturing Chem. Eng. Oil refinery Textile Non-ferrous metal manufacturing
 108 k. Wh Non-metal Prod. Ferrous metal manufacturing")
Electricity consumption in industrial sectors (2008) 108 k. Wh Non-metal Prod. Ferrous metal manufacturing Chem. Eng. Non-ferrous metal manufacturing Textile

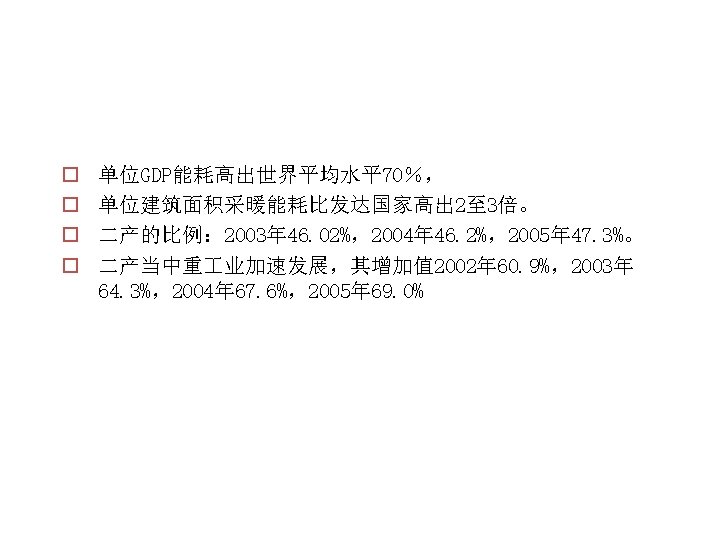
White Paper: “Situation and Policy of China’s Energy”, Dec 2007 • Current situation – Energy production and consumption • Energy structure • Energy consumption per unit GDP • Energy consumption per capita – Comparison with other countries • Energy production and consumption, and economic development • Efforts of energy saving

• Energy supply capability has been remarkably enhanced. • In 2006, the output of primary energy equaled 2. 21 billion tons of standard coal, ranking second in the world. – Raw coal accounted for 2. 37 billion tons, ranking the first place in the world. Built a number of extra-large coalmines. – Daqing, Shengli, Liaohe, Tarim and the large oilfields have been successively built, and the output of crude oil has increased steadily, ranking China the world's fifth-largest (? ) oil producer in 2006, with 185 million tons in that year. – The output of natural gas ballooned from 14. 3 billion cu m in 1980 to 58. 6 billion cu m in 2006. – The proportion of commercial renewable energy in the structure of primary energy keeps rising. – The electricity sector also reported speedy growth in 2006. The installed capacity reached 622 million kw, and the amount of power generated was 2, 870 billion kwh, both ranking second in the world. • A comprehensive energy transportation system has been developed quickly, with the transport capacity notably improved. – Special railways transporting coal from the west to the east and relevant coal ports, and – pipelines transporting oil from the north to the south and conveying natural gas from the west to the east have all been built. – Now, the power generated in the west can be carried to the east, and the regional power grids have all been connected up.

Uneven distribution of energy – China's energy resources are scattered widely across the country, but the distribution is uneven: • Coal is found mainly in the north and the northwest, • hydropower in the southwest, and • oil and natural gas in the eastern, central and western regions and along the coast. – But, the consumers of energy resources are mainly in the southeast coastal areas, where the economy is the most developed, such that fundamentally, China's energy flow: • large-scale transportation over long distances of coal and oil from the north to the south, • and transmission of natural gas and electricity from the west to the east. • (Southern water to north), northen coal/oil to south, western gas/electricity to east…

Exploitation difficulties: • Coal, poor mining conditions, minor portion can apply opencast working • Oil and gas fields with complicated geological conditions, requiring advanced exploitation techniques • Hydro resources are located southwest mountainous areas, far from economic centers. • Low economy of non-conventional energy resources

“Resource Exhausted” cities • Criterion: – Accumulated production has reached 70% or more of the proved reserve originally found, or – to last 5 years or less with the current technologies • Two lists were announced in 2008 and 2009, including coal mines, oil fields, non-ferrous mines, and woodindustry regions • 44 out of 114 “Resource Cities” are now on the “exhausted” list

Coal mines

Yu Men Oil and gas fields

Challenges for a stable, economic, clean and safe energy supply system • Resource limitation, low energy efficiency – Lack of major high quality energy resources, supply limitation, uneven distribution; – Development mode, improper energy structure, backward equipment and management, so as high energy consumption and consumption strength • Coal as the main energy, environmental pressure – Coal as the main fuel will last for a long period. – Backward coal production and consumption, with environmental pressures: main source of air pollution and GHGs – With the rapid increment of vehicle numbers, car emission induced air pollution will become severe. • Imperfect market system, emergency management capacity – Energy marketing system, pricing mechanism, should be consistent with resource limitation, supply shortage, and environmental cost. – Energy exploitation, supervision system – Safety in mining, especially coal mining. Electric grid not reasonable, oil storage, and emergency response system

Achievements in energy saving • Achievements – 1980-2005, energy consumption increased by 5. 4% annual average, GDP increased 9. 8% per year, so as the elasticity coefficient 0. 55; – Energy consumption strength decreased from 3. 98 ton (coal) per 104 RMB in 1980 to 1. 42 ton (coal) per 104 RMB in 2005, 64. 3% less; – Annual energy saving rate over 4%; – Combined efficiency of energy processing, conversion, storage, and end-use raised from 25% in 1980 o 33% of 2006; – The gap comparing with advanced countries is getting smaller of energy strength in energy-consuming products;

Energy strength per unit GDP has been reduced by 60% in the last 20 years, but still 3. 1 times as the world average, 9 times as that of Japan and 4. 3 times of OESD
 Oct 2007 Development")
Mid and Long Term Plan of Nuclear Electricity of China (2005~2020) Oct 2007 Development and Reform Commission of China

Energy issues: • • • Limited energy resource, especially in per capita; Fossil energy reservation; Rapid increase in energy consumption Daily life energy consumption increases Low energy use efficiency Alternative / renewable energy Nuclear power development in China?

Development of nuclear power system

Current situation • Nuclear power in world’s electricity – 1 st commercial nuclear power station in 1950 s; – According to IAEA, in Oct 2005, there were 442 in operation, pressured water 60%, boiled water 21%, CANDU 9%, others (graphite reactor etc) 10%; – Total capacity 369 million k. Wa, in 31 countries/regions; – Nuclear electricity takes 17% of world total electricity; – There are 16 countries/regions with over 20% nuclear power generation, including US, France, Germany, and Japan etc.

• Nuclear power development in China – In 1983, PWR was taken as the main type. Capacity has been built up on the related technology: design, manufacturing, construction and operation management; – The 1 st station was put in use in 1991 (Qin. Shan). Since then there are 6 stations with 11 sets of reactors and 9. 068 million k. Wa put in commercial operation, and 8 reactors with 7. 90 million k. Wa are under construction (Ling. Ao-2, Qin. Shan-2, and Hong. Yan. He-1)
 No Reactor Capacity Operation")
2007 situation of nuclear stations of China (104 k. Wa) No Reactor Capacity Operation 1 Qin. Shan-I-#1 30 1991. 4 2 Qin. Shan-II-#1 65 2002. 4 3 Qin. Shan-II-#2 65 2004. 3 4 Qin. Shan-III-#1 70 2002. 12 5 Qin. Shan-III-#2 70 2003. 11 6 Da. Ya. Wan-#1 98. 4 1994. 2 7 Da. Ya. Wan-#2 98. 4 1994. 5 8 Ling. Ao-#1 99 2002. 5 9 Ling. Ao-#2 99 2003. 1 10 Tian. Wan#1 106 2007. 5 11 Tian. Wan#2 106 2007. 8 12 Ling. Ao-II-#1 108 Cons Dec 2005 ~ 2010 to complete 13 Ling. Ao-II-#2 108 Cons Dec 2005 ~ 2010 to complete 14 Qin. Shan-II-E-#1 65 Cons Apr 2006 ~ 2011 to complete 15 Qin. Shan-II-E-#2 65 Cons Apr 2006 ~ 2011 to complete 16 Hong. Yan. He-1 4× 111 Cons Total 1696.8 Remark

• Capability – Design: 30 and 60 104 k. Wa stations, and some of 100 104 k. Wa station; – Equipment manufacturing: able to produce 30 104 k. Wa PWR station, over 80% made in China. For 30 104 k. Wa PWR station, 70% China made. Aiming to main parts of 100 30 104 k. Wa PWR station made in China; – For nuclear fuel, current supply can be satisfied; – For nuclear technology, developments in technologies of FFTF(Fast Flux Test Facility) and high temperature gas cooled reactor – Nuclear safety: regulations on security management, and emergency systems.

Strategy and targets • Strategy – Security priority – 100 104 k. Wa PWR strategy, development along hot-photon ~ fast photo ~ controllable fusion – Learn from international experience and technology • Targets – To 2020, nuclear power capacity to 4000 104 k. Wa, annual nuclear electricity production 260 -280 billion k. Wah – Based on current capacity 1696. 8 104 k. Wa, to increase new capacity 2300 104 k. Wa – Considering further development, around the end of 2020, the capacity under construction should keep 1800 104 k. Wa
 New projects New operation Before 2000 Extend")
Nuclear power development plan (104 k. Wa) New projects New operation Before 2000 Extend to the next 5 -year End of the 5 -year 226. 8 2001~2005 346 468 558 694. 8 2006~2010 1244 558 1244 1252. 8 2011~2015 2000 1244 2000 2496. 8 2016~2020 1800 2000 1800 4496. 8
 Province Station Scale Remarks Zhejiang Qin. Shan-II-E 2×")
Coastline nuclear stations (104 k. Wa) Province Station Scale Remarks Zhejiang Qin. Shan-II-E 2× 65 Approved San. Men(Jian. Tiao) 6× 100 1 st phase approved Fang. Jia. Shan 2× 100 Reviewed San. Men(Kuo. Tang. Shan) 4× 100 Reviewed Jiangsu Tian. Wan-E 4× 100 Reviewed Guangdong Lin. Ao-II 2× 10 Approved Yang. Jiang 6× 100 1 st phase approved Yao. Gu 6× 10 Approved Hai. Yang 6× 100 Approved Shandong Ru. Shan. Hong. Shi. Ding 6× 100 Site needs be changed Liaoning Hong. Yan. He 6× 100 1 st phase approved Fujian Ning. De 6× 10 Approved Guangxi Fang. Cheng. Gang/Qin. Zhou 4× 100 First review completed Total 13 sites 5946

• New actions – After 2004, new sites were considered in Guangdong, Zhejiang, Fujian etc. – From the present to 2020, new stations will mainly considered in above coastal provinces. – Other than coastal, new sites have also searched in Hubei, Jiangxi, Hunan, Jilin, Anhui, Henan, Chongqing, Sicuan, and Gansu etc. • Challenges – – Nuclear fuel supply Radiactive waste disposal Cost Decommission

China nuclear station development

In France, there are 59 nuclear power stations, with capacity 63 GWe, providing over 430 billion k. Wh per year. Electricity, nuclear fuel and service are important exporting goods, the 1 st in exporting electricity in the world.

Nuclear stations in the world

Nuclear power stations and the locations with 10% earthquake possibility in 50 years Japan Taiwan Pakistan Iran 2 in US
- Slides: 53