Sustainable Development Goal 9 Jerry Courvisanos Associate Professor

Sustainable Development Goal 9 Jerry Courvisanos Associate Professor of Innovation and Entrepreneurship Federation University Australia Tuesday 29 October 2019 RMIT Council Chamber Provider 00103 D CRICOS Provider No. 00103 D

Key aspects of literature review
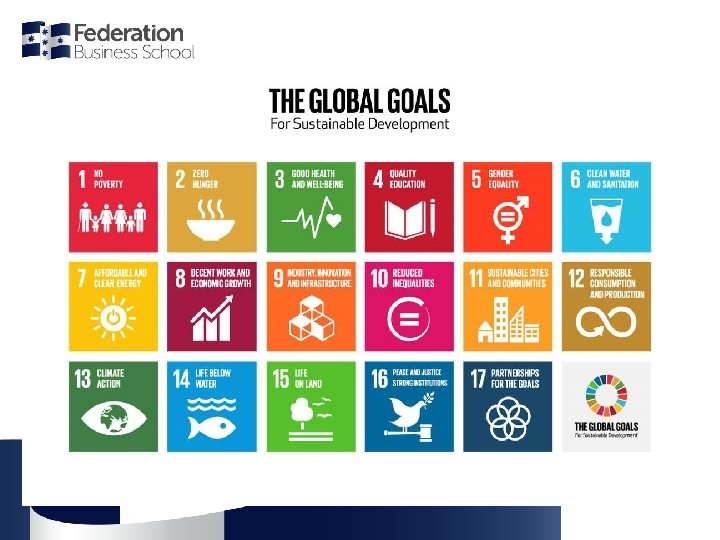

Goal 9: Industry, Innovation and Infrastructure Build resilient infrastructure, promote inclusive and sustainable industrialisation and foster innovation Provider 00103 D CRICOS Provider No. 00103 D

Focus on SDG 9 Economy that is… • Resilient: infrastructure, regions, industry sectors • Inclusive: decent jobs for all, stakeholder commitment • Sustainable: three Ps (profit, people, planet) • Innovative: competitive, collaborative, transformative
 “The essence of sustainable development is to provide for the fundamental")
Sustainable Development (SD) “The essence of sustainable development is to provide for the fundamental needs of humankind in an equitable way without doing violence to the natural systems of life on earth. ” (Kemp and Martens, 2007, p. 5) SDGs: Path to SD is non-optimal and dynamic, with business ventures (& new programs) that embrace: • productive union of mind and nature • linking economic (profit), social (people) and ecological (planet) in business practice • support with local/regional/national community Requires eco-innovation to SD path

Fundamental Flaw or Oxymoron • Policy Brief SDG 3 Debbi Long: “fundamental flaw” of the SDGs between promotion of both economic growth and sustainability, esp. in SDGs 8 and 9 • Self-contradiction to reveal a paradox of…. • Advocating economic growth [EG] underpinned by an economic model that assumes optimal balance with infinite resources (neoclassical), and • Advocating SD underpinned by an economic model that assumes non-optimal and dynamic adaptation of development to address finite resources (circular) Economic Model: EM-EG or EM-SD?

Target 9. 1 Develop quality, reliable, sustainable and resilient infrastructure, including regional and transborder infrastructure, to support economic development and human well-being, with a focus on affordable and equitable access for all [EM: growth with social equity] Indicator 9. 1. 1 Proportion of the rural population who live within 2 km of an all-season road [EM-EG] Indicator 9. 1. 2 Passenger and freight volumes, by mode of transport [EM-EG]

Target 9. 2 Promote inclusive and sustainable industrialization and, by 2030, significantly raise industry’s share of employment and gross domestic product, in line with national circumstances, and double its share in least developed countries Indicator 9. 2. 1 Manufacturing value added as a proportion of GDP and per capita [EM-EG] Indicator 9. 2. 2 Manufacturing value added as a proportion of GDP and per capita [EM-EG]

Target 9. 3 Increase the access of small-scale industrial and other enterprises, in particular in developing countries, to financial services, including affordable credit, and their integration into value chains and markets Indicator 9. 3. 1 Proportion of small-scale industries in total industry value added [EM-EG] Indicator 9. 3. 2 Proportion of small-scale industries with a loan or line of credit [EM-EG]

Target 9. 4 By 2030, upgrade infrastructure and retrofit industries to make them sustainable, with increased resource-use efficiency and greater adoption of clean and environmentally sound technologies and industrial processes, with all countries taking action in accordance with their respective capabilities Indicator 9. 4. 1 CO 2 emission per unit of value added [EM-SD]

Target 9. 5 Enhance scientific research, upgrade the technological capabilities of industrial sectors in all countries, in particular developing countries, including, by 2030, encouraging innovation and substantially increasing the number of research and development workers per 1 million people and public and private research and development spending Indicator 9. 5. 1 Research and development expenditure as a proportion of GDP [EM-EG] Indicator 9. 5. 2 Researchers (in full-time equivalent) per million inhabitants [EM-EG]

Target 9. A Facilitate sustainable and resilient infrastructure development in developing countries through enhanced financial, technological and technical support to African countries, least developed countries, landlocked developing countries and small island developing States Indicator 9. A. 1 Total official international support (official development assistance plus other official flows) to infrastructure [EM-EG]

Target 9. B Support domestic technology development, research and innovation in developing countries, including by ensuring a conducive policy environment for, inter alia, industrial diversification and value addition to commodities Indicator 9. B. 1 Proportion of medium and high-tech industry value added in total value added [EM-EG]

Target 9. C Significantly increase access to information and communications technology and strive to provide universal and affordable access to the Internet in least developed countries by 2020 Indicator 9. C. 1 Proportion of population covered by a mobile network, by technology [EM-EG]

Clash of Frameworks • EM-EG framework: Priority to economic growth measured by GDP and ancillary indicators as set out in 7 out of 8 targets, with “weak sustainability” where technological innovation and scarce resource pricing resolves dilemma • EM-SD framework: Priority to “development” of economy (regional and national) as identified by ecological and social indicators – CO 2 emissions, pollution rates, social access – where ecosystem biodiversity and social wellbeing underpin progress (only one SDG 9 target)
 and Index of Sustainable Economic Welfare (ISEW)")
EM-SD Frameworks • Genuine progress indicator (GPI) and Index of Sustainable Economic Welfare (ISEW) are metrics of this framework; not mentioned in the SDGs • GPI has a more social well-being orientation than ISEW • Both aim to calculate the ecological and social costs (or negatives) of economic activity, along with the standard economic positives. • Modelling the economy is divided in two approaches: Degrowth (Steady-State) – see Victor (2008) Green growth (Green New Deal) – see Pollin (2015)

The Economic System and the Ecosystem The economic system viewed as a closed circular subsystem of the global environment, with only energy entering and exiting from world’s ecology

EM-SD Frameworks: Where? • Despite academic research work from as early as the 1970 s: Meadows et al. (1972), Schumacher (1973) and Daly (1977), and more recent… • Policy and political interventions post-GFC: A Green New Deal (UK 2008), Pact for a Green New Deal (New Deal vert au Canada 2019), US Congress resolutions led by Rep. Alexandria Ocasio-Cortez (2019), Statistics Finland data on GPI 1945 -2011 • Still not mainstream enough to be in the UN-SDGs • Why not mainstream?

EM-SD Frameworks: Why not? External issues: • Structural change hits the weaker “rust/mining belts” and their workers have limited mobility and reskilling abilities • Works against middle-class aspirations Internal issues: • Debates on alternative development indexes and alternative models • Quantity versus quality (what is incommensurable? ) • Capitalism versus anti-capitalism approaches to green

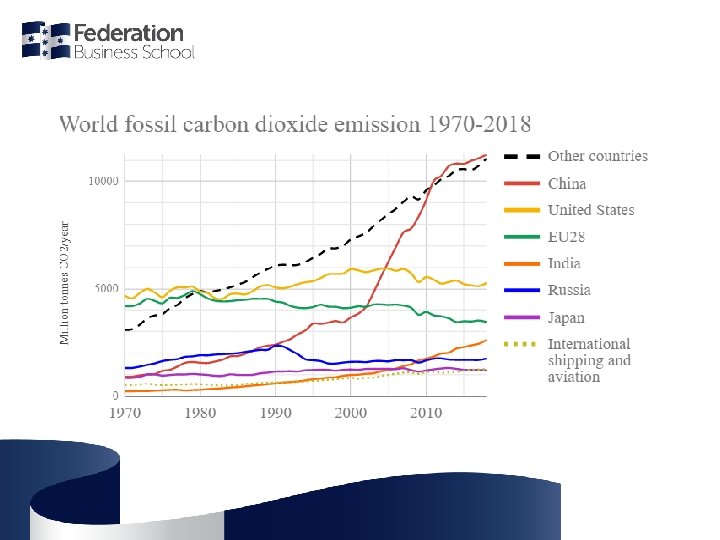
Global Progress of SDG 9 in 2019 • International maritime freight 3. 7% in 2017, but projected growth will test capacity of infrastructure [Is such freight growth sustainable? ] • Manufacturing slowed in both developing & developed regions, difficult to achieve target of doubling manuf. share of GDP by 2030 [Huge increase sustainable? ] • Manuf employment : 15. 3% (2000) to 14. 2% (2018) • Manuf by >20%, 2000 -16; to 0. 30 kg CO 2 per US$ [Decoupling CO 2 emissions and GDP growth] • R&D of GDP from 1. 52% to 1. 68% 2000 -16 [EU and US 2. 21%, developing countries well short of average]

Global Progress of SDG 9 in 2019 • R&D researchers per million inhabitants from 804 in 2000 to 1, 163 in 2016, only 91 in sub-Saharan Africa • Economic infrastructure in developing countries 32. 5% in real terms since 2010; main sectors assisted bank & finance ($13. 4 b. ) and transport ($21. 6 b. ) [59 b. total] • Medium-high and high-tech sectors - 44. 7% of global manufacturing value added (mostly in EU & US); 14. 4% in least developed countries • 90% of all people live within range of a 3 G-quality or higher network [Network more rapidly than % of population using the Internet] Source: United Nations (2019)

Australia and SDG 9 in 2019 Resilient (ability of region to adapt to and shocks): Ø Limited by lack of diversity in industrial structure, depend on industries with low value commodity exports and limited indigenous innovation Ø Core metro with diverse activities demonstrating most resilience, yet no region with strong resilience throughout study period 1986 -2011, and narrowing of industry base…lack infrastructure (now play ‘catch-up’) Ø Manufacturing declining, wages growth very low (2. 3%) Ø Mining & education commodity low-value added exports Ø Financial services (regional centres), tourism (rural) need strategic policy focus Source: Cutler (2008), Courvisanos et al. (2016), Mardaneh et al. (2019)

Sectoral Composition of Australia’s Output 1975 to 2007
")
Source: Global Innovation Index (2014)
: Large differences")
Australia and SDG 9 in 2019 Inclusive (access decent life to all): Large differences socio-economic well-being across divides – limits stakeholder commitment: Ø Rural/regional/periphery/metro (Resilience studies) e. g. federal election 2019 Ø Income/gender/age – aspirational failings Ø Race/ethnic inequity – “[Not]Closing the Gap”/refugees Ø Social inequality: 5. 66 between rich & poor Ø Rank: 21/39 OECD country “Better Life Index”, yet Melbourne 2 nd and Sydney 3 rd in “Liveability” Index” of all major cities in the world Sources: OECD (2018), The Economist Intelligence Unit (2019)
: Ø Limited")
Australia and SDG 9 in 2019 Sustainable (no violence to natural systems): Ø Limited investment and infrastructure in renewable energy in both stationary and transport sectors Ø One of the worst countries for climate pollution person and no national climate policy + recycling crisis, despite ‘meeting’ Paris CO 2 target Ø No long-term CO 2 target or strategic plan Ø Australia has been ranked 55 th – ahead of only Chinese Taipei, South Korea, Iran, the USA and Saudi Arabia – in the latest Climate Change Performance Index Source: Burck et al. (2018)

CO 2 Emissions Per Capita

2016 total carbon dioxide 2016 per capita carbon 2017 per capita carbon emissions from fuel dioxide emissions from fuel combustion (million metric combustion (metric tons) Office of the European Union, 2017 & 2018 2016 ranking by per capita emissions Country 1 Saudi Arabia 527. 2 16. 3 19. 4 2 Australia 392. 4 16. 2 16. 5 3 United States 4833. 1 15. 0 15. 7 4 Canada 540. 8 14. 9 16. 9 5 South Korea 589. 2 11. 6 13. 2 6 Russian Federation 1438. 6 9. 9 12. 3 7 Japan 1147. 1 9. 0 10. 4 8 Germany 731. 6 8. 9 9. 7 9 Poland 293. 1 7. 7 8. 4 10 South Africa 414. 4 7. 4 8. 2 11 Iran 563. 4 7. 1 8. 3 12 China 9056. 8 6. 4 7. 7 CO 2 Emissions Per Capita

Australian energy consumption, by sector Source: Department of the Environment and Energy (2018, p. 11)
: Ø “What is going to")
Australia and SDG 9 in 2019 Innovative (transformative eco-innovation): Ø “What is going to drive Australian prosperity in the years ahead? How does our economy transition? Our innovation agenda is going to help create the modern, dynamic 21 st Century economy Australia needs. ” (Turnbull, 2015) Ø SDGs Voluntary National Review: We are “innovators” Ø Transformative innovation is anti-cyclical and resilient (Fillppetti and Archibugi, 2011, Laperche et al. , 2011) Ø Lack SD transformational shift with business investment weak; mining investment contracting since 2012 “expected to grow in 2019” (Treasury Secretary, 23 Oct 2019)

Australia and SDG 9 in 2019 “Australians are innovators. We have a highly-educated, vibrant and engaged population, shaped by world-class institutions. We have skills, experience and knowledge that can help deliver on the SDGs and have built partnerships across sectors and borders to address them. We have contributed our expertise to the development of the SDG Indicators and are sharing technology to help others develop the data to track and report. ” SDGs Voluntary National Review, Australia (DFAT, 2018) Highly limited SDGs action. Where is collaboration?
")
Source: Global Innovation Index (2014)

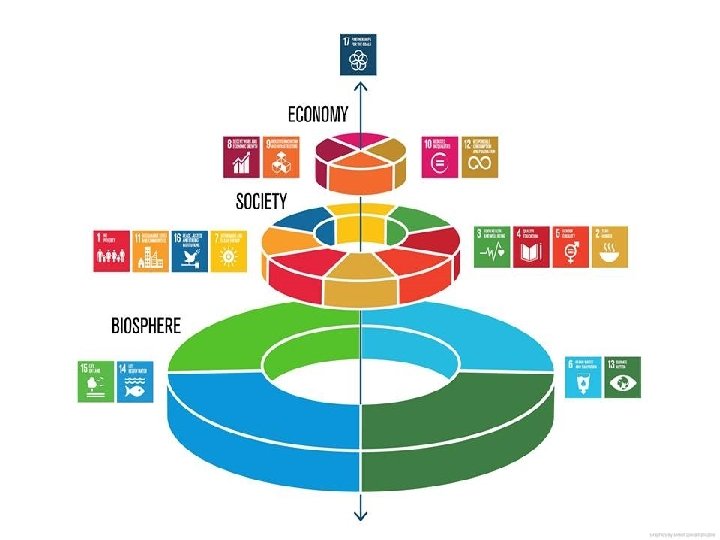
The three strata of reality

What is to be done? • Can not continue on the same development path with fine-tuning using standard EM-EG neoclassical economics tools (interest rates, tax cuts, infrastructure spending, micro-economic reform) • Need alternative EM-SD based on circular economy model that resolves internal debate • Focus on “eco-sustainable innovation” model underpin by Habermas Conceptual framework • (see Courvisanos, 2005; 2012)

The conceptual framework

References Burck, J. , Hagen, U. , Marten, F. , Höhne, N. , Bals, C. (2018), The Climate Change Performance Index: Results 2019. Germanwatch, Bonn. Accessed from https: //www. climate-change-performance-index. org/sites/default/files/documents/ ccpi 2019_results. pdf Courvisanos, J. (2005), A Post-Keynesian Innovation Policy for Sustainable Development, International Journal of Environment, Workplace and Employment, 1 (2), 187 -202. Courvisanos, J. (2012), Cycles, Crises and Innovation: Path to Sustainable Development – A Kaleckian-Schumpeterian Synthesis. Cheltenham, UK and Northampton, MA: Edward Elgar. Courvisanos J, Jain A and Mardaneh K (2016), Economic Resilience of Regions under Crises: A Study of the Australian Economy. Regional Studies, 50 (4): 629– 643. Cutler, T. (Chair) (2008), Venturous Australia: Building Strength in Innovation , Report on the Review of the Australian National Innovation System, Melbourne: Cutler & Company Pty. Ltd. Daly, H. (1977), Steady-State Economics, San Francisco, CA: W. H. Freeman. Department of the Environment and Energy (2018), Australian Energy Update 2018 , August 2018. Accessed from https: //www. energy. gov. au/sites/default/files/australian_energy_update_2018. pdf DFAT (2018), SDGs Voluntary National Review, Australia (DFAT, 2018) Fillppetti, A. and Archibugi, D. (2011), Innovation in Time of Crisis: National Systems of Innovation, Structure and Demand, Research Policy, 40 (2), 179 -92. Global Innovation Index (2014). Accessed from http: //www. globalinnovationindex. org/content. aspx? page=interactive-radarchart Habermas, J. (1987), Theory of Communicative Action, Volume Two – Lifeworld and System, A Critique of Functionalist Reason (transl. from German by Thomas Mc. Carthy), Boston: Beacon Press. Kemp, R. and Martens, P. (2007), Sustainable Development, Sustainability, 3 (2), 5 -14.
, Innovation Strategies of Industrial")
References Laperche, B. , Lefebvre, G. and Langlet, D. (2011), Innovation Strategies of Industrial Groups in the Global Crisis: Rationalisation and New Paths, Technological Forecasting & Social Change, 78 (8), 1319 -1331. Mardaneh K. , Jain A and Courvisanos J. (2016), Regional Economic Resilience and Adaptive Cycle Patterns: Specialisation and Diversity in Australia, 1986 to 2011, submitted in September 2019 to Environment and Planning A: Economy and Space. Manuscript ID is EPA-2019 -0338. Meadows, D. H. , D. L. Meadows, J. Randers and W. Behrens III (1972), The Limits to Growth, New York: Universe Books. OECD (2018), OECD Better Life Index, 1 November 2017. Accessed from http: //www. oecdbetterlifeindex. org/countries/ australia Office of the European Union (2018 and 2019), Fossil CO 2 Emissions of all World Countries: 2017 and 2018 Reports , Accessed from https: //ec. europa. eu/jrc/en/publication/fossil-co 2 -emissions-all-world-countries-2018 -report Pollin, Robert. 2015. Greening the Global Economy. Cambridge, MA: MIT Press. Schumacher, E. F. (1974), Small is Beautiful: A Study of Economics as if People Mattered, London: Abacus/Sphere Books (original published 1973 by Blond & Briggs). The Economist Intelligence Unit (2019), 2019 Global Liveability Report , The Economist’ London. Turnbull, M. (2015), Launch of the National Innovation and Science Agenda , 7 December. United Nations (2019), Report of the Secretary-General, Special edition: Progress towards the Sustainable Development Goals. Accessed from https: //undocs. org/E/2019/68 Victor, P. (2008), Managing without Growth: Slower by Design, Not Disaster. Cheltenham: Edward Elgar. Zacharias, N. (2007), Work/life Balance through a Critical ‘Gender Lens’: A Cross-country Comparison of Parental Leave Provisions and Take-up in Australia and Sweden , Ph. D thesis, University of Ballarat, Australia.

Any Questions?
- Slides: 41