Sustainable development and environment Sustainable Development Concept Sustainable

Sustainable development and environment

Sustainable Development Concept • Sustainable development is defined as a pattern of social and structured economic transformations (i. e. development) which optimizes the economic and societal benefits available in the present, without jeopardizing the likely potential for similar benefits in the future.

A primary goal of sustainable development is to achieve a reasonable and equitably distributed level of economic well-being that can be perpetuated continually for many human generations.

some definitions • Sustainable development implies using renewable natural resources in a manner which does not eliminate or degrade them, or otherwise diminish their usefulness for future generations. It further implies using non-renewable (exhaustible) mineral resources in a manner which does not unnecessarily preclude easy access to them by future generations. Sustainable development also requires depleting non-renewable energy resources at a slow enough rate so as to ensure the high probability of an orderly society transition to renewable energy sources.

some definitions q. Based on similar arguments, sustainable development has been alternatively defined in various manners also, some of them are as follows: q"Development that meets the needs of the present without compromising the ability of future generations to meet their own needs". --The World Commission on Environment, and development, Brundtland Commission 1987.

Therefore, the Development plans have to ensure: q. Sustainable and equitable use of resources for meeting the needs ofe present and future generations without causing damage to environment. q. To prevent further damage to our lifesupport systems; q. To conserve and nurture the biological diversity, gene pool and other resources for long term food security". -------State Of The Environment Report - 1999, Ministry of Environment and Forests, Government of India

Sustainable Development Indicators

Indicators can be divided into 4 groups: environmental economic social institutional

Environmental indicators: Water resource q Groundwater potential q Mean flow utilisable surface and ground water resources q Waste water generation, collection, and treatment in urban areas q Marine fish catch

Ground water potential of the country S. No. Name of Basin Total Replenishable Ground Water Resources 1. Brahmai with Baitarni 4. 05 2. Brahmaputra 26. 55 3. Cambai Composite 7. 19 4. Cauvery 12. 30 5. Ganga 170. 99 6. Godavari 40. 65 7. Indus 26. 49 8. Krishna 26. 41 9. Kutch & Saurashtra Composite 11. 23 10. Madras and South Tamil Nadu 18. 22 11. Mahanadi 16. 46 12. Meghna 8. 52 13. Narmada 10. 83 14. Northeast Composite 18. 84 15. Pennar 4. 93 16. Subarnrekha 1. 82 17. Tapi 8. 27 18. Western Ghat 17. 69 Total 431. 42

MERINE FISH CATCH

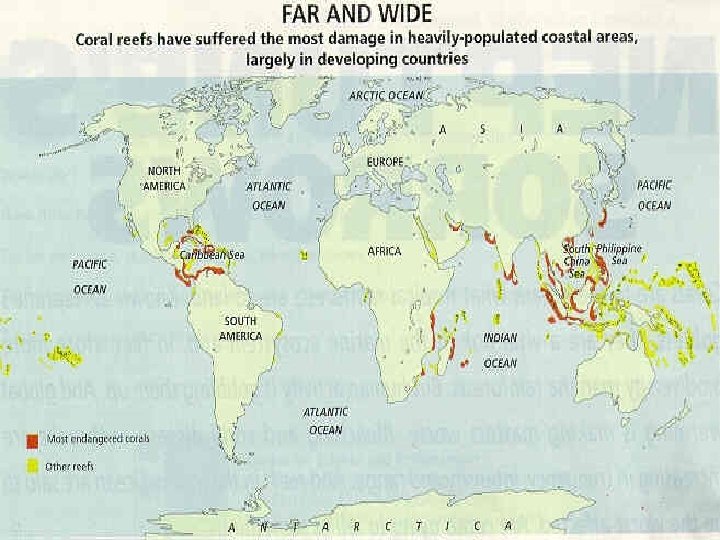
q coastal area manage ment Coastal areas are among the most developed and exploited in most regions of the world. q. Human populations in these areas use the resources from the sea, modify the landscape and produce large amounts of waste and chemical substances, which are released into the marine environment. q to allow continuing use of the resources of the coastal seas, the diversity of species and their associated functions need to be protected and managed in a sustainable way.

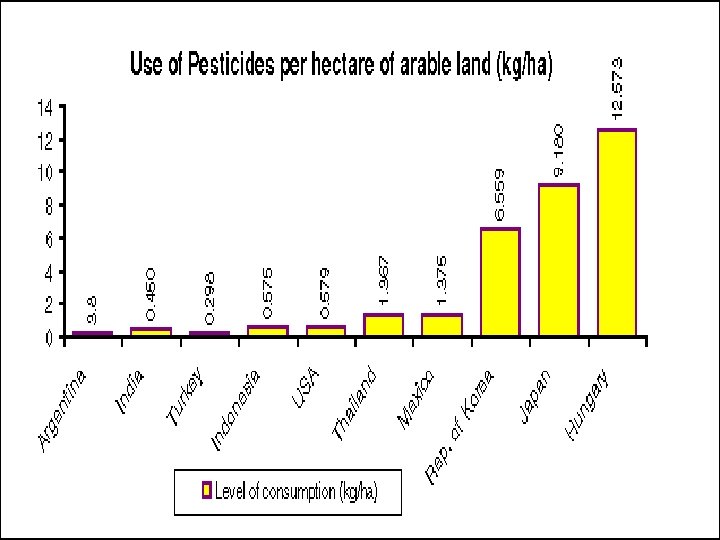
land resource q. Land use pattern q. Use of fertilizers q. Use of pesticides q. Arable land per capita (ha/capita)

Arable land per capita Source: compiled by UNEP GRID Geneva from FAOSTAT 1997

Landuse pattern changes over time

Forest resource • • • Total forest cover Wood energy Protected area Total wood from forest Deforestation rate
 at Dehra Dun is the premier")
FOREST INVENTORY q. Forest Survey of India (FSI) at Dehra Dun is the premier institute for Forest Inventory necessary for the planned development of forestry. q. Out of 445 million cattle in the country, nearly 270 million graze in forest areas. q. The requirement of green and dry fodder has increased to 699 and 552 million tonnes in 2001 and 817 and 615 million tonnes respectively in 2006. It is generally agreed that nearly 30% of the fodder requirement of the country comes from the forest areas. and this has been causing considerable depletion of the forest resources.

WOOD BALANCE AND DEMAND FUELWOOD q. According to a study of FSI in 1996, the total requirement of fuel-wood in th ecountry is around 201 million tonnes. q. The demands of fuel-wood for 2001 and 2006 are 223 and 247 million tonnes respectively.

TIMBER • The total demand of timber has been estimated at 64 million cu. m in 1996, which has rised to 73 and 82 million cu. m in 2001 and 2006 respectively. • Study of FSI indicates that out of the total removal from forests around 70 percent is used as fuel-wood and 30 percent is used as small timber and timber.

q. FODDER q. Out of 445 million cattle in the country, nearly 270 million graze in forest areas. q. The requirement of green and dry fodder has increased to 699 and 552 million tonnes in 2001 and 817 and 615 million tonnes respectively in 2006. q. It is generally agreed that nearly 30% of the fodder requirement of the country comes from the forest areas.
")
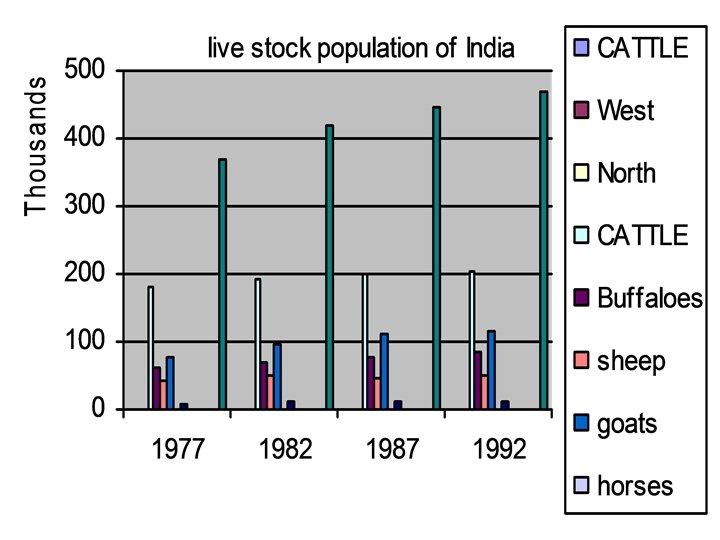
Animal resource q. Threatened animal species q. Rate of extinction of protected species (%) q. Livestock population

Source: WCMC/IUCN 1998

Annual commercial energy consumption

Co 2 emissions per capita

Ambient air quality status of various cities/towns . . Pollution level Annual Mean Concentration Range (µg/m 3) Industrial (I) Residential (R) SO 2 & NO 2 SPM Low (L) 0 -40 0 -180 0 -30 0 -70 Moderate (M) 40 -80 180 -360 30 -60 70 -140 High (H) 80 -120 360 -540 60 -90 140 -210 >120 >540 >90 >210 . . Critical (C)

STATE / CITY AREA CLASS SO 2 NO 2 SPM I R I R Hyderabad L L L M H H Vishakhapatnam L L L C Jharia M - H - Dhanbad - H - M - C Andhra Pradesh Bihar

STATE / CITY West Bengal SO 2 i NO 2 r i SPM r i r Kolkata M M L L H C Chandigarh L L M H Pondichery - L - M
 Waste generation Municipal solid waste management Hazardous waste management")
Waste management Waste disposed (t) Waste generation Municipal solid waste management Hazardous waste management

Waste management • Indian urban waste is a heterogeneous mixture of paper, plastic, cloth, metal and organic matter. • the urban municipal solid waste generated in 1997 is estimated at 48 million tonnes. • the current per-capita waste generation figure of 490 grams is very low compared to that of 1950 grams in the US (Franklin Associates 1997)

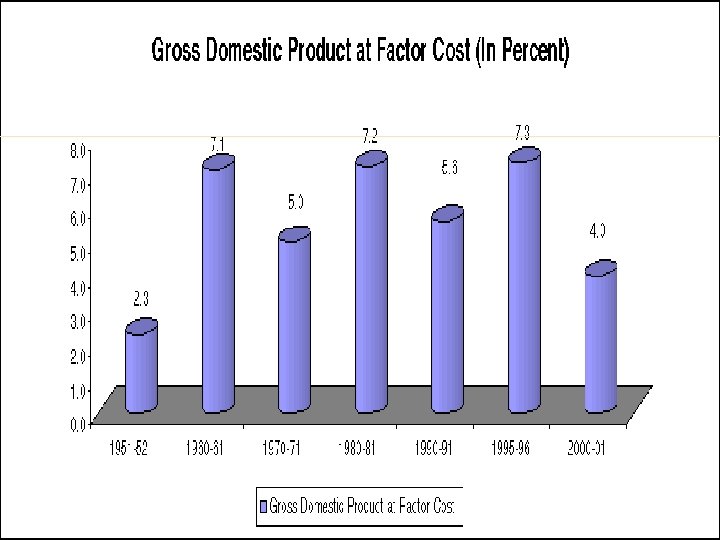
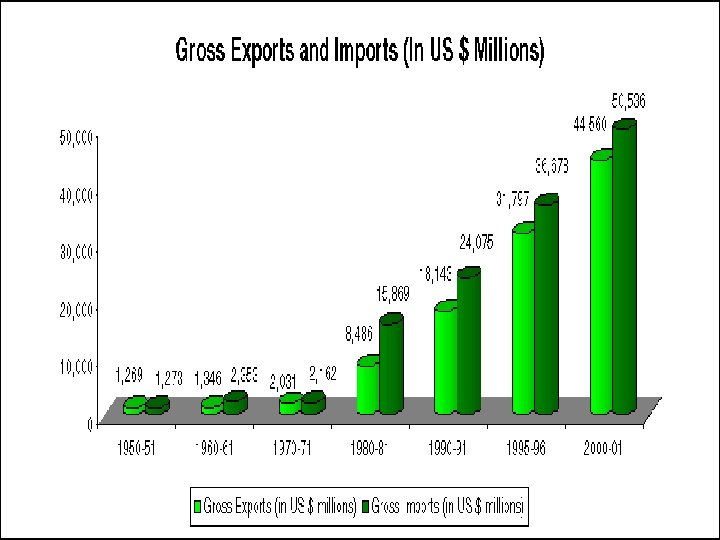
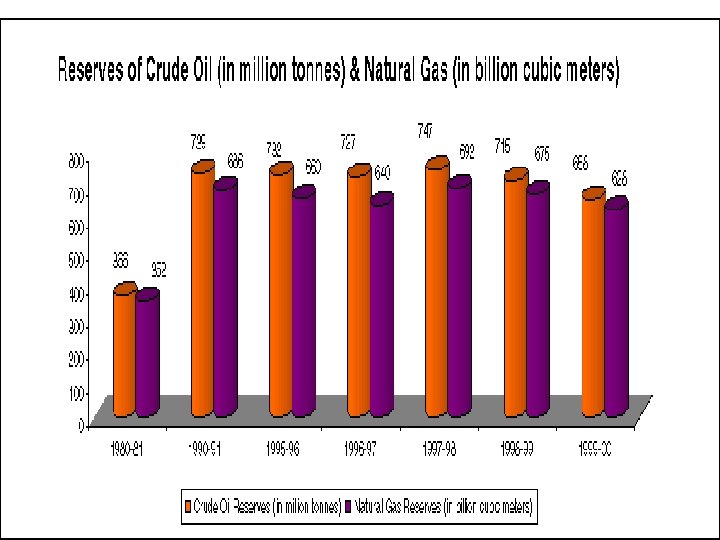
Economic indicators: – GDP growth rate – Gross Exports and Imports – Reserves of natural resources • Crude Oil and Natural Gas • Coal • Other minerals – Annual energy consumption per capita

Source: Ministry of Coal, Government of India, New Delhi.

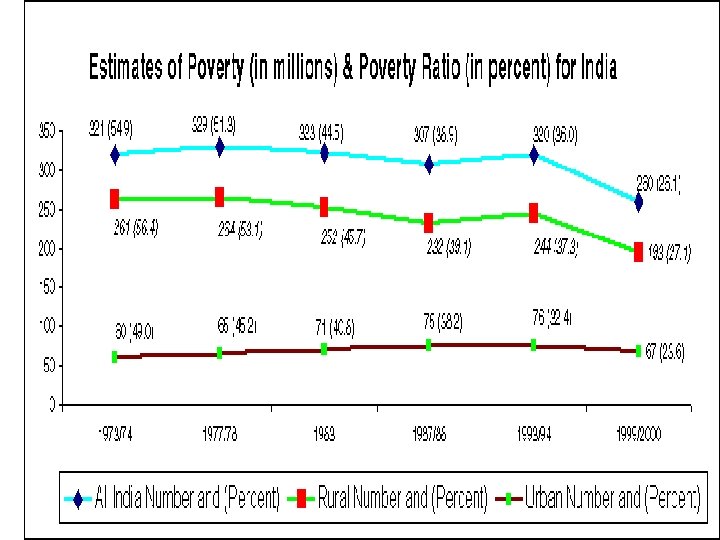
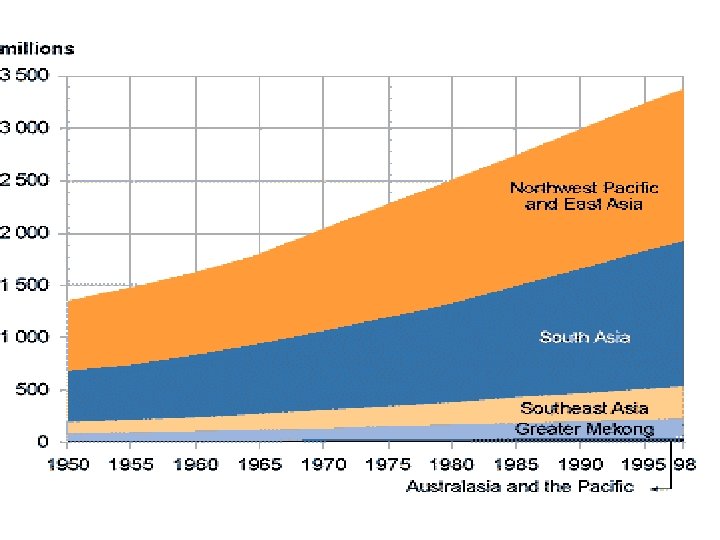
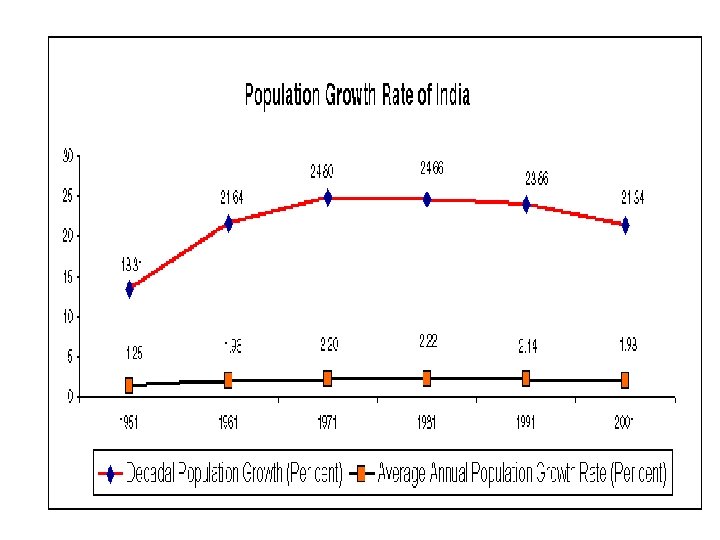
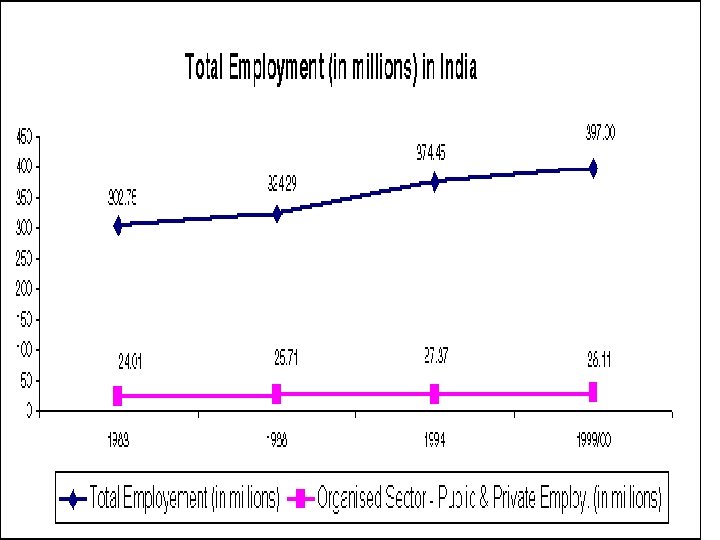
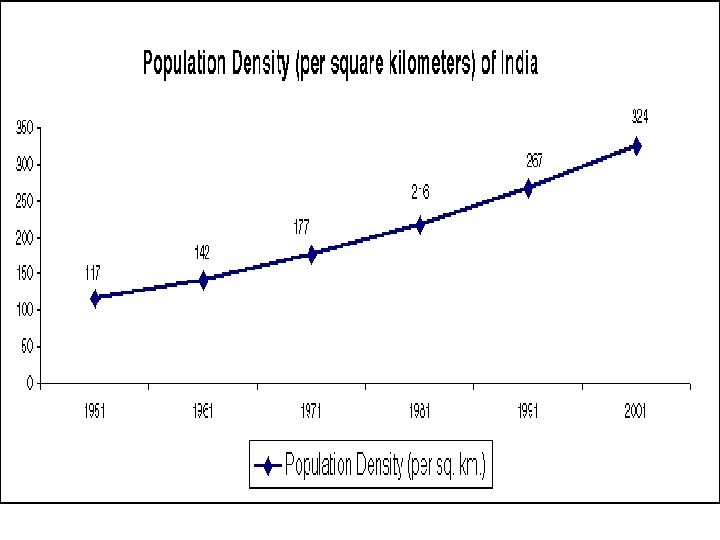
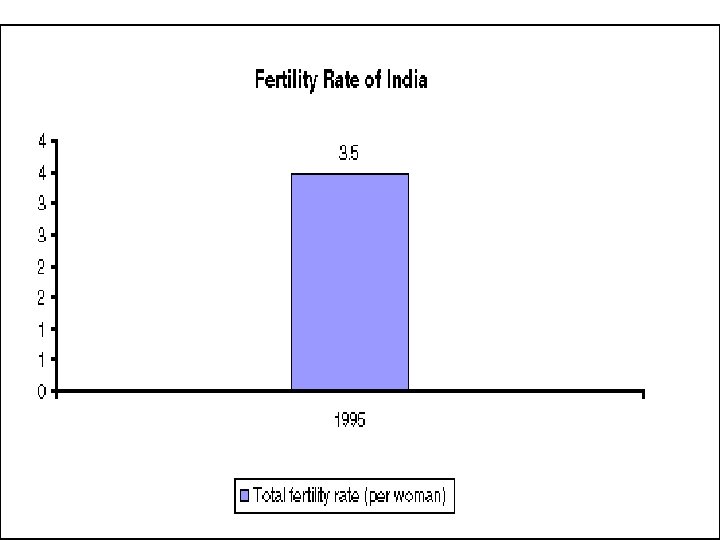
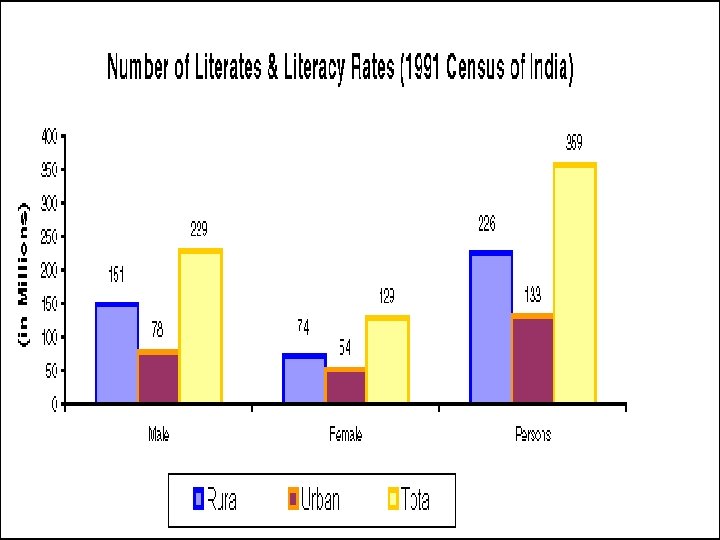
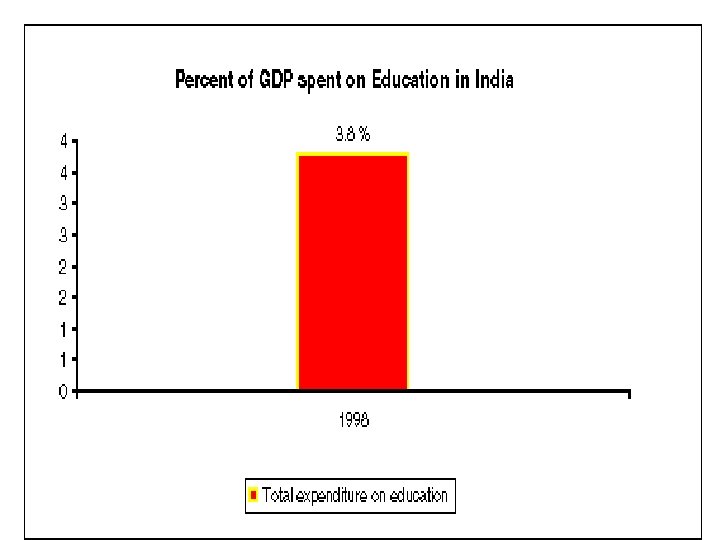
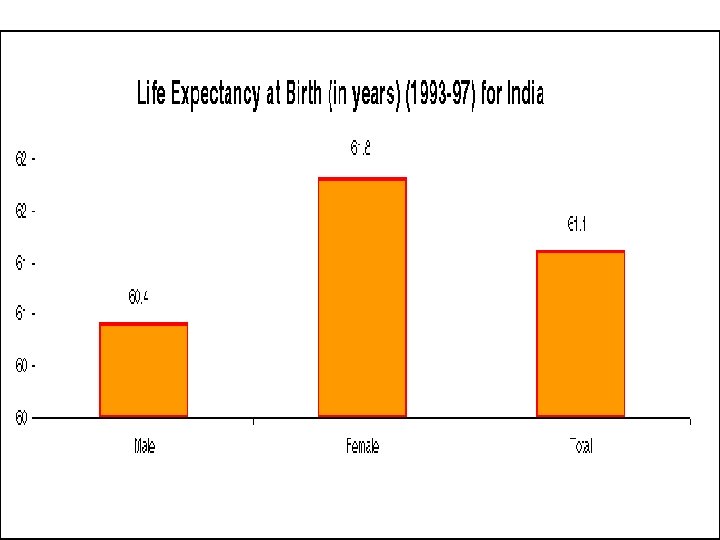
Social indicators: – Poverty ratio – Employment rate – Population growth rate – Population density – Fertility rate – Literacy rate – % of GDP spent on education – % of people having access to safe drinking water
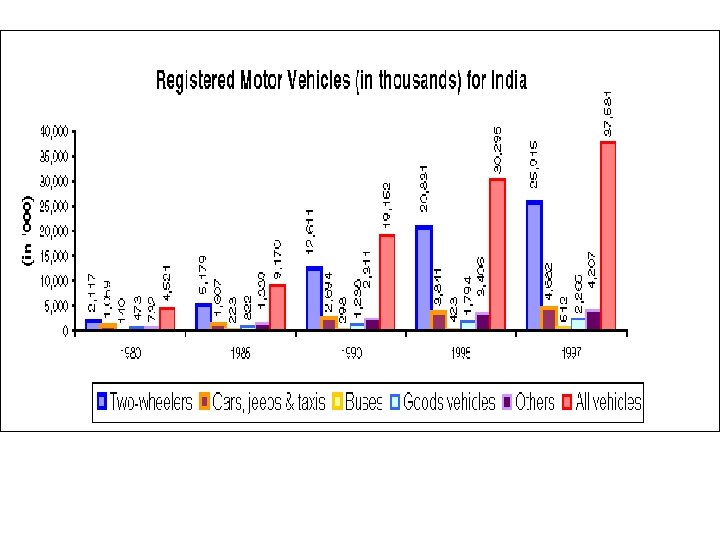
 from gasoline cars, 2 -wheelers, 3 wheelers Fatal")
Pollutants Health effects Carbon Monoxide (CO) from gasoline cars, 2 -wheelers, 3 wheelers Fatal in large does; aggrivates heart disorders; effects central nervous system; impairs oxygen carrying capacity of blood Nitrogen oxides (Nox) from diesel vehicles Irritation of respiratory tract Ozone Eye, nose and throat irritation; risk asthmatics, children and those involved in heavy exercise Lead (from petrol vehicles) Extremely toxic : effects nervous system and blood; can impair mental development of children; causes hypertension Hydrocarbons (HC) mainly from 2 wheelers, 3 -wheelers Drowsiness , eye irritation, coughing Benzene Carcinogenic Aldehydes Irritation of eyes, nose and throat, sneezing, coughing, nausea, breathing difficulties; carcinogenic in animals Polycyclic aromatic hydrocarbons (PAH) from diesel vehicles Carcinogenic

What are the measures?
 is an assessment of the possible impact—positive or negative")
An environmental impact assessment (EIA) is an assessment of the possible impact—positive or negative —that a proposed project may have on the environment, together consisting of the natural, social and economic aspects.

EIA IN INDIA q The Ministry of Environment and Forests of India have been in a great effort in Environmental Impact Assessment in India. The main laws in nation are q Water Act(1974), q The Indian Wildlife (Protection) Act (1972), q The Air (Prevention and Control of Pollution) Act (1981) q The Environment (Protection) Act (1986) q The responsible body for this is Central Pollution Control Board (CPCB).

Towards new idea

GREEN GROWTH

4 PILLERS OF GREEN GROWTH 1. GREEN TAX 2. GREEN INFRASTRUCTURE 3. GREEN BUSINESS 4. GREEN PRODUCTION& CONSUMPTION


Government policy: The ESCAP Second Green Growth Policy Dialogue, held in Beijing in May 2006, underlined the important role that public policy plays. Presentations and discussions at the forum pointedout that Governments’ roles should include: • Developing policy frameworks for regulatory standards; • infrastructure development and • demand-side consumption management • Demand-side management using appropriate economic instruments and pricing systems • Nurturing stakeholder engagement – both consumers and businesses • Promoting the sustainable consumption of products and services, via public procurement • processes and infrastructure development • Re-enforcing the linkages between traditional lifestyles, cultural values and consumption patterns • Supporting energy efficiency progress with policies and standards.

MECHANISM OF GREEN BUSINESS

environment and people education

Environmental education is a learning process that qincreases people's knowledge and awareness about the environment and associated challenges, q develops the necessary skills and expertise to address the challenges, q and fosters attitudes, motivations, and commitments to make informed decisions and take responsible action. q. Environmental education embraces all disciplines, and covers all levels and types of education including life-long learning. q. It is planned and implemented through several programmes and Sectors within the organization, notably the Science Sector and the Education Sector.

THANK YOU
- Slides: 67