Sustainability Considerations in the Design of Big Dams

Sustainability Considerations in the Design of Big Dams: Merowe, Nile Basin Mentor: Prof. El Fatih Eltahir Group: Anthony Paris, Teresa Yamana, Suzanne Young

Outline Ø Introduction and motivation Ø Nile hydrology Ø The model Ø Climate Ø Sedimentation Ø Public health Ø Difficulties and lessons learned Ø Conclusions

Goals and Motivation Simulate the role of environmental engineers in large scale projects Ø Analyze the effect the Dam will have on the environment and local population, and make recommendations to mitigate effects Ø Assess whether long-term effects will significantly decrease Dam’s lifetime and plan accordingly Ø

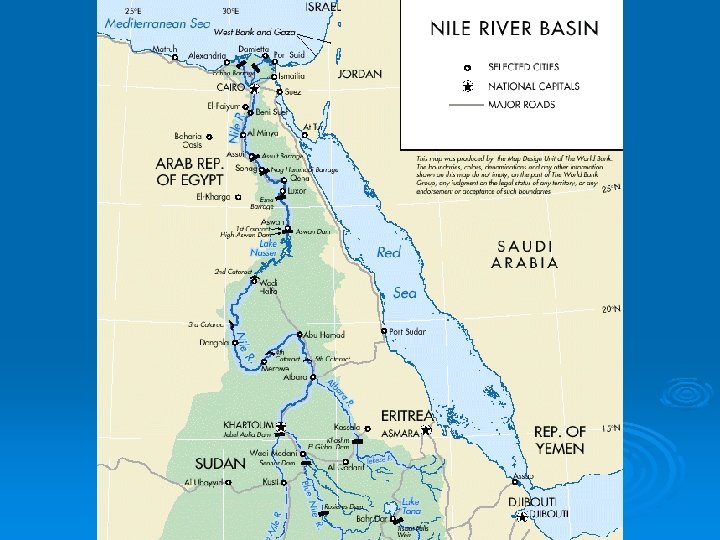
Introduction Ø Sudan needs Energy l l Ø Merowe Dam l Ø 19 -year old Civil War Frequent power blackouts Utilizing Hydropower Dam Design Details l l Ten turbines – 1, 250 MW Capacity Length: 10 km Height: 65 m Reservoir Length: 170 km

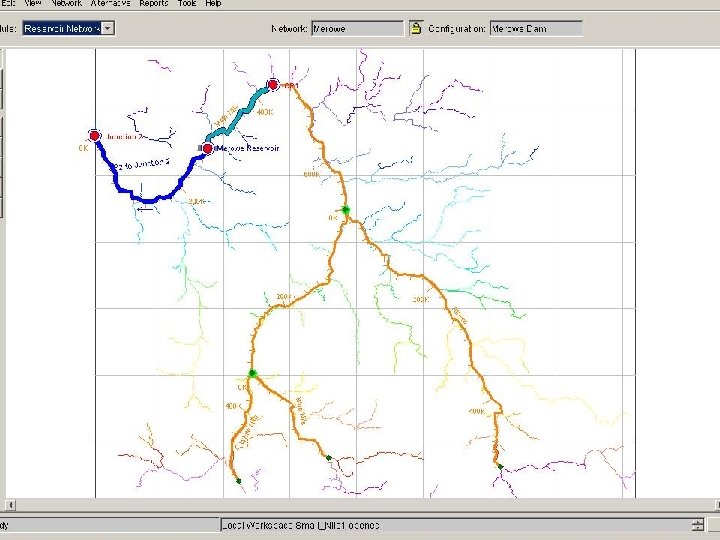
General Layout


Storage to Elevation Relationship

“The Model”

The Effect of Climate Change on Dam Performance Suzanne Young

Climate Ø How do changes in river flow caused by climate change affect the Merowe Dam’s power capacity?

The Big Picture Documented changes in chemical composition of atmosphere (e. g. CO 2 is rising) Ø Scientists predict if this activity continues, it will impact the environment Ø Lots of studies on climate change and global warming done by governments in U. S. , Europe Ø Models agree global temperatures will rise, less certain about regional impacts (precipitation) Ø We don’t know what is going to happen to Nile flows! Ø

Range of discharges for major points along the Nile (Summary of Yates 1998 b results) Two numbers on ends of each line represent extreme discharges of six GCM scenarios, whereas boxed number is historic average; Additional tick marks on each line are remaining GCM scenarios, which indicate range of climate change induced flows of Nile Basin.

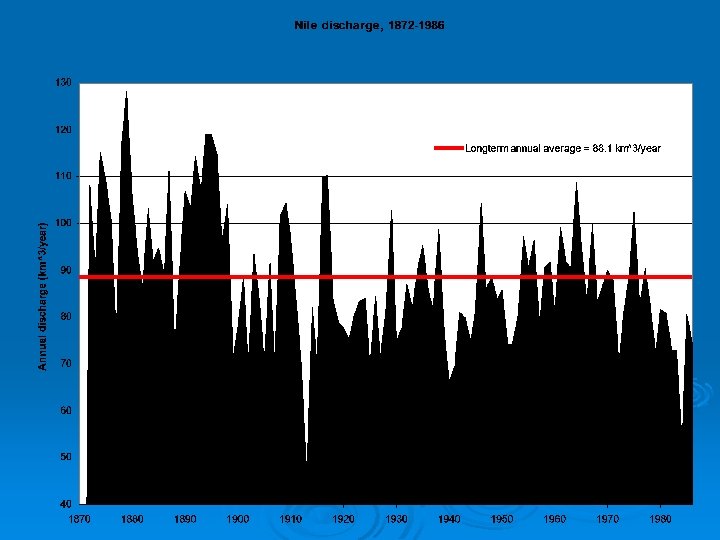
TO DO Ø Show different results of studies, and convince audience that we don’t know what will happen = document uncertainty! Ø Calculate hydropower under different scenarios of climate change: l l l Last 100 years Wetter climate Drier climate Ø Make recommendations to dam design

Potential Hydropower Power = γQh γ = ρg ρ = density of water = 1000 [kg/m 3] g = gravity = 9. 8 [m/s 2] Q = flow at dam [m 3/s] h = drop in head between intake to powerhouse and outlet to river [m]

Sedimentation into the Reservoir Anthony Paris
 Ø Travels through the Blue Nile")
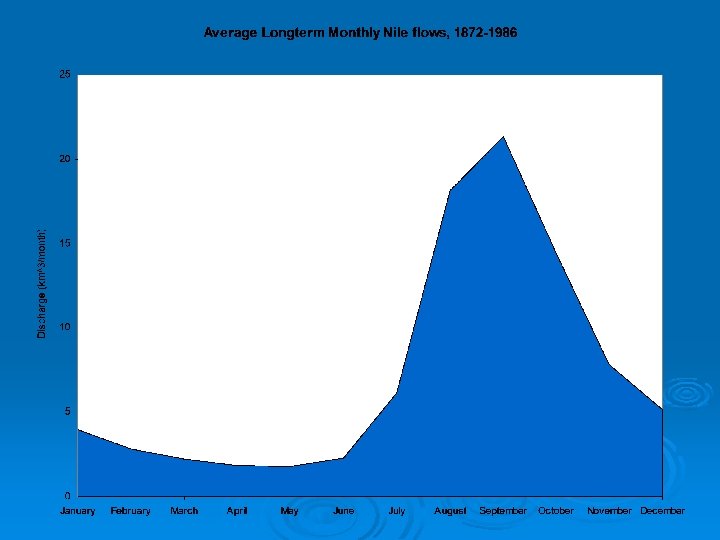
Erosion: Sources of Nile Sediments Ethiopian Highlands (~90%) Ø Travels through the Blue Nile and Atbara Ø The sediment load is most significant during flood season (July. Oct. ) Ø ~140 million tones per year Ø

Transportation Ø Suspended Load l Ø Distribution: l l l Ø particulates that travel while suspended in the water column 30% Clay (<0. 002 mm) 40% Silt (0. 002 -0. 02 mm) 30% Fine Sand (0. 02 -0. 2 mm) High level of total suspension

Reservoir Deposition I When river flow enters a reservoir, its velocity and transport capacity is reduced and its sediment load is deposited. Ø The depositional pattern usually starts with coarser material depositing first followed by the fine creating a delta. Ø Factors Ø l l l Detention Time Shape of reservoir Operating procedures

Reservoir Deposition II
 from Q (Flow) Ø Find Hydrograph with")
Hand Calculations Calculating QS (“Flow” of Sediments) from Q (Flow) Ø Find Hydrograph with corresponding Sediment Load Concentrations Ø Convert Load from concentration (mg/L)to volume (m 3) Ø Do linear regression to determine correlation between QS and Q; breaking the hydrograph into two sections, monsoon, and non-monsoon. Ø Extrapolate over 100 year monthly data set to have QS Ø

Hand Calculations Calculating Trapping Efficiency – 1 st Round Ø Brune’s Curve Ø C = Capacity Ø I = Inflow Ø

The Effect of the Dam on Public Health Teresa Yamana

Dams’ Threat to Public Health Ø Stagnant water in reservoirs and irrigation ditches provide habitat for vectors Ø Constant supply of water - Dry season no longer limits vectors Ø Merowe Dam expected to increase incidence of Malaria, Schistosomiasis, River Blindness and Rift Valley Fever

Malaria Transmission Ø Ø Ø Protozoa Plasmodium transmitted by Anopheles mosquitoes Causes 1 million deaths per year Fever-like symptoms A. funestus breeds in illuminated shoreline throughout the year A. gambiae breeds in reservoir drawdown area in dry season (November – June)

Drawdown Area: 2. 46 x 108 m 3

Drawdown Area: 2. 46 x 108 m 3

Recommendations Ø Malaria – Whenever possible, relocate communities outside of mosquito flight range Ø River Blindness – Stop flow over spillways for two days every two weeks over wet season to inhibit blackfly breeding Ø More to come (hopefully)

Difficulties Ø TOO BROAD Ø Model is stupid Ø Conflicting expectations

Conclusions Ø? Ø?
- Slides: 34