
Susser Holdings Corporation Business Review October 2013 Safe

Susser Holdings Corporation Business Review October 2013

Safe Harbor Some of the statements in this presentation constitute “forward-looking statements” about Susser Holdings Corporation and/or Susser Petroleum Partners that involve risks, uncertainties and assumptions, including without limitation, our discussion and analysis of our financial condition and results of operations. These forward-looking statements generally can be identified by use of phrases such as “believe, ” “plan, ” “expect, ” “anticipate, ” “intend, ” “forecast” or other similar words or phrases in conjunction with a discussion of future operating or financial performance. Descriptions of our objectives, goals, targets, plans, strategies, costs, anticipated capital expenditures, expected cost savings, expansion of our foodservice offerings, potential acquisitions, and potential new store openings and dealer locations, are also forward-looking statements. These statements represent our present expectations or beliefs concerning future events and are not guarantees. Such statements speak only as of the date they are made, and we do not undertake any obligation to update any forward-looking statement. We caution that forward-looking statements involve risks and uncertainties and are qualified by important factors that could cause actual events or results to differ materially from those expressed or implied in any such forward-looking statements. For a discussion of these factors and other risks and uncertainties, please refer to our respective filings with the Securities and Exchange Commission (“the SEC”), including those contained in our Annual Report on Form 10 -K for our most recent fiscal year and any subsequent Quarterly Reports on Form 10 -Q, available at the SEC’s website at www. sec. gov. We intend for the forward-looking statements to be covered by the Safe Harbor provisions forward-looking statements contained in the Private Securities Litigation Reform Act of 1995, and are including this statement for purpose of complying with these Safe Harbor provisions. This presentation is not a prospectus and is not an offer to sell securities. Before you invest, you should read our filings with the SEC for more complete information about us. 2
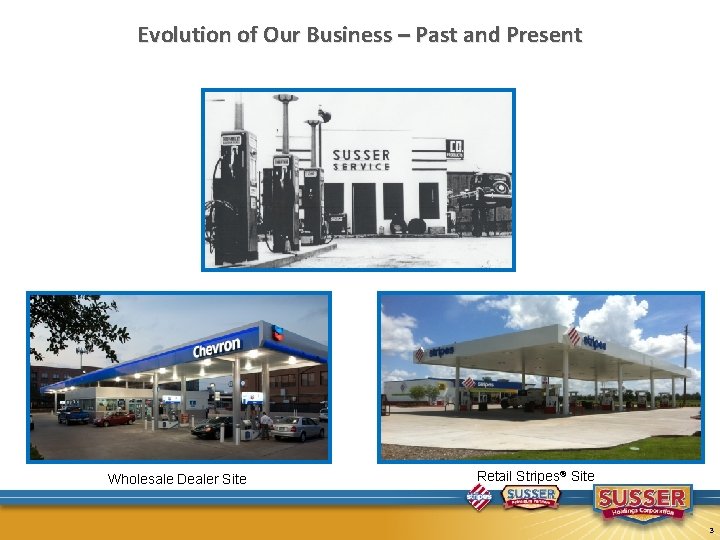
Evolution of Our Business – Past and Present Wholesale Dealer Site Retail Stripes® Site 3
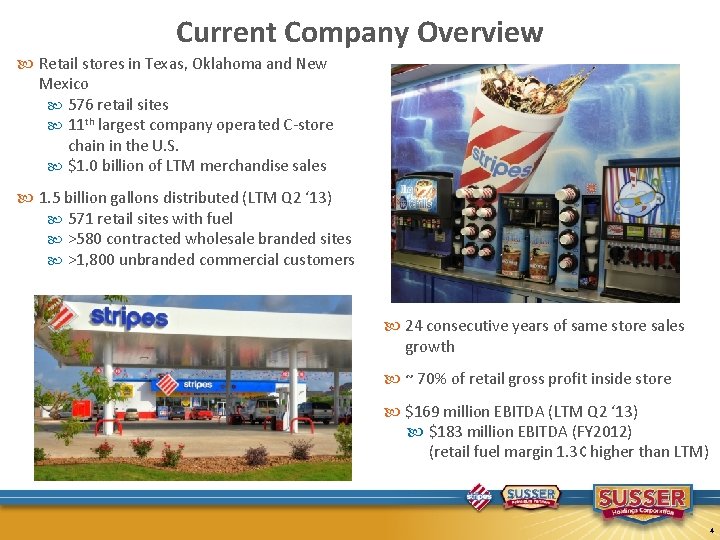
Current Company Overview Retail stores in Texas, Oklahoma and New Mexico 576 retail sites 11 th largest company operated C-store chain in the U. S. $1. 0 billion of LTM merchandise sales 1. 5 billion gallons distributed (LTM Q 2 ‘ 13) 571 retail sites with fuel >580 contracted wholesale branded sites >1, 800 unbranded commercial customers 24 consecutive years of same store sales growth ~ 70% of retail gross profit inside store $169 million EBITDA (LTM Q 2 ‘ 13) $183 million EBITDA (FY 2012) (retail fuel margin 1. 3¢ higher than LTM) 4
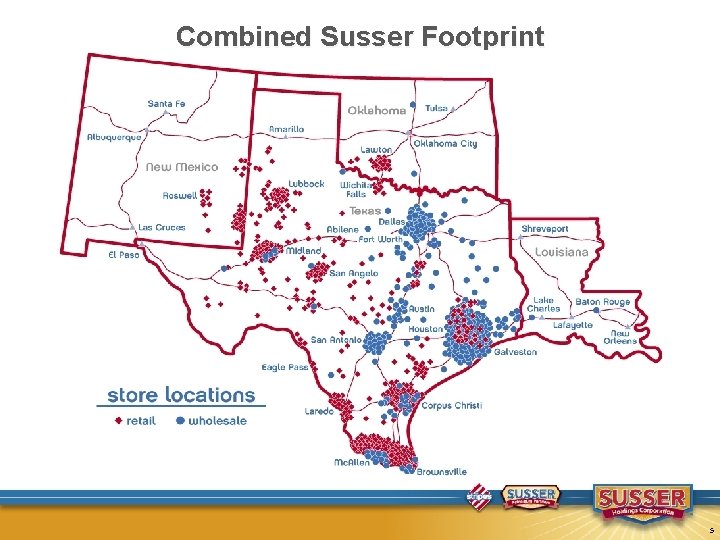
Combined Susser Footprint 5
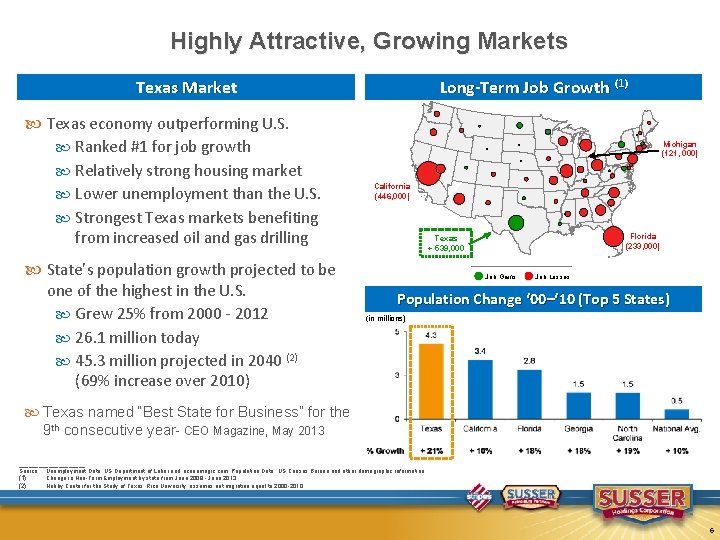
Highly Attractive, Growing Markets Texas Market Texas economy outperforming U. S. Ranked #1 for job growth Relatively strong housing market Lower unemployment than the U. S. Strongest Texas markets benefiting from increased oil and gas drilling State’s population growth projected to be one of the highest in the U. S. Grew 25% from 2000 - 2012 26. 1 million today 45. 3 million projected in 2040 (2) (69% increase over 2010) Long-Term Job Growth (1) Michigan (121, 000) California (446, 000) Florida (233, 000) Texas + 539, 000 Job Gains Job Losses Population Change ‘ 00–‘ 10 (Top 5 States) (in millions) Texas named “Best State for Business” for the 9 th consecutive year- CEO Magazine, May 2013 __________ Source: Unemployment Data: US Department of Labor and economagic. com; Population Data: US Census Bureau and other demographic information. (1) Change in Non-Farm Employment by state from June 2008 - June 2013. (2) Hobby Center for the Study of Texas, Rice University; assumes net migration equal to 2000 -2010. 6
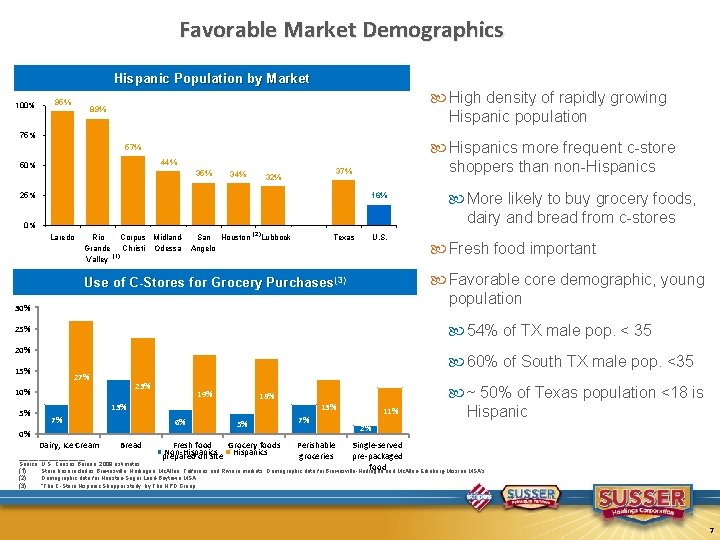
Favorable Market Demographics Hispanic Population by Market 100% 95% High density of rapidly growing Hispanic population 89% 75% Hispanics more frequent c-store shoppers than non-Hispanics 57% 44% 50% 35% 34% 37% 32% 25% 16% 0% Laredo Rio Corpus Midland. San Houston Grande Christi Odessa Angelo (1) Valley (2) Lubbock Texas U. S. 30% 54% of TX male pop. < 35 25% 20% 60% of South TX male pop. <35 15% 27% 23% 10% 0% Fresh food important Favorable core demographic, young population Use of C-Stores for Grocery Purchases(3) 5% More likely to buy grocery foods, dairy and bread from c-stores 19% 18% 13% 7% Dairy, Ice Cream 6% Bread Fresh food Non-Hispanics 5% Grocery foods Hispanics 13% 7% Perishable 11% ~ 50% of Texas population <18 is Hispanic 2% Single-served __________ prepared on site groceries pre-packaged Source: U. S. Census Bureau, 2009 estimates. food (1) Store base includes Brownsville, Harlingen, Mc. Allen, Falfurrias and Riviera markets. Demographic data for Brownsville-Harlingen and Mc. Allen-Edinburg-Mission MSA’s. (2) Demographic data for Houston-Sugar Land-Baytown MSA. (3) “The C-Store Hispanic Shopper study, by The NPD Group. 7
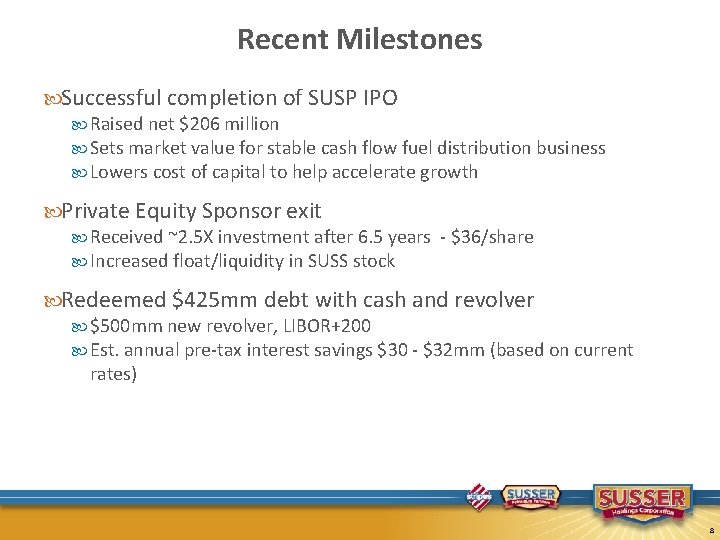
Recent Milestones Successful completion of SUSP IPO Raised net $206 million Sets market value for stable cash flow fuel distribution business Lowers cost of capital to help accelerate growth Private Equity Sponsor exit Received ~2. 5 X investment after 6. 5 years - $36/share Increased float/liquidity in SUSS stock Redeemed $425 mm debt with cash and revolver $500 mm new revolver, LIBOR+200 Est. annual pre-tax interest savings $30 - $32 mm (based on current rates) 8
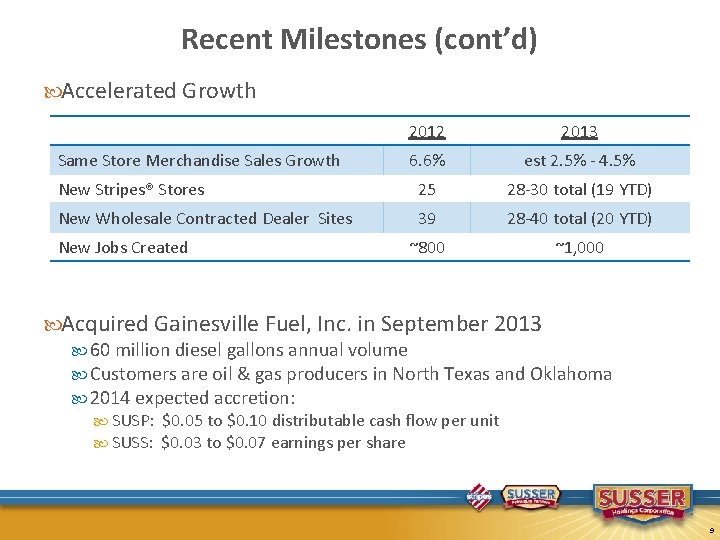
Recent Milestones (cont’d) Accelerated Growth 2012 2013 6. 6% est 2. 5% - 4. 5% New Stripes® Stores 25 28 -30 total (19 YTD) New Wholesale Contracted Dealer Sites 39 28 -40 total (20 YTD) ~800 ~1, 000 Same Store Merchandise Sales Growth New Jobs Created Acquired Gainesville Fuel, Inc. in September 2013 60 million diesel gallons annual volume Customers are oil & gas producers in North Texas and Oklahoma 2014 expected accretion: SUSP: $0. 05 to $0. 10 distributable cash flow per unit SUSS: $0. 03 to $0. 07 earnings per share 9
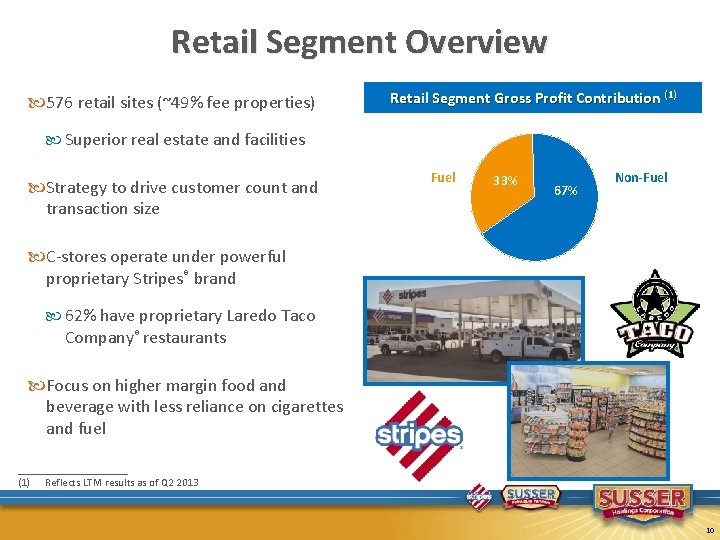
Retail Segment Overview 576 retail sites (~49% fee properties) Retail Segment Gross Profit Contribution (1) Superior real estate and facilities Strategy to drive customer count and transaction size Fuel 33% 67% Non-Fuel C-stores operate under powerful proprietary Stripes® brand 62% have proprietary Laredo Taco Company® restaurants Focus on higher margin food and beverage with less reliance on cigarettes and fuel __________ (1) Reflects LTM results as of Q 2 2013 10
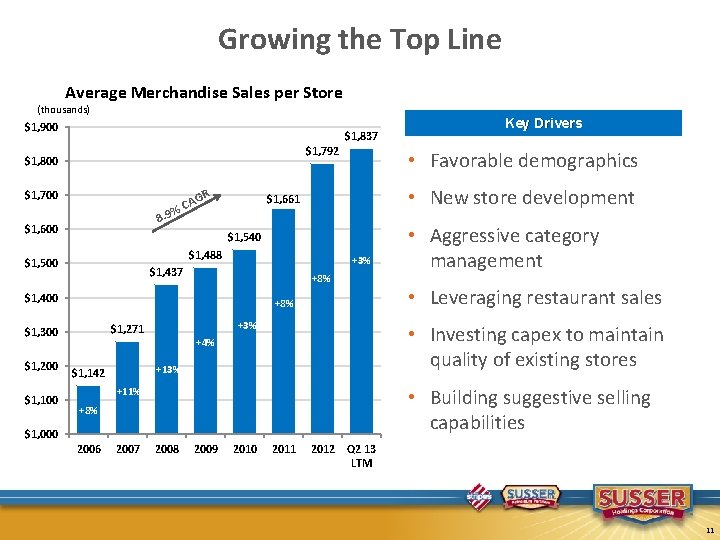
Growing the Top Line Average Merchandise Sales per Store (thousands) $1, 900 $1, 837 $1, 792 $1, 800 $1, 700 GR 8. 9 $1, 600 $1, 488 +3% $1, 437 +8% $1, 400 +3% $1, 271 • Investing capex to maintain quality of existing stores +4% +13% $1, 142 • Building suggestive selling capabilities +11% +8% $1, 000 2006 2007 • Aggressive category management • Leveraging restaurant sales +8% $1, 300 $1, 100 • New store development $1, 540 $1, 500 $1, 200 • Favorable demographics $1, 661 A %C Key Drivers 2008 2009 2010 2011 2012 Q 2 13 LTM 11
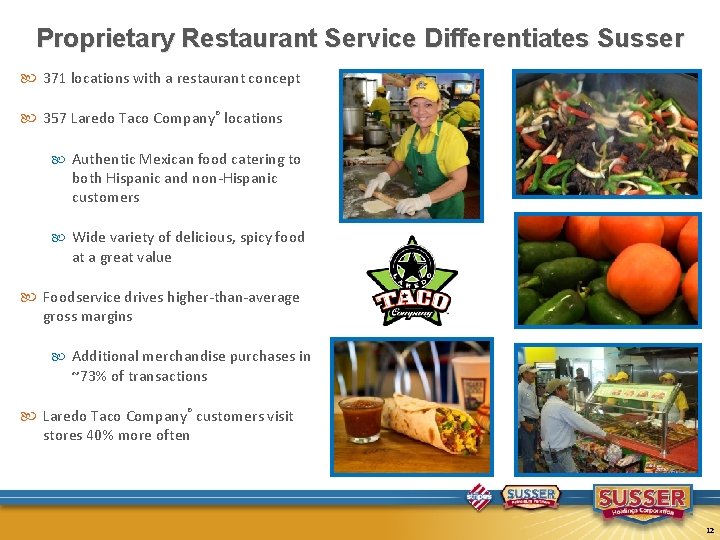
Proprietary Restaurant Service Differentiates Susser 371 locations with a restaurant concept 357 Laredo Taco Company® locations Authentic Mexican food catering to both Hispanic and non-Hispanic customers Wide variety of delicious, spicy food at a great value Foodservice drives higher-than-average gross margins Additional merchandise purchases in ~73% of transactions Laredo Taco Company® customers visit stores 40% more often 12
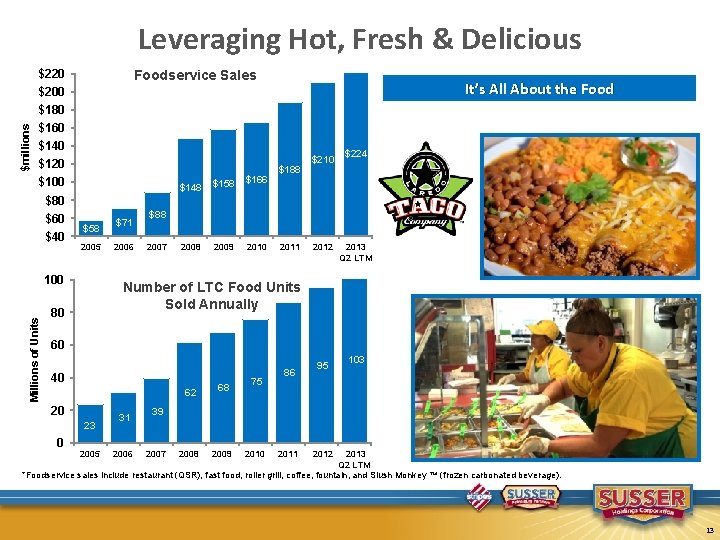
Leveraging Hot, Fresh & Delicious Foodservice Sales $220 It’s All About the Food $200 $millions $180 $160 $140 $120 $100 $148 $158 $166 2008 2009 2010 $188 $210 $224 $80 $60 $40 $58 2005 Millions of Units 100 $71 2006 $88 2007 2011 2012 2013 Q 2 LTM Number of LTC Food Units Sold Annually 80 60 40 62 20 23 0 2005 31 2006 68 75 86 95 103 39 2007 2008 2009 2010 2011 2012 2013 Q 2 LTM *Foodservice sales include restaurant (QSR), fast food, roller grill, coffee, fountain, and Slush Monkey ™ (frozen carbonated beverage). 13
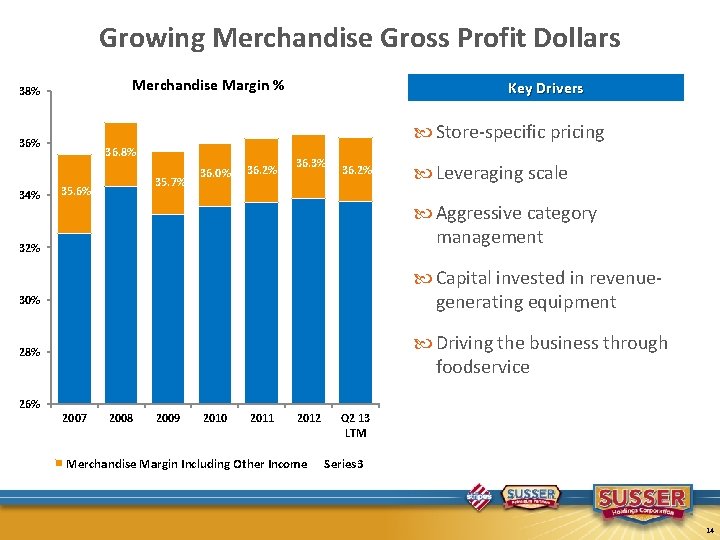
Growing Merchandise Gross Profit Dollars Merchandise Margin % 38% Store-specific pricing 36% 34% Key Drivers 36. 8% 35. 7% 35. 6% 36. 0% 36. 2% 36. 3% 36. 2% Leveraging scale Aggressive category management 32% Capital invested in revenuegenerating equipment 30% Driving the business through foodservice 28% 26% 2007 2008 2009 2010 2011 2012 Merchandise Margin Including Other Income 32. 5% 34. 3% 33. 6% 33. 7% 33. 9% Q 2 13 LTM Series 3 33. 8% 14
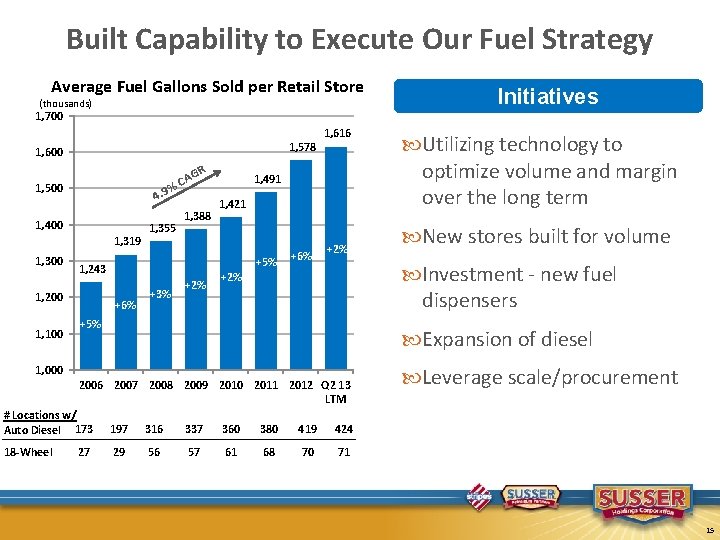
Built Capability to Execute Our Fuel Strategy Average Fuel Gallons Sold per Retail Store (thousands) 1, 700 1, 578 1, 600 GR A %C 1, 500 4. 9 1, 400 1, 319 1, 300 1, 491 1, 421 +5% 1, 243 1, 200 1, 100 1, 355 1, 388 +6% +3% +2% 1, 616 +6% +2% Utilizing technology to optimize volume and margin over the long term New stores built for volume Investment - new fuel dispensers +2% +5% Expansion of diesel 1, 000 2006 2007 2008 2009 2010 2011 2012 Q 2 13 LTM # Locations w/ Auto Diesel 173 197 316 337 360 380 419 424 18 -Wheel 29 56 57 61 68 70 71 27 Initiatives Leverage scale/procurement 15
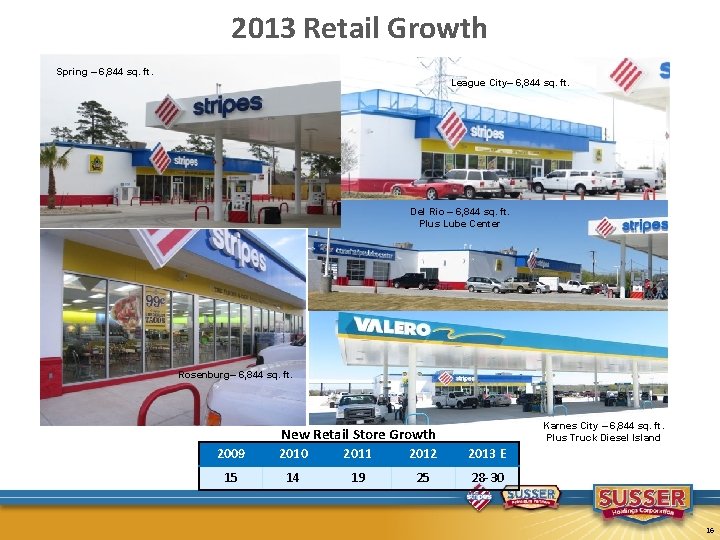
2013 Retail Growth Spring – 6, 844 sq. ft. League City– 6, 844 sq. ft. Del Rio – 6, 844 sq. ft. Plus Lube Center Rosenburg– 6, 844 sq. ft. Karnes City – 6, 844 sq. ft. Plus Truck Diesel Island New Retail Store Growth 2009 2010 2011 2012 2013 E 15 14 19 25 28 -30 16
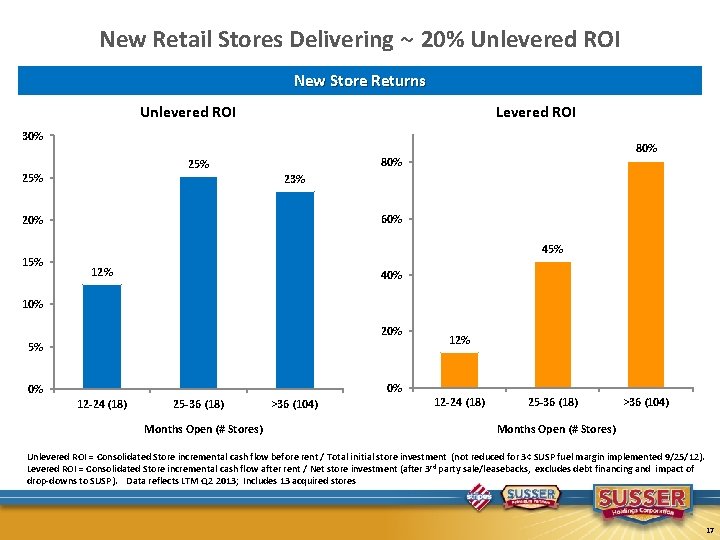
New Retail Stores Delivering ~ 20% Unlevered ROI New Store Returns Unlevered ROI Levered ROI 30% 25% 23% 60% 20% 15% 80% 45% 12% 40% 10% 20% 5% 12% 0% 0% 12 -24 (18) 25 -36 (18) Months Open (# Stores) >36 (104) 12 -24 (18) 25 -36 (18) >36 (104) Months Open (# Stores) Unlevered ROI = Consolidated Store incremental cash flow before rent / Total initial store investment (not reduced for 3¢ SUSP fuel margin implemented 9/25/12). Levered ROI = Consolidated Store incremental cash flow after rent / Net store investment (after 3 rd party sale/leasebacks, excludes debt financing and impact of drop-downs to SUSP). Data reflects LTM Q 2 2013; Includes 13 acquired stores 17
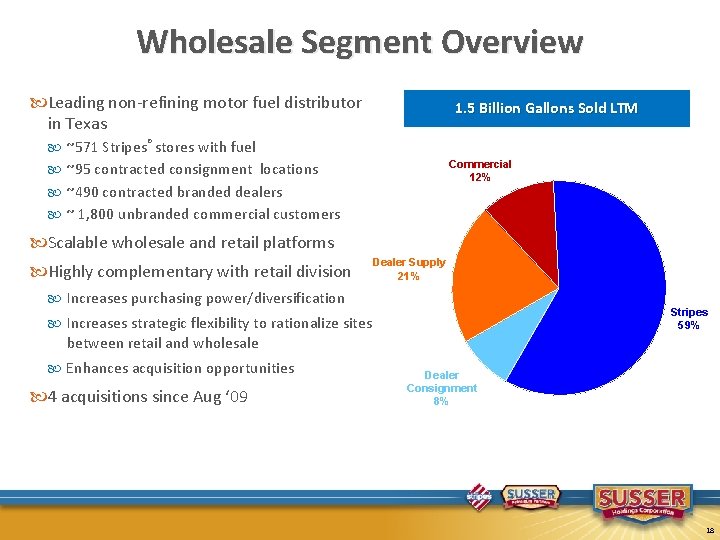
Wholesale Segment Overview Leading non-refining motor fuel distributor in Texas 1. 5 Billion Gallons Sold LTM ~571 Stripes® stores with fuel Commercial 12% ~95 contracted consignment locations ~490 contracted branded dealers ~ 1, 800 unbranded commercial customers Scalable wholesale and retail platforms Highly complementary with retail division Dealer Supply 21% Increases purchasing power/diversification Stripes 59% Increases strategic flexibility to rationalize sites between retail and wholesale Enhances acquisition opportunities 4 acquisitions since Aug ‘ 09 Dealer Consignment 8% 18
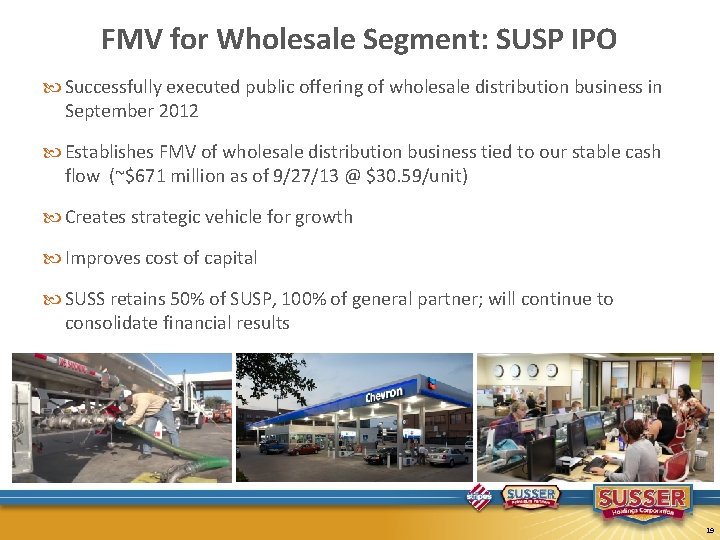
FMV for Wholesale Segment: SUSP IPO Successfully executed public offering of wholesale distribution business in September 2012 Establishes FMV of wholesale distribution business tied to our stable cash flow (~$671 million as of 9/27/13 @ $30. 59/unit) Creates strategic vehicle for growth Improves cost of capital SUSS retains 50% of SUSP, 100% of general partner; will continue to consolidate financial results 19
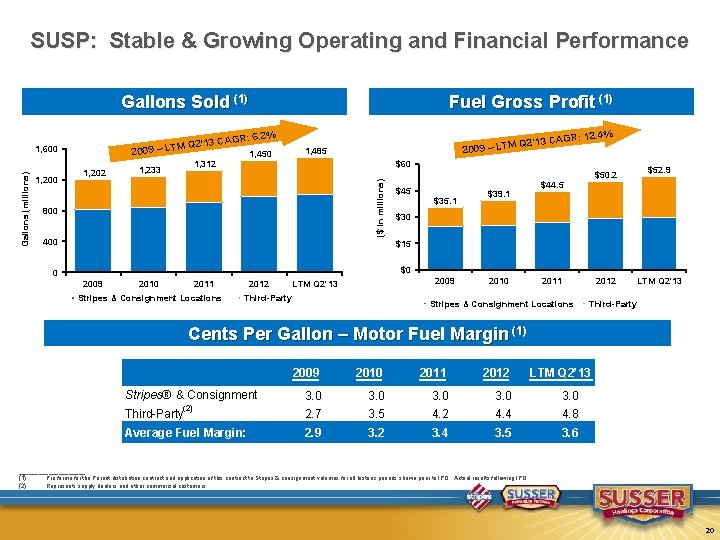
SUSP: Stable & Growing Operating and Financial Performance Gallons Sold (1) M Q 2’ 1 2009 – LT 1, 200 1, 202 3 CAGR: R: 12. 4% Q 2’ 13 CAG M T L – 9 200 6. 2% 1, 450 1, 485 1, 312 1, 233 $60 ($ in millions) Gallons (millions) 1, 600 Fuel Gross Profit (1) 800 400 $45 $35. 1 $39. 1 $52. 9 $50. 2 $44. 5 $30 $15 $0 0 2009 2010 2011 Stripes & Consignment Locations 2012 2009 LTM Q 2'13 Third-Party 2010 2011 Stripes & Consignment Locations 2012 LTM Q 2'13 Third-Party Cents Per Gallon – Motor Fuel Margin (1) Stripes® & Consignment 2009 2010 2011 2012 LTM Q 2’ 13 3. 0 3. 0 (2) Third-Party 2. 7 3. 5 4. 2 4. 4 4. 8 Average Fuel Margin: 2. 9 3. 2 3. 4 3. 5 3. 6 __________ (1) Pro forma for the Parent distribution contract and application of this contract to Stripes & consignment volumes for all historic periods shown prior to IPO. Actual results following IPO. (2) Represents supply dealers and other commercial customers. 20
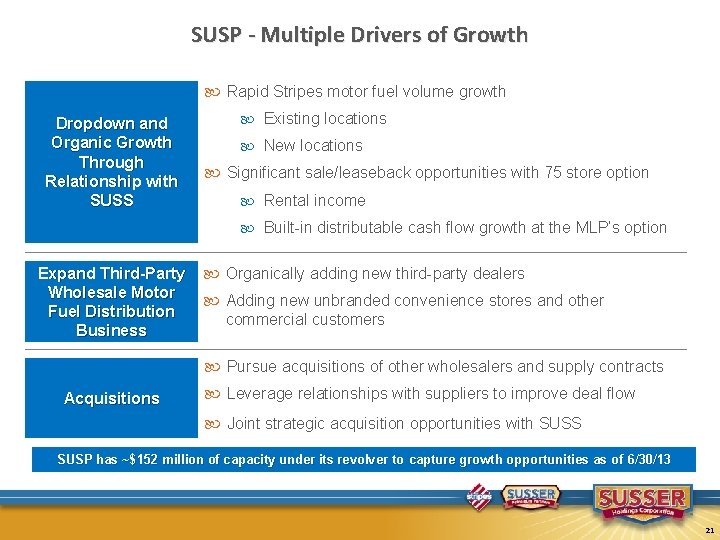
SUSP - Multiple Drivers of Growth Rapid Stripes motor fuel volume growth Dropdown and Organic Growth Through Relationship with SUSS Existing locations New locations Significant sale/leaseback opportunities with 75 store option Rental income Built-in distributable cash flow growth at the MLP’s option Expand Third-Party Wholesale Motor Fuel Distribution Business Organically adding new third-party dealers Adding new unbranded convenience stores and other commercial customers Pursue acquisitions of other wholesalers and supply contracts Acquisitions Leverage relationships with suppliers to improve deal flow Joint strategic acquisition opportunities with SUSS SUSP has ~$152 million of capacity under its revolver to capture growth opportunities as of 6/30/13 21
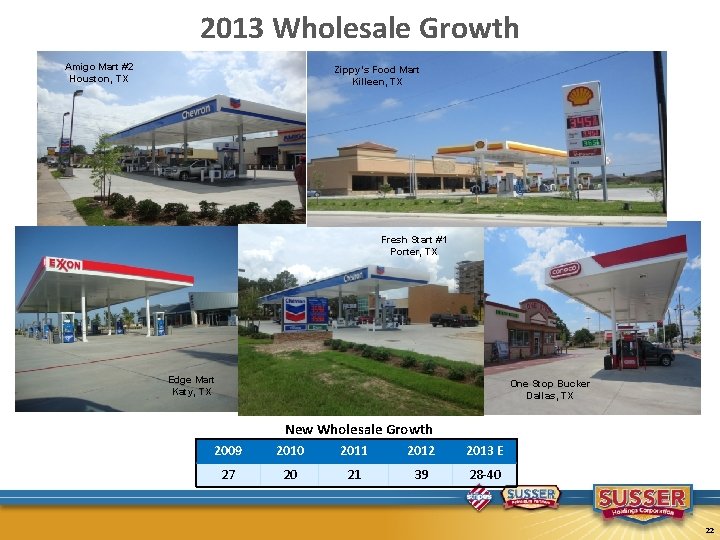
2013 Wholesale Growth Zippy’s Food Mart Killeen, TX Amigo Mart #2 Houston, TX Fresh Start #1 Porter, TX Edge Mart Katy, TX One Stop Bucker Dallas, TX New Wholesale Growth 2009 2010 2011 2012 2013 E 27 20 21 39 28 -40 22
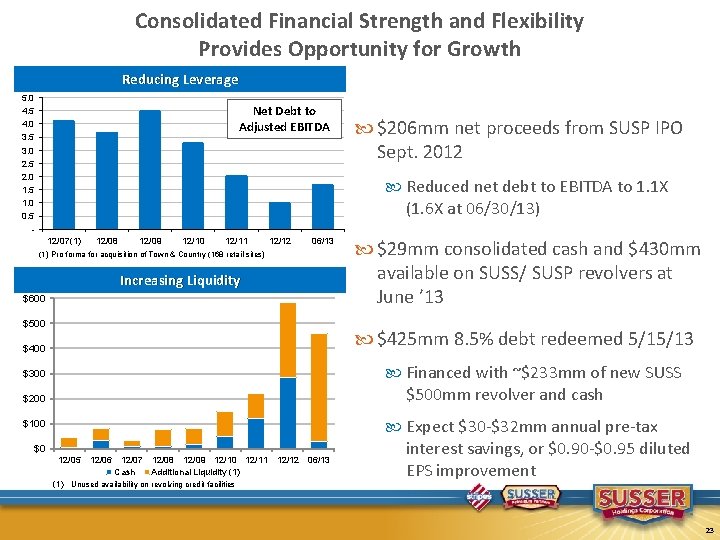
Consolidated Financial Strength and Flexibility Provides Opportunity for Growth Reducing Leverage 5. 0 4. 5 4. 0 3. 5 3. 0 2. 5 2. 0 1. 5 1. 0 0. 5 - Net Debt to Adjusted EBITDA $206 mm net proceeds from SUSP IPO Sept. 2012 Reduced net debt to EBITDA to 1. 1 X (1. 6 X at 06/30/13) 12/07(1) 12/08 12/09 12/10 12/11 12/12 06/13 (1) Pro forma for acquisition of Town & Country (168 retail sites) Increasing Liquidity $600 $500 $29 mm consolidated cash and $430 mm available on SUSS/ SUSP revolvers at June ’ 13 $425 mm 8. 5% debt redeemed 5/15/13 $400 Financed with ~$233 mm of new SUSS $300 $500 mm revolver and cash $200 Expect $30 -$32 mm annual pre-tax $100 $0 12/05 12/06 12/07 12/08 12/09 12/10 12/11 12/12 06/13 Cash Additional Liquidity (1) Unused availability on revolving credit facilities interest savings, or $0. 90 -$0. 95 diluted EPS improvement 23
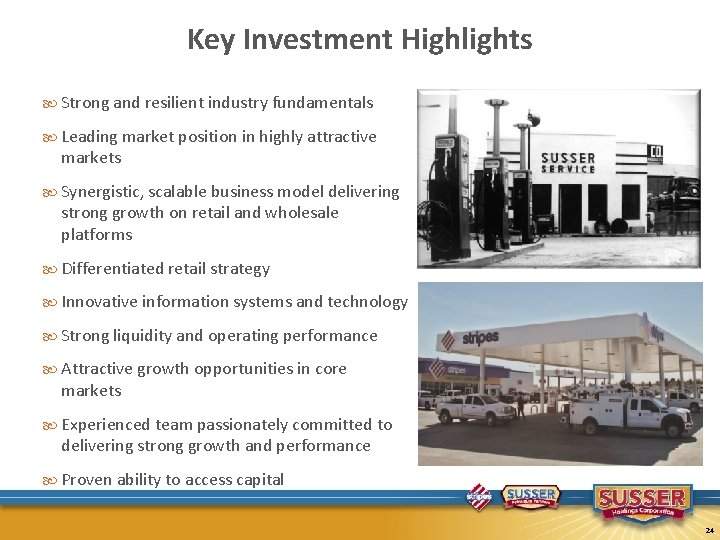
Key Investment Highlights Strong and resilient industry fundamentals Leading market position in highly attractive markets Synergistic, scalable business model delivering strong growth on retail and wholesale platforms Differentiated retail strategy Innovative information systems and technology Strong liquidity and operating performance Attractive growth opportunities in core markets Experienced team passionately committed to delivering strong growth and performance Proven ability to access capital 24
Helping communities grow and thrive for over 75 years… 25
Appendix
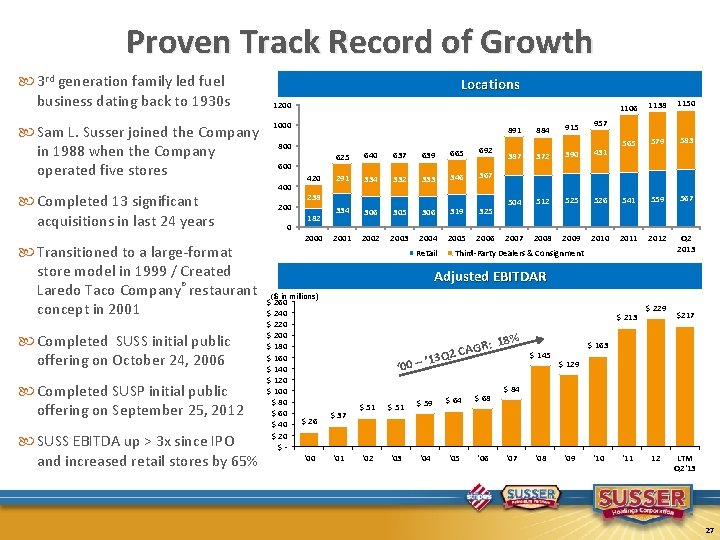
Proven Track Record of Growth 3 rd generation family led fuel business dating back to 1930 s Sam L. Susser joined the Company in 1988 when the Company operated five stores Completed 13 significant acquisitions in last 24 years Transitioned to a large-format store model in 1999 / Created Laredo Taco Company® restaurant concept in 2001 Completed SUSS initial public offering on October 24, 2006 Completed SUSP initial public offering on September 25, 2012 SUSS EBITDA up > 3 x since IPO and increased retail stores by 65% Locations 1200 1000 891 800 600 400 200 0 420 692 625 640 637 639 665 291 334 332 333 346 367 334 306 305 306 319 325 2001 2002 2003 2004 2005 2006 238 182 2000 Retail 884 915 957 1106 1138 1150 565 579 583 387 372 390 431 504 512 525 526 541 559 567 2008 2009 2010 2011 2012 Q 2 2013 Third-Party Dealers & Consignment Adjusted EBITDAR ($ in millions) $ 260 $ 240 $ 220 $ 200 $ 180 $ 160 $ 140 $ 120 $ 100 $ 80 $ 60 $ 40 $ 20 $- $ 213 GR: Q 2 CA 3 0 – ’ 1 ‘ 0 $ 26 '00 $ 37 '01 $ 51 $ 59 $ 64 '02 '03 '04 '05 $ 68 '06 18% $ 145 $ 229 $217 $ 163 $ 129 $ 84 '07 '08 '09 '10 '11 12 LTM Q 2'13 27
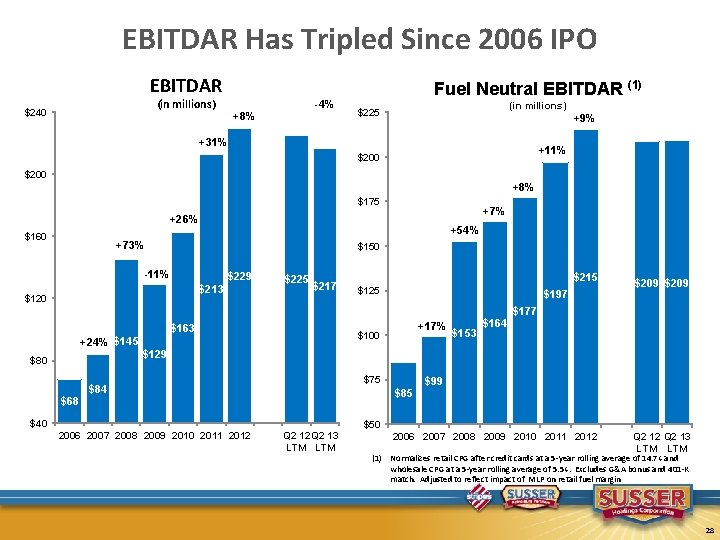
EBITDAR Has Tripled Since 2006 IPO EBITDAR (in millions) $240 -4% +8% Fuel Neutral EBITDAR (1) (in millions) $225 +9% +31% +11% $200 +8% $175 +7% +26% $160 +54% +73% $150 -11% $229 $213 $120 $225 $217 $163 +24% $145 $80 $215 $125 $197 +17% $100 $153 $164 $209 $177 $129 $75 $84 $68 $40 2006 2007 2008 2009 2010 2011 2012 $99 $85 Q 2 12 Q 2 13 LTM $50 2006 2007 2008 2009 2010 2011 2012 Q 2 13 LTM (1) Normalizes retail CPG after credit cards at a 5 -year rolling average of 14. 7¢ and wholesale CPG at a 5 -year rolling average of 5. 5¢. Excludes G&A bonus and 401 -K match. Adjusted to reflect impact of MLP on retail fuel margin 28
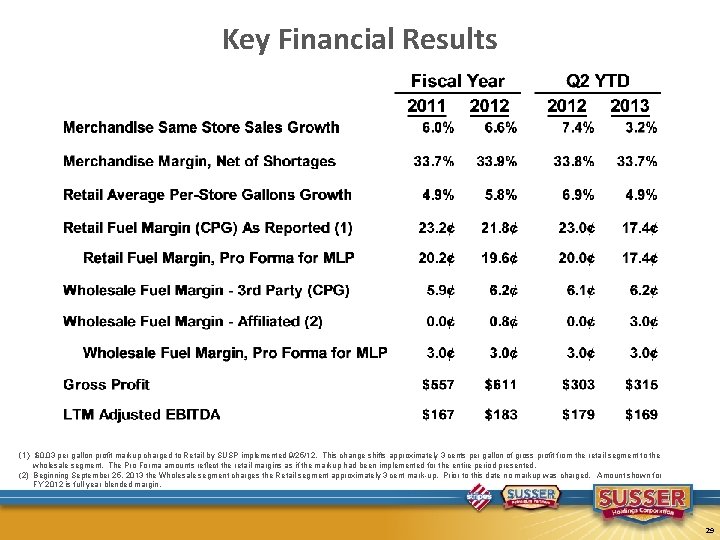
Key Financial Results (1) $0. 03 per gallon profit markup charged to Retail by SUSP implemented 9/25/12. This change shifts approximately 3 cents per gallon of gross profit from the retail segment to the wholesale segment. The Pro Forma amounts reflect the retail margins as if the markup had been implemented for the entire period presented. (2) Beginning September 25, 2013 the Wholesale segment charges the Retail segment approximately 3 cent mark-up. Prior to this date no markup was charged. Amount shown for FY 2012 is full year blended margin. 29
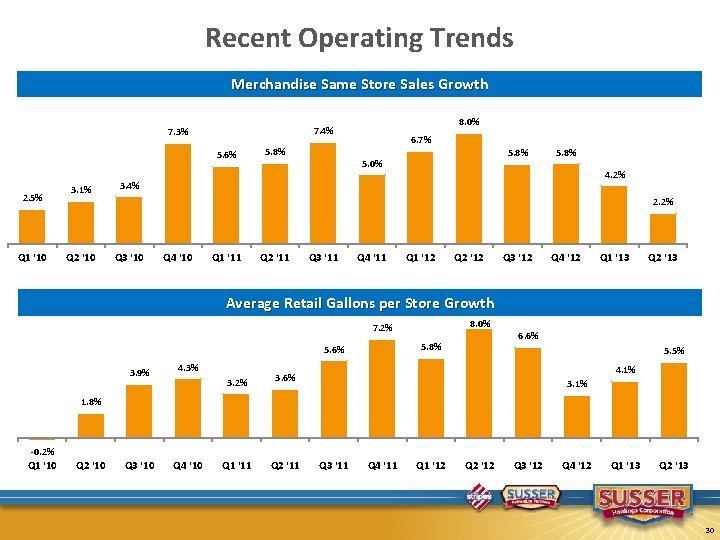
Recent Operating Trends Merchandise Same Store Sales Growth 5. 6% 2. 5% Q 1 '10 3. 1% 8. 0% 7. 4% 7. 3% 5. 8% 6. 7% 5. 8% 5. 0% 5. 8% 4. 2% 3. 4% 2. 2% Q 2 '10 Q 3 '10 Q 4 '10 Q 1 '11 Q 2 '11 Q 3 '11 Q 4 '11 Q 1 '12 Q 2 '12 Q 3 '12 Q 4 '12 Q 1 '13 Q 2 '13 Average Retail Gallons per Store Growth 8. 0% 7. 2% 5. 6% 3. 9% 4. 3% 3. 2% 3. 6% Q 1 '11 Q 2 '11 6. 6% 5. 8% 5. 5% 4. 1% 3. 1% 1. 8% -0. 2% Q 1 '10 Q 2 '10 Q 3 '10 Q 4 '10 Q 3 '11 Q 4 '11 Q 1 '12 Q 2 '12 Q 3 '12 Q 4 '12 Q 1 '13 Q 2 '13 30
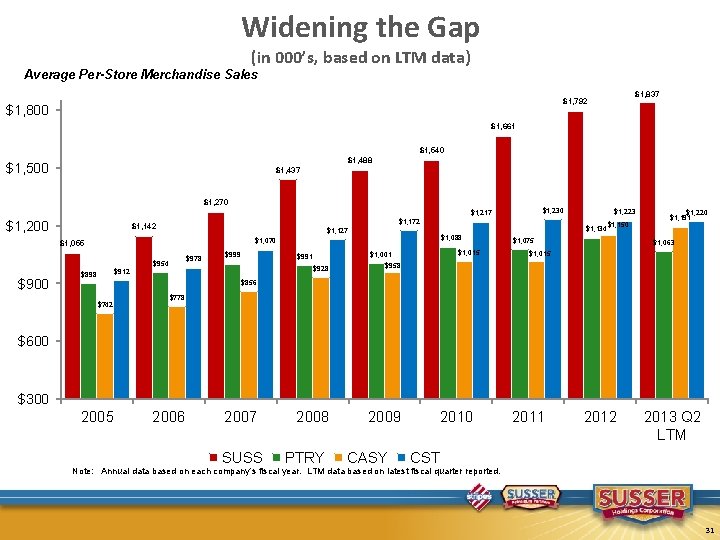
Widening the Gap (in 000’s, based on LTM data) Average Per-Store Merchandise Sales $1, 837 $1, 792 $1, 800 $1, 661 $1, 540 $1, 488 $1, 500 $1, 437 $1, 270 $1, 230 $1, 217 $1, 200 $1, 172 $1, 142 $1, 127 $1, 055 $978 $954 $900 $999 $912 $898 $1, 015 $1, 001 $991 $1, 134 $1, 088 $1, 070 $928 $958 2009 $1, 223 $1, 150 $1, 075 $1, 220 $1, 191 $1, 063 $1, 015 $856 $742 $778 $600 $300 2005 2006 2007 SUSS PTRY CASY 2010 2011 2012 2013 Q 2 LTM CST Note: Annual data based on each company’s fiscal year. LTM data based on latest fiscal quarter reported. 31
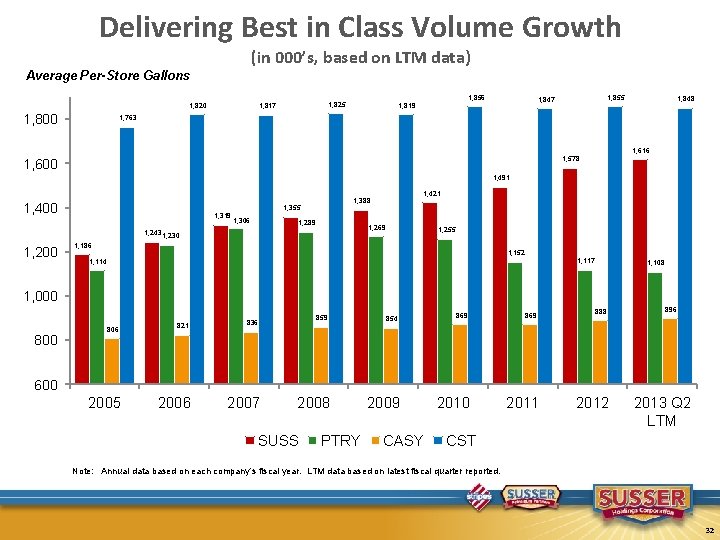
Delivering Best in Class Volume Growth (in 000’s, based on LTM data) Average Per-Store Gallons 1, 820 1, 800 1, 856 1, 825 1, 817 1, 855 1, 847 1, 819 1, 848 1, 763 1, 616 1, 578 1, 600 1, 491 1, 400 1, 388 1, 355 1, 319 1, 306 1, 289 1, 269 1, 243 1, 230 1, 200 1, 421 1, 255 1, 186 1, 152 1, 117 1, 114 1, 108 1, 000 806 821 859 836 854 869 888 896 600 2005 2006 2007 2008 SUSS PTRY 2009 CASY 2010 2011 2012 2013 Q 2 LTM CST Note: Annual data based on each company’s fiscal year. LTM data based on latest fiscal quarter reported. 32
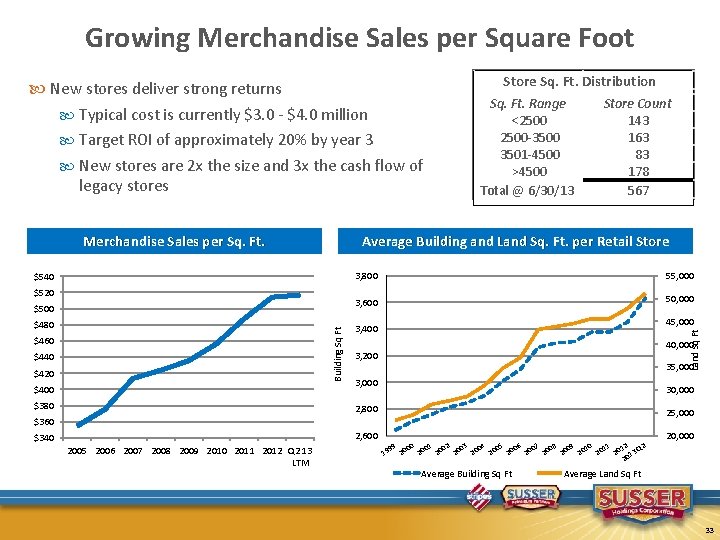
Growing Merchandise Sales per Square Foot Store Sq. Ft. Distribution New stores deliver strong returns Typical cost is currently $3. 0 - $4. 0 million Target ROI of approximately 20% by year 3 New stores are 2 x the size and 3 x the cash flow of legacy stores Average Building and Land Sq. Ft. per Retail Store $540 $520 $500 Building Sq Ft $480 $460 $440 $420 $400 $380 Store Count 143 163 83 178 567 3, 800 55, 000 3, 600 50, 000 45, 000 3, 400 Land Sq Ft Merchandise Sales per Sq. Ft. Range <2500 -3500 3501 -4500 >4500 Total @ 6/30/13 40, 000 3, 200 35, 000 30, 000 2, 800 25, 000 $360 2, 600 $340 2005 2006 2007 2008 2009 2010 2011 2012 Q 2 13 LTM 99 00 01 02 03 04 05 06 07 08 09 10 11 12 Q 2 19 20 20 20 20 013 2 Average Building Sq Ft 20, 000 Average Land Sq Ft 33
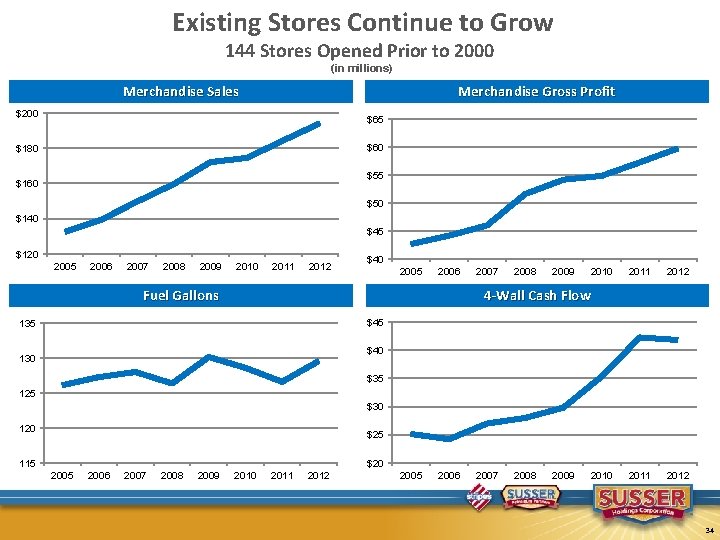
Existing Stores Continue to Grow 144 Stores Opened Prior to 2000 (in millions) Merchandise Sales Merchandise Gross Profit $200 $65 $60 $180 $55 $160 $50 $140 $45 $120 2005 2006 2007 2008 2009 2010 2011 2012 $40 2005 2006 Fuel Gallons 2007 2008 2009 2010 2011 2012 4 -Wall Cash Flow $45 135 $40 130 $35 125 $30 120 $25 115 $20 2005 2006 2007 2008 2009 2010 2011 2012 2005 2006 2007 2008 2009 2010 34
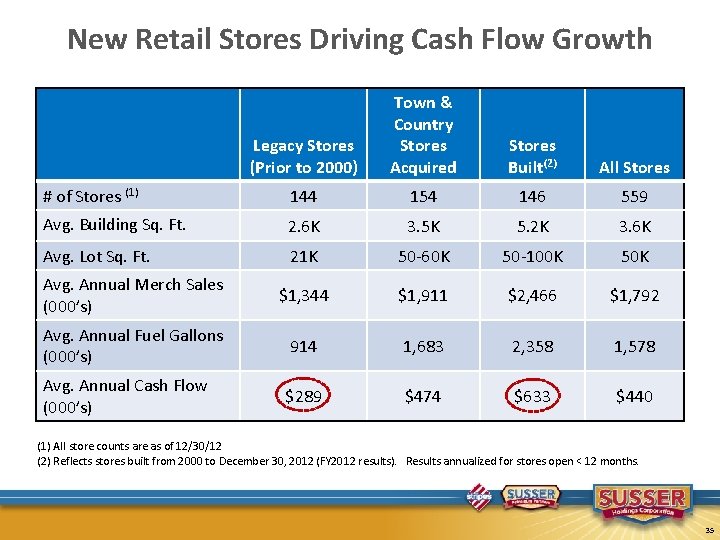
New Retail Stores Driving Cash Flow Growth Legacy Stores (Prior to 2000) Town & Country Stores Acquired Stores Built(2) All Stores # of Stores (1) 144 154 146 559 Avg. Building Sq. Ft. 2. 6 K 3. 5 K 5. 2 K 3. 6 K Avg. Lot Sq. Ft. 21 K 50 -60 K 50 -100 K 50 K Avg. Annual Merch Sales (000’s) $1, 344 $1, 911 $2, 466 $1, 792 Avg. Annual Fuel Gallons (000’s) 914 1, 683 2, 358 1, 578 Avg. Annual Cash Flow (000’s) $289 $474 $633 $440 (1) All store counts are as of 12/30/12 (2) Reflects stores built from 2000 to December 30, 2012 (FY 2012 results). Results annualized for stores open < 12 months. 35
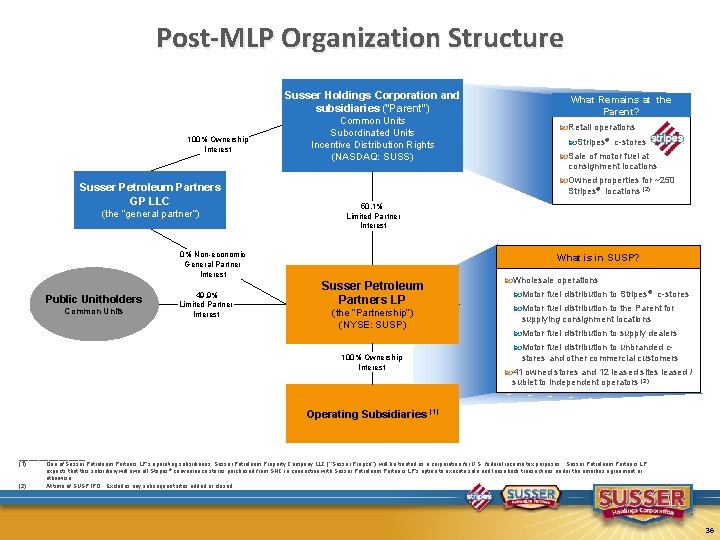
Post-MLP Organization Structure Susser Holdings Corporation and subsidiaries (“Parent”) 100% Ownership Interest Susser Petroleum Partners GP LLC (the “general partner”) Common Units Subordinated Units Incentive Distribution Rights (NASDAQ: SUSS) Common Units 49. 9% Limited Partner Interest Retail operations Stripes® c-stores Sale of motor fuel at consignment locations Owned properties for ~250 Stripes® locations (2) 50. 1% Limited Partner Interest 0% Non-economic General Partner Interest Public Unitholders What Remains at the Parent? What is in SUSP? Susser Petroleum Partners LP (the “Partnership”) (NYSE: SUSP) 100% Ownership Interest Wholesale operations Motor fuel distribution to Stripes® c-stores Motor fuel distribution to the Parent for supplying consignment locations Motor fuel distribution to supply dealers Motor fuel distribution to unbranded cstores and other commercial customers 41 owned stores and 12 leased sites leased / sublet to independent operators (2) Operating Subsidiaries (1) __________ (1) One of Susser Petroleum Partners LP’s operating subsidiaries, Susser Petroleum Property Company LLC (‘‘Susser Propco’’), will be treated as a corporation for U. S. federal income tax purposes. Susser Petroleum Partners LP expects that this subsidiary will own all Stripes ® convenience stores purchased from SHC in connection with Susser Petroleum Partners LP’s option to execute sale and leaseback transactions under the omnibus agreement or otherwise. (2) At time of SUSP IPO. Excludes any subsequent sites added or closed. 36
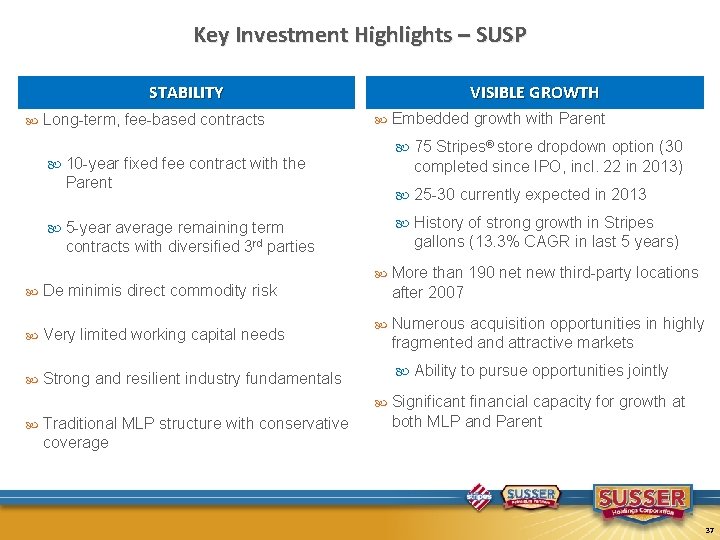
Key Investment Highlights – SUSP STABILITY Long-term, fee-based contracts VISIBLE GROWTH 75 Stripes® store dropdown option (30 10 -year fixed fee contract with the completed since IPO, incl. 22 in 2013) Parent 25 -30 currently expected in 2013 History of strong growth in Stripes 5 -year average remaining term gallons (13. 3% CAGR in last 5 years) contracts with diversified 3 rd parties De minimis direct commodity risk Very limited working capital needs Strong and resilient industry fundamentals More than 190 net new third-party locations after 2007 Numerous acquisition opportunities in highly fragmented and attractive markets Ability to pursue opportunities jointly Traditional MLP structure with conservative coverage Embedded growth with Parent Significant financial capacity for growth at both MLP and Parent 37
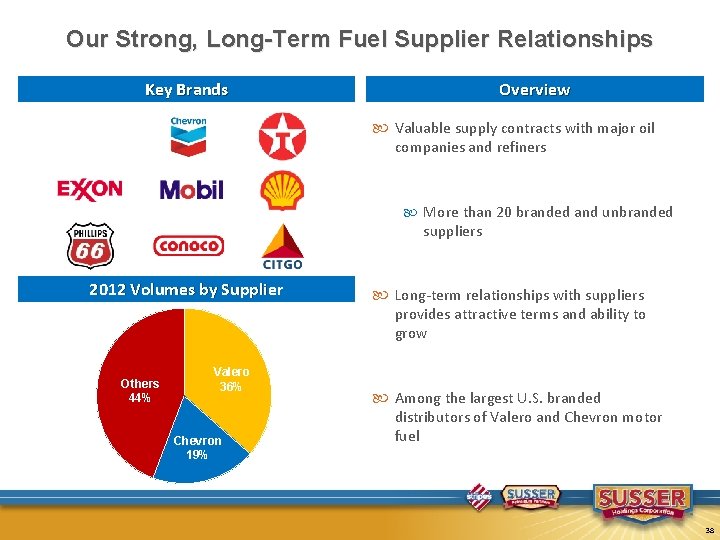
Our Strong, Long-Term Fuel Supplier Relationships Key Brands Overview Valuable supply contracts with major oil companies and refiners More than 20 branded and unbranded suppliers 2012 Volumes by Supplier Others 44% Valero 36% Chevron 19% Long-term relationships with suppliers provides attractive terms and ability to grow Among the largest U. S. branded distributors of Valero and Chevron motor fuel 38
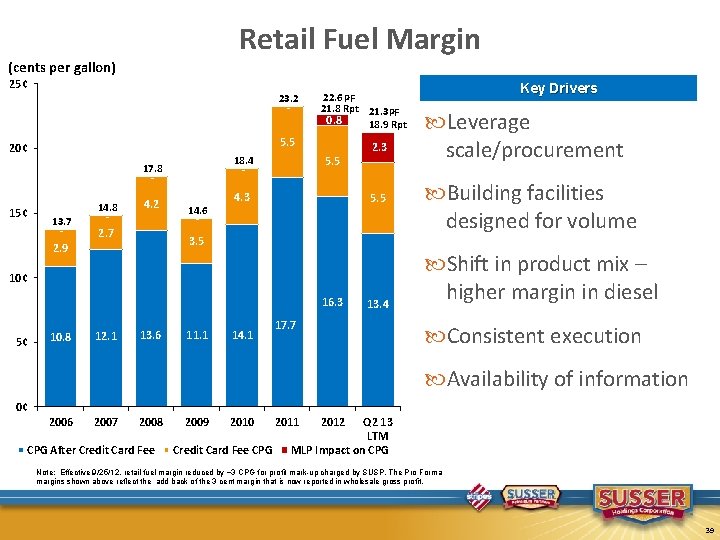
Retail Fuel Margin (cents per gallon) 25¢ 23. 2 - 5. 5 20¢ - - 14. 8 13. 7 - 2. 7 4. 2 5. 5 18. 4 17. 8 15¢ 22. 6 PF 21. 8 Rpt 21. 3 PF 0. 8 18. 9 Rpt 14. 6 4. 3 2. 3 5. 5 - 3. 5 2. 9 10¢ 16. 3 5¢ 10. 8 12. 1 13. 6 11. 1 14. 1 13. 4 17. 7 Key Drivers Leverage scale/procurement Building facilities designed for volume Shift in product mix – higher margin in diesel Consistent execution Availability of information 0¢ 2006 2007 2008 CPG After Credit Card Fee 2009 2010 Credit Card Fee CPG 2011 2012 Q 2 13 LTM MLP Impact on CPG Note: Effective 9/25/12, retail fuel margin reduced by ~3 CPG for profit mark-up charged by SUSP. The Pro Forma margins shown above reflect the add back of the 3 cent margin that is now reported in wholesale gross profit. 39
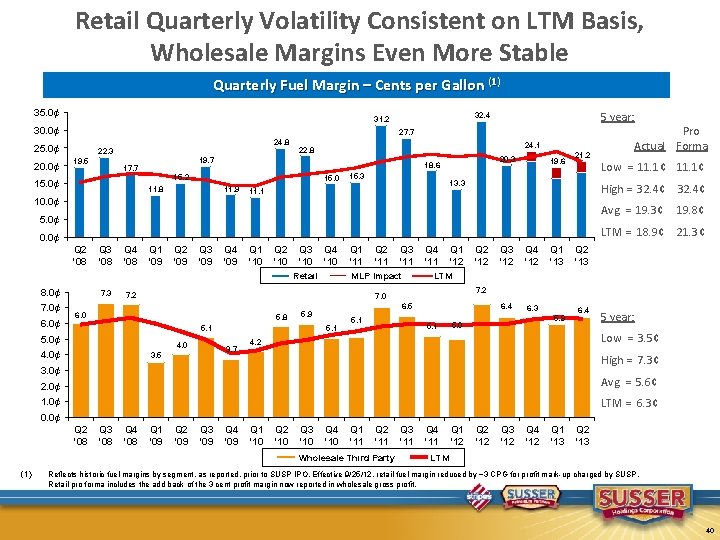
Retail Quarterly Volatility Consistent on LTM Basis, Wholesale Margins Even More Stable Quarterly Fuel Margin – Cents per Gallon (1) 35. 0¢ 30. 0¢ 27. 7 25. 0¢ 20. 0¢ 32. 4 31. 2 24. 8 22. 3 19. 5 19. 7 17. 7 15. 0¢ 24. 1 22. 8 15. 2 15. 0 11. 9 11. 8 20. 3 18. 6 15. 3 19. 6 21. 2 13. 3 11. 1 Avg = 19. 3¢ 19. 8¢ 5. 0¢ LTM = 18. 9¢ 21. 3¢ 0. 0¢ Q 2 '08 Q 3 '08 Q 4 '08 Q 1 '09 Q 2 '09 Q 3 '09 Q 4 '09 Q 1 '10 Q 2 '10 Q 3 '10 Q 4 '10 Retail 8. 0¢ 6. 0¢ Low = 11. 1¢ High = 32. 4¢ 10. 0¢ 7. 0¢ 5 year: Pro Actual Forma 7. 3 Q 1 '11 Q 3 '11 MLP Impact 7. 2 Q 4 '11 Q 1 '12 5. 8 5. 1 5. 0¢ 4. 0 3. 7 3. 5 Q 3 '12 Q 4 '12 6. 4 6. 3 Q 1 '13 Q 2 '13 7. 2 6. 5 5. 9 5. 1 Q 2 '12 LTM 7. 0 6. 0 4. 0¢ Q 2 '11 5. 9 5. 0 6. 4 5 year: Low = 3. 5¢ 4. 2 High = 7. 3¢ 3. 0¢ 2. 0¢ Avg = 5. 6¢ 1. 0¢ LTM = 6. 3¢ 0. 0¢ Q 2 '08 Q 3 '08 Q 4 '08 Q 1 '09 Q 2 '09 Q 3 '09 Q 4 '09 Q 1 '10 Q 2 '10 Q 3 '10 Q 4 '10 Q 1 '11 Q 2 '11 Wholesale Third Party (1) Q 3 '11 Q 4 '11 Q 1 '12 Q 2 '12 Q 3 '12 Q 4 '12 Q 1 '13 Q 2 '13 LTM Reflects historic fuel margins by segment, as reported, prior to SUSP IPO. Effective 9/25/12, retail fuel margin reduced by ~3 CPG for profit mark-up charged by SUSP. Retail pro forma includes the add back of the 3 cent profit margin now reported in wholesale gross profit. 40
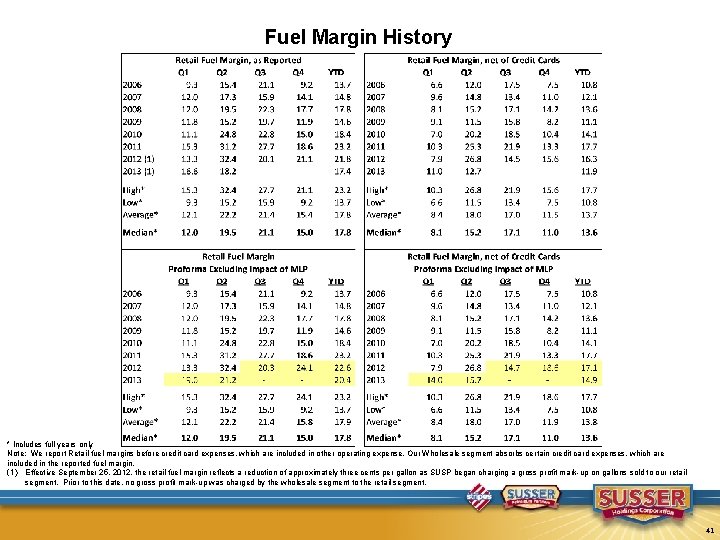
Fuel Margin History * Includes full years only Note: We report Retail fuel margins before credit card expenses, which are included in other operating expense. Our Wholesale segment absorbs certain credit card expenses, which are included in the reported fuel margin. (1) Effective September 25, 2012, the retail fuel margin reflects a reduction of approximately three cents per gallon as SUSP began charging a gross profit mark-up on gallons sold to our retail segment. Prior to this date, no gross profit mark-up was charged by the wholesale segment to the retail segment. 41
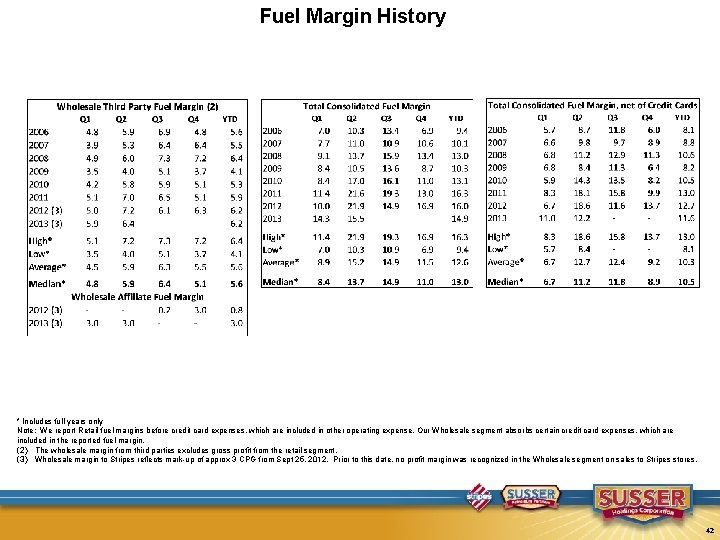
Fuel Margin History * Includes full years only Note: We report Retail fuel margins before credit card expenses, which are included in other operating expense. Our Wholesale segment absorbs certain credit card expenses, which are included in the reported fuel margin. (2) The wholesale margin from third parties excludes gross profit from the retail segment. (3) Wholesale margin to Stripes reflects mark-up of approx 3 CPG from Sept 25, 2012. Prior to this date, no profit margin was recognized in the Wholesale segment on sales to Stripes stores. 42
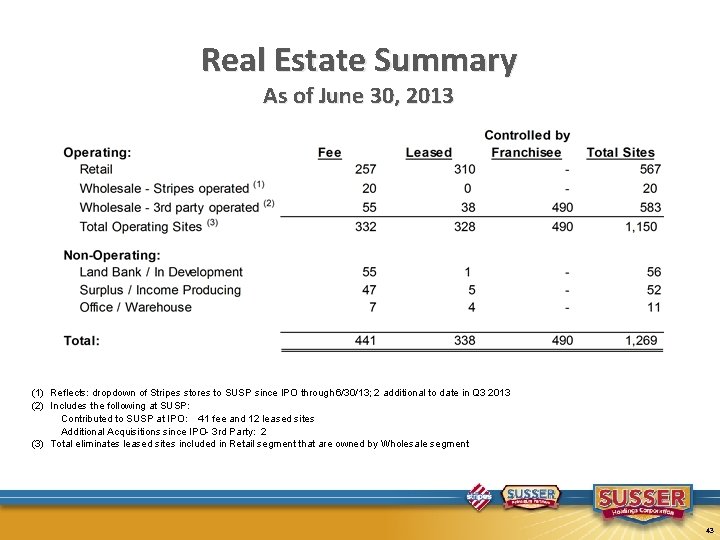
Real Estate Summary As of June 30, 2013 (1) Reflects: dropdown of Stripes stores to SUSP since IPO through 6/30/13; 2 additional to date in Q 3 2013 (2) Includes the following at SUSP: Contributed to SUSP at IPO: 41 fee and 12 leased sites Additional Acquisitions since IPO- 3 rd Party: 2 (3) Total eliminates leased sites included in Retail segment that are owned by Wholesale segment 43
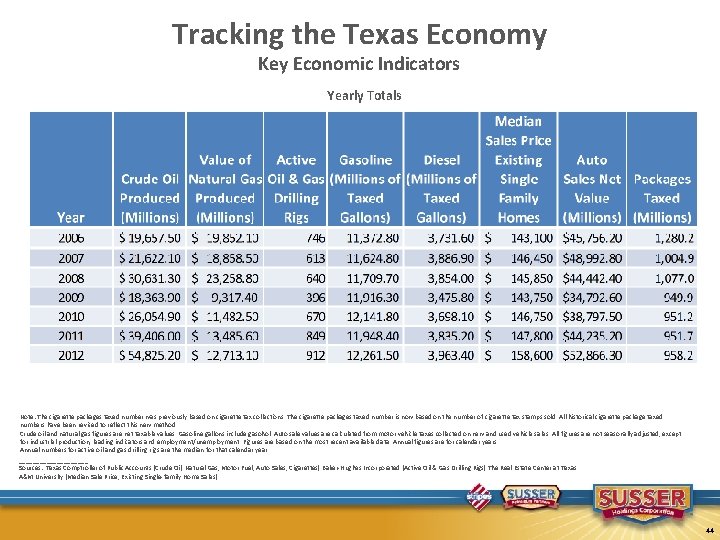
Tracking the Texas Economy Key Economic Indicators Yearly Totals Note: The cigarette packages taxed number was previously based on cigarette tax collections. The cigarette packages taxed number is now based on the number of cigarette tax stamps sold. All historical cigarette package taxed numbers have been revised to reflect this new method. Crude oil and natural gas figures are net taxable values. Gasoline gallons include gasohol. Auto sale values are calculated from motor vehicle taxes collected on new and used vehicle sales. All figures are not seasonally adjusted, except for industrial production, leading indicators and employment/unemployment. Figures are based on the most recent available data. Annual figures are for calendar years. Annual numbers for active oil and gas drilling rigs are the median for that calendar year. __________ Sources: Texas Comptroller of Public Accounts (Crude Oil, Natural Gas, Motor Fuel, Auto Sales, Cigarettes) Baker-Hughes Incorporated (Active Oil & Gas Drilling Rigs) The Real Estate Center at Texas A&M University (Median Sale Price, Existing Single-family Home Sales) 44
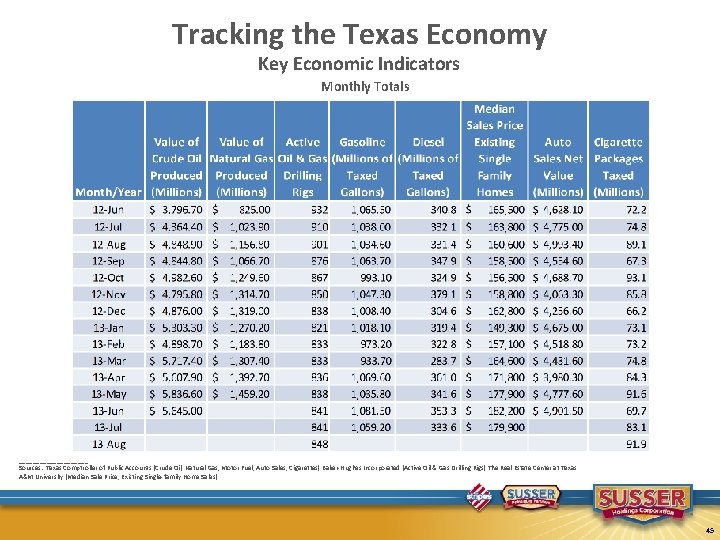
Tracking the Texas Economy Key Economic Indicators Monthly Totals __________ Sources: Texas Comptroller of Public Accounts (Crude Oil, Natural Gas, Motor Fuel, Auto Sales, Cigarettes) Baker-Hughes Incorporated (Active Oil & Gas Drilling Rigs) The Real Estate Center at Texas A&M University (Median Sale Price, Existing Single-family Home Sales) 45
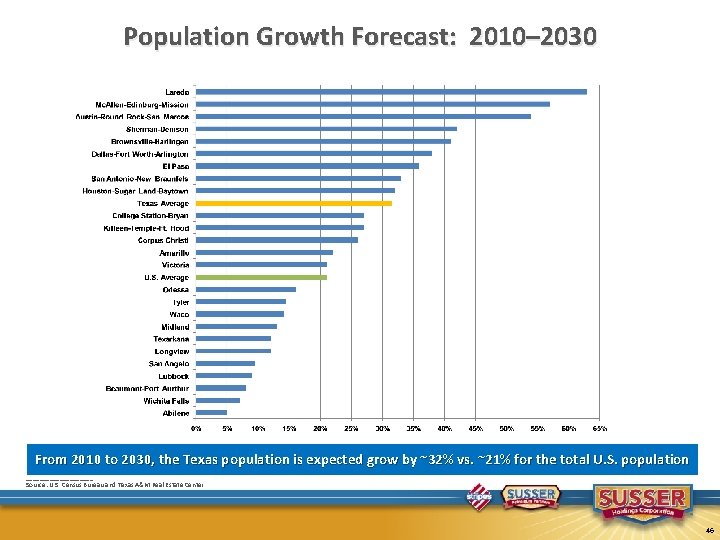
Population Growth Forecast: 2010– 2030 From 2010 to 2030, the Texas population is expected grow by ~32% vs. ~21% for the total U. S. population __________ Source: U. S. Census Bureau and Texas A&M Real Estate Center. 46
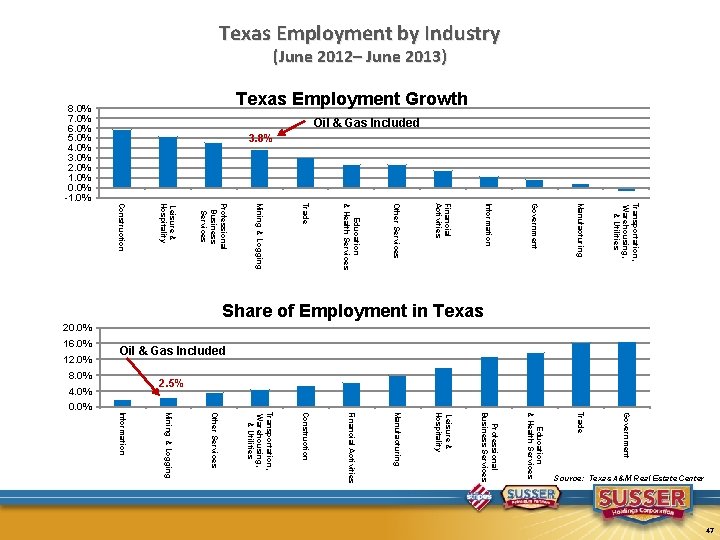
Texas Employment by Industry (June 2012– June 2013) Education & Health Services Mining & Logging Other Services Transportation, Warehousing, & Utilities Construction Financial Activities Manufacturing Leisure & Hospitality Government Source: Texas A&M Real Estate Center Professional Business Services Financial Activities Other Services Education & Health Services Trade Mining & Logging 4. 0% Professional Business Services 8. 0% Leisure & Hospitality Information 0. 0% Construction 12. 0% Information Government 2. 5% Transportation, Warehousing, & Utilities Share of Employment in Texas Trade 20. 0% Manufacturing Oil & Gas Included 16. 0% Texas Employment Growth Oil & Gas Included 3. 8% 8. 0% 7. 0% 6. 0% 5. 0% 4. 0% 3. 0% 2. 0% 1. 0% 0. 0% -1. 0% 47
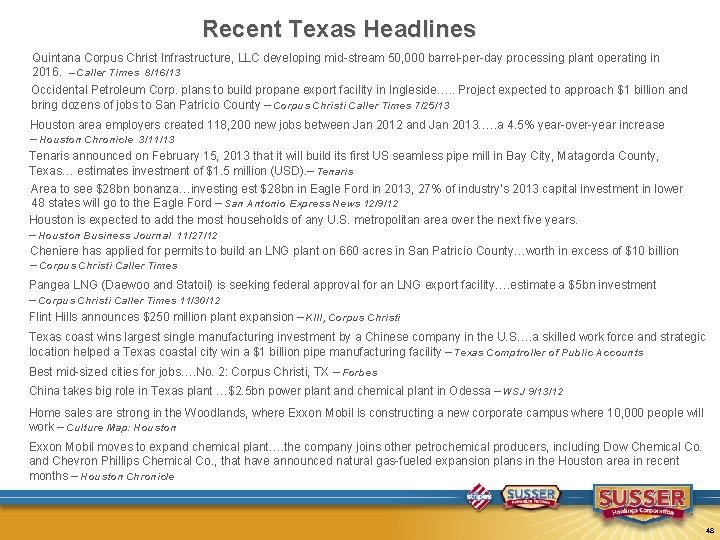
Recent Texas Headlines Quintana Corpus Christ Infrastructure, LLC developing mid-stream 50, 000 barrel-per-day processing plant operating in 2016. – Caller Times 8/16/13 Occidental Petroleum Corp. plans to build propane export facility in Ingleside…. . Project expected to approach $1 billion and bring dozens of jobs to San Patricio County – Corpus Christi Caller Times 7/25/13 Houston area employers created 118, 200 new jobs between Jan 2012 and Jan 2013…. . a 4. 5% year-over-year increase – Houston Chronicle 3/11/13 Tenaris announced on February 15, 2013 that it will build its first US seamless pipe mill in Bay City, Matagorda County, Texas… estimates investment of $1. 5 million (USD). – Tenaris Area to see $28 bn bonanza…investing est $28 bn in Eagle Ford in 2013, 27% of industry’s 2013 capital investment in lower 48 states will go to the Eagle Ford – San Antonio Express News 12/9/12 Houston is expected to add the most households of any U. S. metropolitan area over the next five years. – Houston Business Journal 11/27/12 Cheniere has applied for permits to build an LNG plant on 660 acres in San Patricio County…worth in excess of $10 billion – Corpus Christi Caller Times Pangea LNG (Daewoo and Statoil) is seeking federal approval for an LNG export facility…. estimate a $5 bn investment – Corpus Christi Caller Times 11/30/12 Flint Hills announces $250 million plant expansion – KIII, Corpus Christi Texas coast wins largest single manufacturing investment by a Chinese company in the U. S…. a skilled work force and strategic location helped a Texas coastal city win a $1 billion pipe manufacturing facility – Texas Comptroller of Public Accounts Best mid-sized cities for jobs…. No. 2: Corpus Christi, TX – Forbes China takes big role in Texas plant …$2. 5 bn power plant and chemical plant in Odessa – WSJ 9/13/12 Home sales are strong in the Woodlands, where Exxon Mobil is constructing a new corporate campus where 10, 000 people will work – Culture Map: Houston Exxon Mobil moves to expand chemical plant…. the company joins other petrochemical producers, including Dow Chemical Co. and Chevron Phillips Chemical Co. , that have announced natural gas-fueled expansion plans in the Houston area in recent months – Houston Chronicle 48
Partial List of Sources for Economic Data http: //www. window. state. tx. us/ http: //www. texasahead. org/economy/tracking/ http: //www. dallasfed. org/ http: //texaseconomicdevelopmentguide. com/ http: //recenter. tamu. edu/ http: //texascenter. tamiu. edu/ http: //www. ccredc. com/ http: //www. mcallenedc. org/ http: //www. ldfonline. org/ http: //www. midlandtxedc. com/ http: //www. houston. org/ http: //www. mywesttexas. com/business/ 49
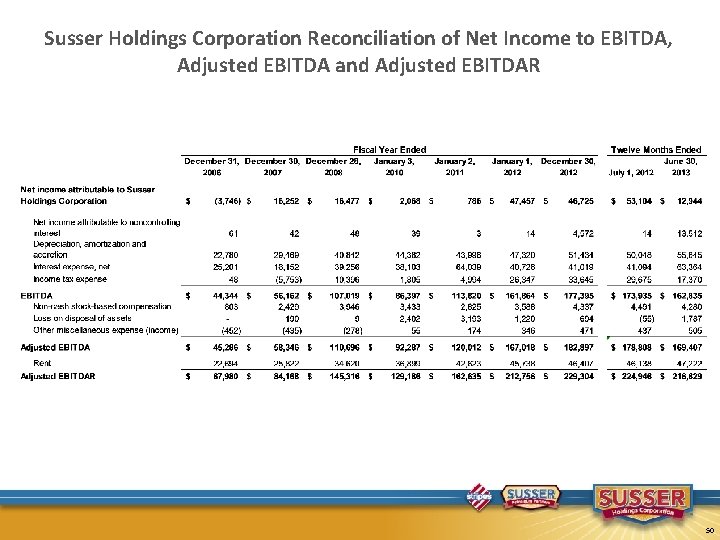
Susser Holdings Corporation Reconciliation of Net Income to EBITDA, Adjusted EBITDA and Adjusted EBITDAR 50
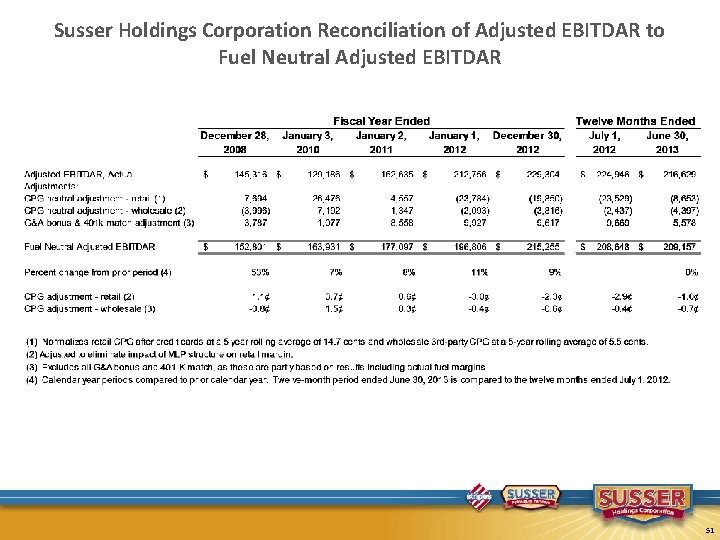
Susser Holdings Corporation Reconciliation of Adjusted EBITDAR to Fuel Neutral Adjusted EBITDAR 51
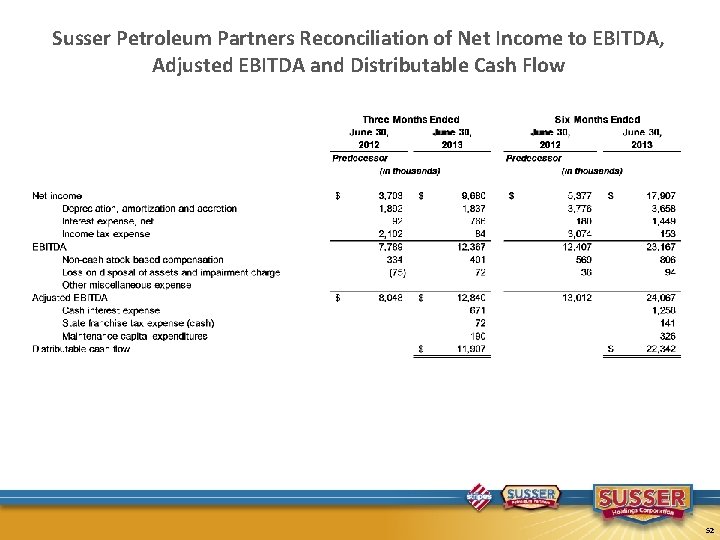
Susser Petroleum Partners Reconciliation of Net Income to EBITDA, Adjusted EBITDA and Distributable Cash Flow 52
- Slides: 52