
Suspension Bridges A study of the Brooklyn Bridge
Suspension Bridges A study of the Brooklyn Bridge
Background • This activity would be appropriate for student at the 10 th grade level • The activity would proceed as follows: 1. Find out background about the Brooklyn Bridge/Suspension bridges in general 2. Discuss the parabolic shape of the main cable of suspension bridges 3. Use dynamic technology to “eyeball” a parabola that resembles the main cable of the Brooklyn Bridge (TI-n. SPIRE) 4. Research the dimensions of the Brooklyn Bridge 5. Determine the equation of the parabola for the main cable of the bridge using TI-n. SPIRE 6. Determine the cost of the cable using the equation
1. Facts about suspension bridges • Suspension bridges are able to achieve longer spans than many other types of bridges • They can be cheaper to build than other types of bridges • In the NYC area, there are several suspension bridges, including the Brooklyn Bridge, Manhattan Bridge, Verrazano Bridge, George Washington Bridge, and others. Source: http: //en. wikipedia. org/wiki/Suspension_bridge
2. The main cable of a suspension bridge is in the shape of a parabola. • If a string (or cable) is suspended the shape formed is called a “catenary. ” • When the suspended cable is secured to the span of the bridge, it takes on a parabolic shape. Source: http: //www. carondelet. pvt. k 12. ca. us/Family/Math/ 03210/page 5. htm
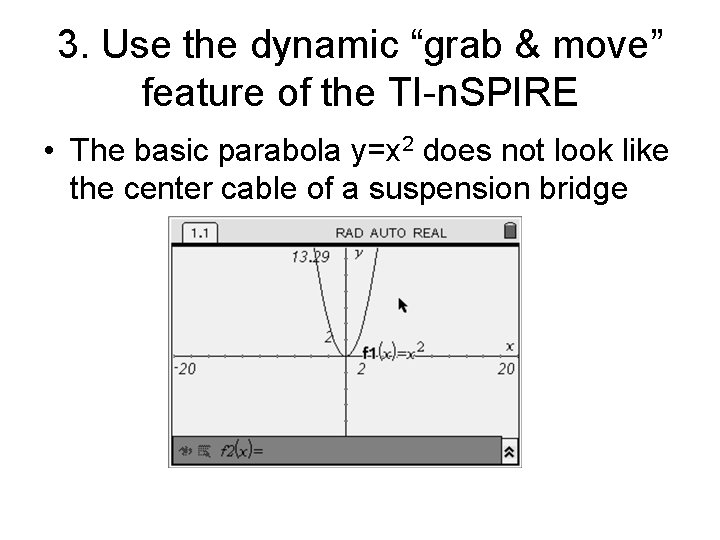
3. Use the dynamic “grab & move” feature of the TI-n. SPIRE • The basic parabola y=x 2 does not look like the center cable of a suspension bridge
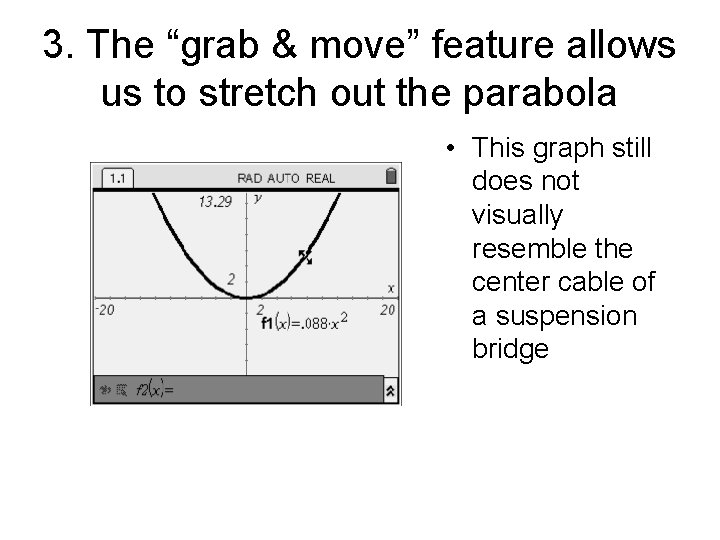
3. The “grab & move” feature allows us to stretch out the parabola • This graph still does not visually resemble the center cable of a suspension bridge

These graphs look more as we expect a suspension bridge to appear.
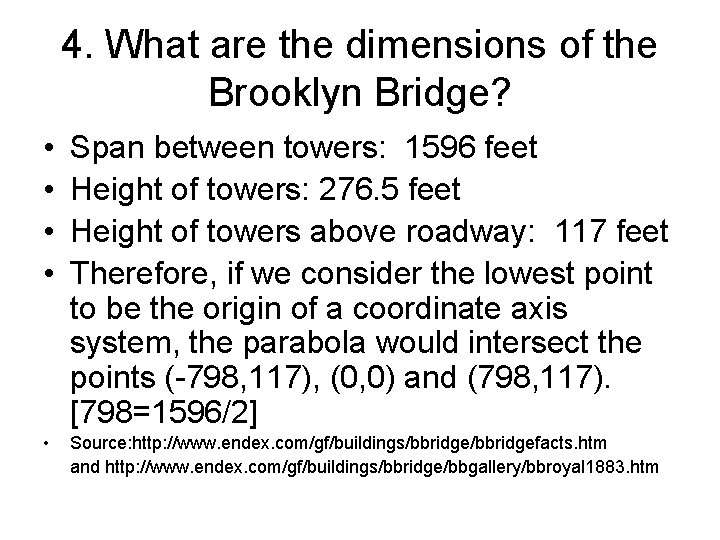
4. What are the dimensions of the Brooklyn Bridge? • • Span between towers: 1596 feet Height of towers: 276. 5 feet Height of towers above roadway: 117 feet Therefore, if we consider the lowest point to be the origin of a coordinate axis system, the parabola would intersect the points (-798, 117), (0, 0) and (798, 117). [798=1596/2] • Source: http: //www. endex. com/gf/buildings/bbridgefacts. htm and http: //www. endex. com/gf/buildings/bbridge/bbgallery/bbroyal 1883. htm
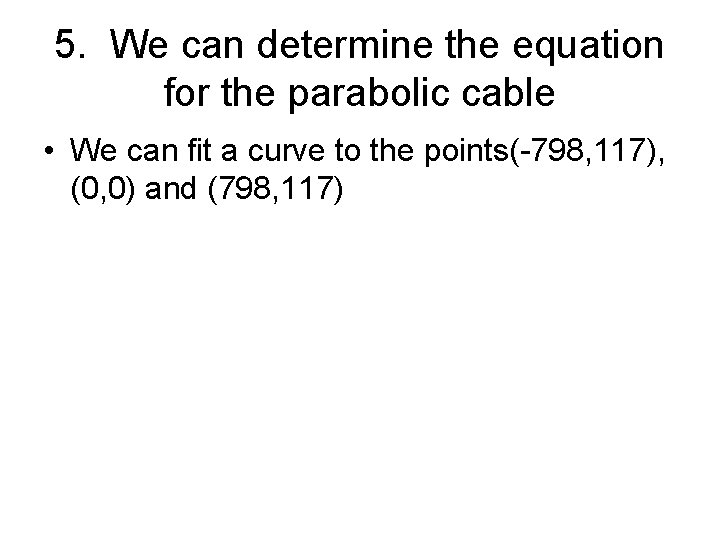
5. We can determine the equation for the parabolic cable • We can fit a curve to the points(-798, 117), (0, 0) and (798, 117)
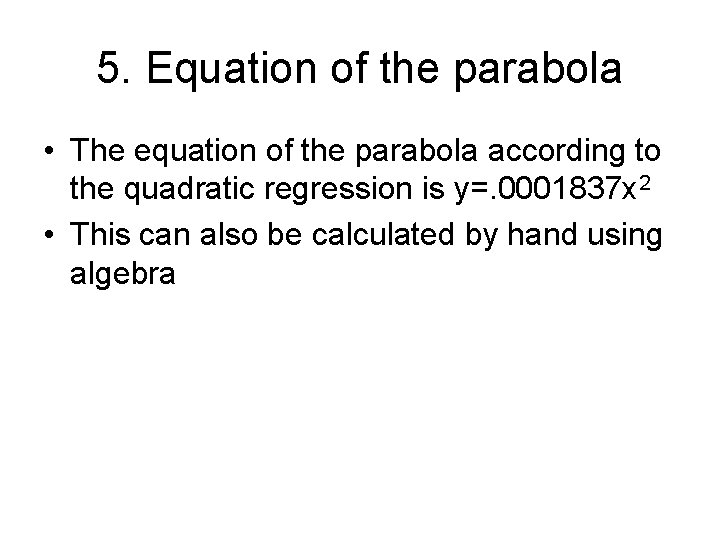
5. Equation of the parabola • The equation of the parabola according to the quadratic regression is y=. 0001837 x 2 • This can also be calculated by hand using algebra
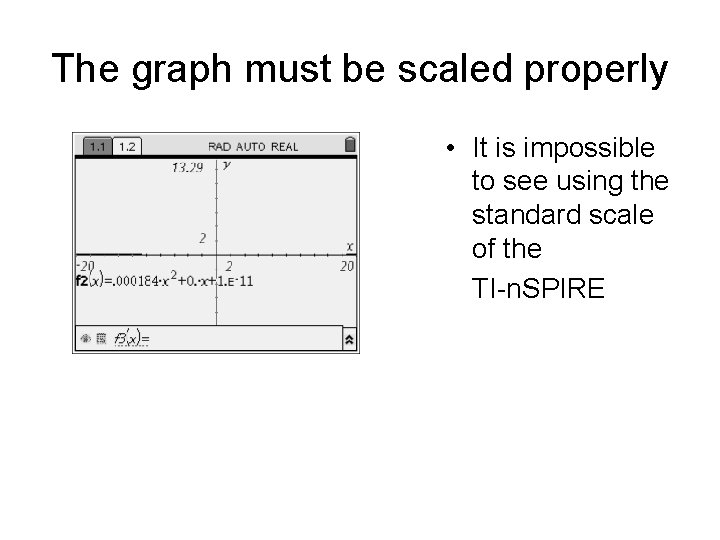
The graph must be scaled properly • It is impossible to see using the standard scale of the TI-n. SPIRE
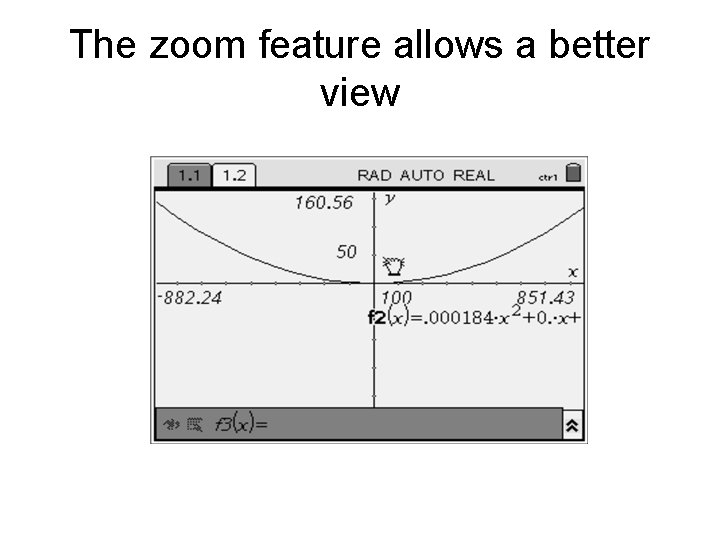
The zoom feature allows a better view
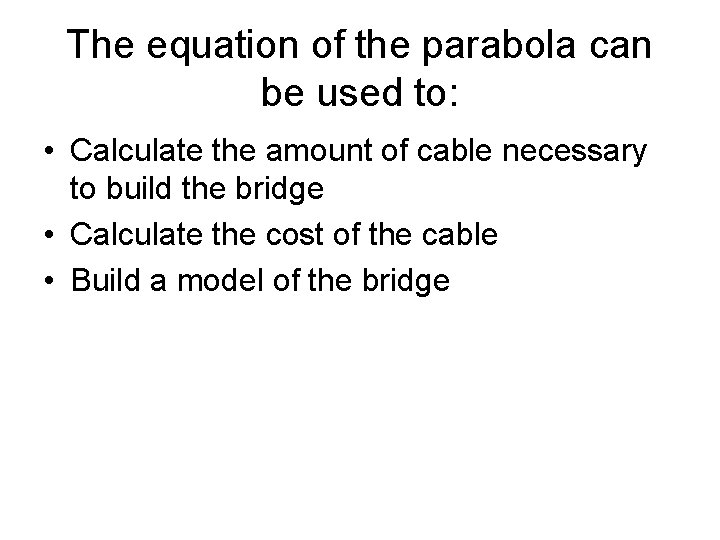
The equation of the parabola can be used to: • Calculate the amount of cable necessary to build the bridge • Calculate the cost of the cable • Build a model of the bridge
Difficulties • Students must know proper scaling when dealing with real life situations and large numbers • Although the new TI-n. SPIRE has a wide variety of capabilities, it is not user friendly • The “regression” feature would seem mysterious to students; it would be ideal to do an algebraic derivation of this work and compare results to what the calculator found.
Extensions • Students could compare the equation of the parabolic cable of the Brooklyn Bridge to the equation of other local suspension bridges • Students could do a historical study of the Brooklyn Bridge
Assessment • This type of project would require ongoing assessment. • A rubric might include such categories as – Uses a sensible coordinate axis system to represent graphs – Is able to interpret results of the graph and apply to solving problems – Is able to determine whether results make sense in the context of examination of the bridge
- Slides: 16