
SurvivalTime Classification of Breast Cancer Patients DIMACS Workshop

Survival-Time Classification of Breast Cancer Patients DIMACS Workshop on Data Mining and Scalable Algorithms August 22 -24, 2001 - Rutgers University Y. -J. Lee, O. L. Mangasarian & W. H. Wolberg Data Mining Institute University of Wisconsin - Madison Second Annual Review June 1, 2001
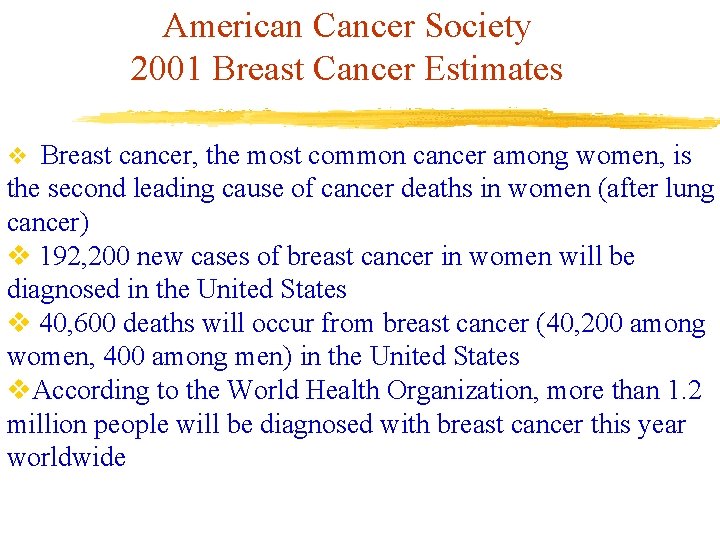
American Cancer Society 2001 Breast Cancer Estimates v Breast cancer, the most common cancer among women, is the second leading cause of cancer deaths in women (after lung cancer) v 192, 200 new cases of breast cancer in women will be diagnosed in the United States v 40, 600 deaths will occur from breast cancer (40, 200 among women, 400 among men) in the United States v. According to the World Health Organization, more than 1. 2 million people will be diagnosed with breast cancer this year worldwide
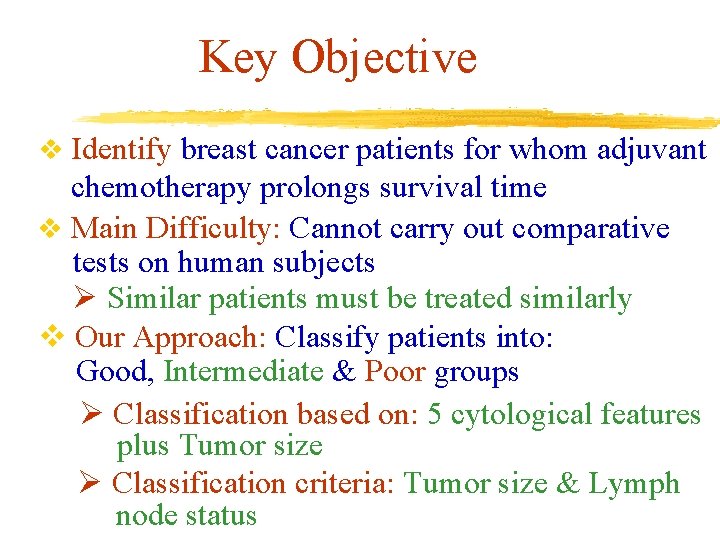
Key Objective v Identify breast cancer patients for whom adjuvant chemotherapy prolongs survival time v Main Difficulty: Cannot carry out comparative tests on human subjects Ø Similar patients must be treated similarly v Our Approach: Classify patients into: Good, Intermediate & Poor groups Ø Classification based on: 5 cytological features plus Tumor size Ø Classification criteria: Tumor size & Lymph node status
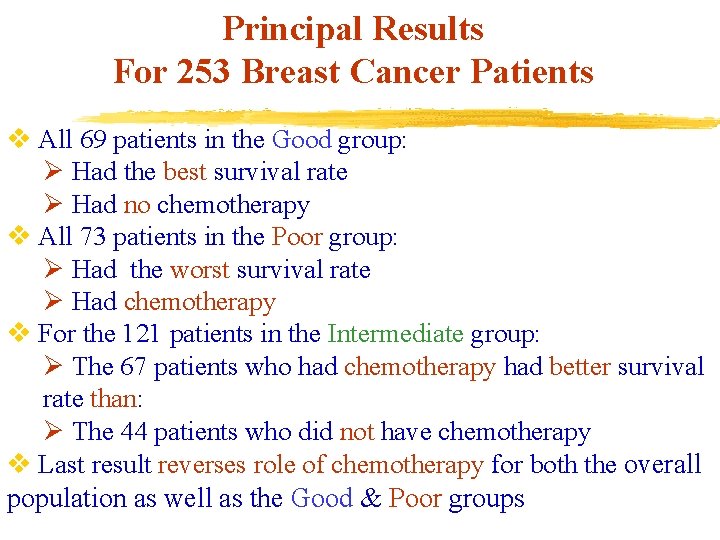
Principal Results For 253 Breast Cancer Patients v All 69 patients in the Good group: Ø Had the best survival rate Ø Had no chemotherapy v All 73 patients in the Poor group: Ø Had the worst survival rate Ø Had chemotherapy v For the 121 patients in the Intermediate group: Ø The 67 patients who had chemotherapy had better survival rate than: Ø The 44 patients who did not have chemotherapy v Last result reverses role of chemotherapy for both the overall population as well as the Good & Poor groups
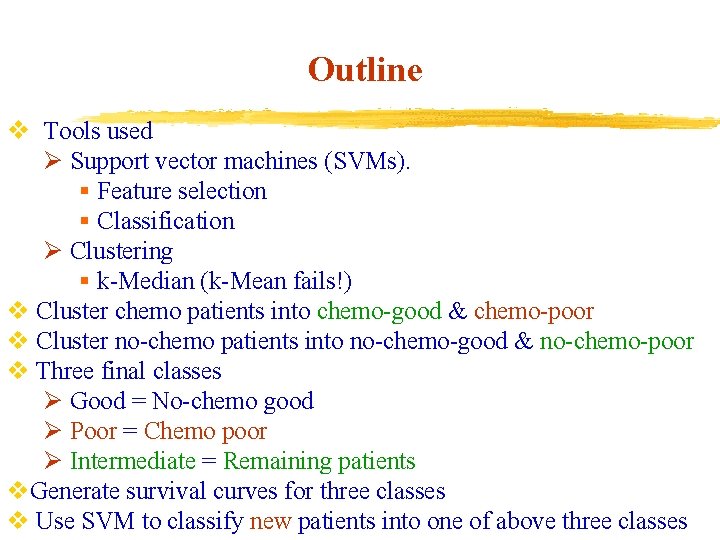
Outline v Tools used Ø Support vector machines (SVMs). § Feature selection § Classification Ø Clustering § k-Median (k-Mean fails!) v Cluster chemo patients into chemo-good & chemo-poor v Cluster no-chemo patients into no-chemo-good & no-chemo-poor v Three final classes Ø Good = No-chemo good Ø Poor = Chemo poor Ø Intermediate = Remaining patients v. Generate survival curves for three classes v Use SVM to classify new patients into one of above three classes
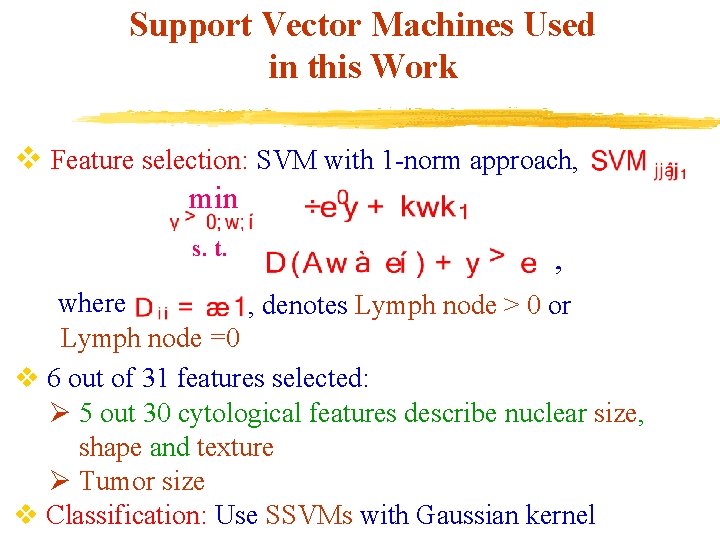
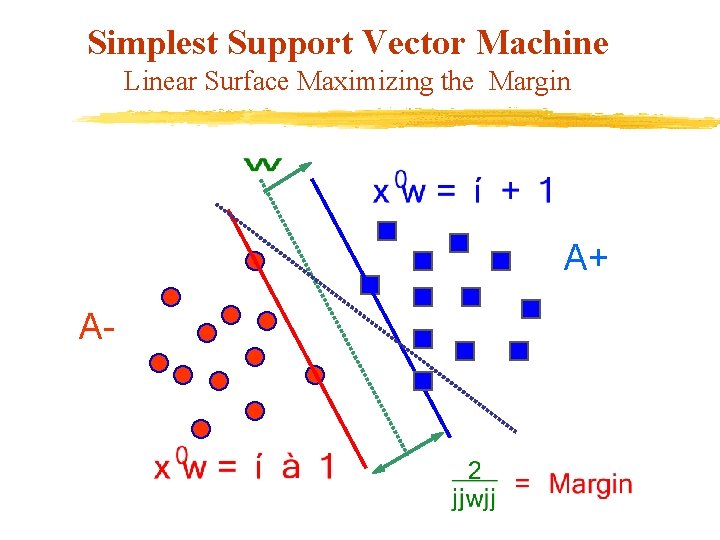
Support Vector Machines Used in this Work v Feature selection: SVM with 1 -norm approach, min s. t. , where , denotes Lymph node > 0 or Lymph node =0 v 6 out of 31 features selected: Ø 5 out 30 cytological features describe nuclear size, shape and texture Ø Tumor size v Classification: Use SSVMs with Gaussian kernel
Clustering in Data Mining General Objective v Given: A dataset of m points in n-dimensional real space v Problem: Extract hidden distinct properties by clustering the dataset
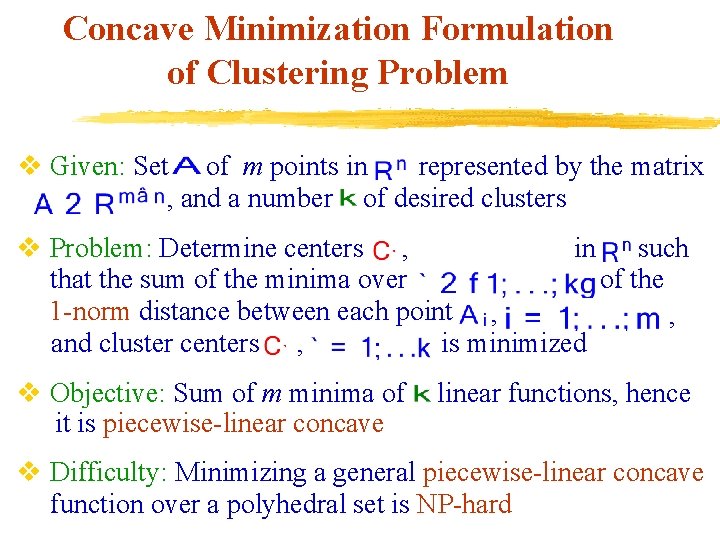
Concave Minimization Formulation of Clustering Problem v Given: Set of m points in represented by the matrix , and a number of desired clusters in such v Problem: Determine centers , that the sum of the minima over of the 1 -norm distance between each point , , is minimized and cluster centers , v Objective: Sum of m minima of it is piecewise-linear concave linear functions, hence v Difficulty: Minimizing a general piecewise-linear concave function over a polyhedral set is NP-hard

Clustering via Concave Minimization v Minimize the sum of 1 -norm distances between each data point and the closest cluster center : min s. t. v Reformulation: min s. t.
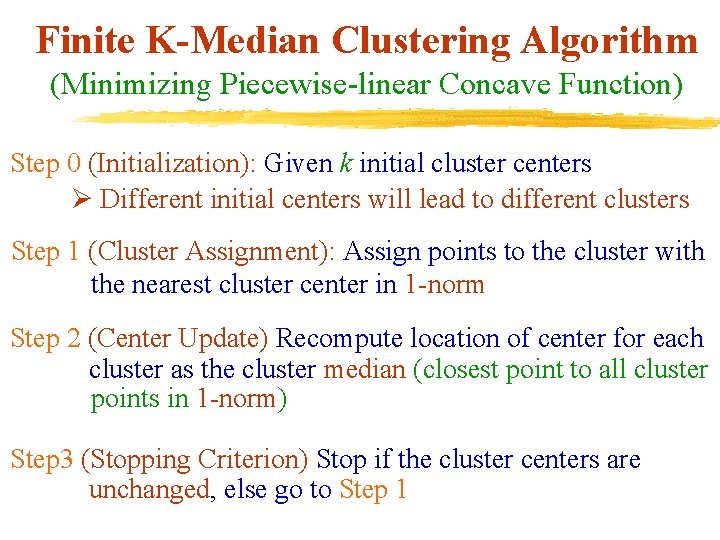
Finite K-Median Clustering Algorithm (Minimizing Piecewise-linear Concave Function) Step 0 (Initialization): Given k initial cluster centers Ø Different initial centers will lead to different clusters Step 1 (Cluster Assignment): Assign points to the cluster with the nearest cluster center in 1 -norm Step 2 (Center Update) Recompute location of center for each cluster as the cluster median (closest point to all cluster points in 1 -norm) Step 3 (Stopping Criterion) Stop if the cluster centers are unchanged, else go to Step 1
Clustering Process: Feature Selection & Initial Cluster Centers ) v 6 out of 31 features selected by a linear SVM ( Ø SVM separating lymph node positive (Lymph > 0) from lymph node negative (Lymph = 0) v Perform k-Median algorithm in 6 -dimensional feature space v Initial cluster centers used: Medians of Good 1 & Poor 1 Ø Good 1: Patients with Lymph = 0 AND Tumor < 2 Ø Poor 1: Patients with Lymph > 4 OR Tumor § Typical indicator for chemotherapy
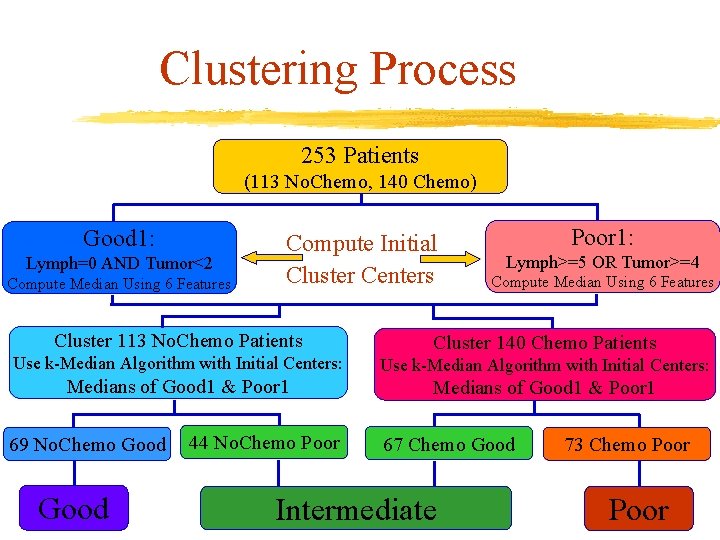
Clustering Process 253 Patients (113 No. Chemo, 140 Chemo) Good 1: Lymph=0 AND Tumor<2 Compute Median Using 6 Features Compute Initial Cluster Centers Poor 1: Lymph>=5 OR Tumor>=4 Compute Median Using 6 Features Cluster 113 No. Chemo Patients Cluster 140 Chemo Patients Use k-Median Algorithm with Initial Centers: Medians of Good 1 & Poor 1 69 No. Chemo Good 44 No. Chemo Poor 67 Chemo Good Intermediate 73 Chemo Poor
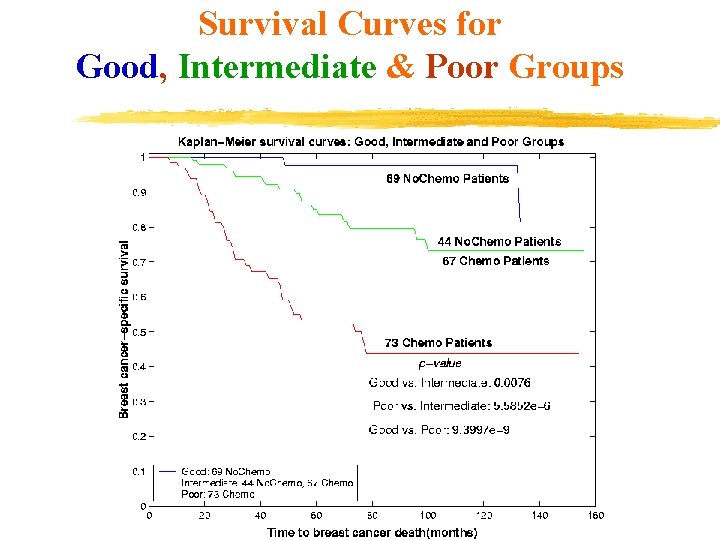
Survival Curves for Good, Intermediate & Poor Groups
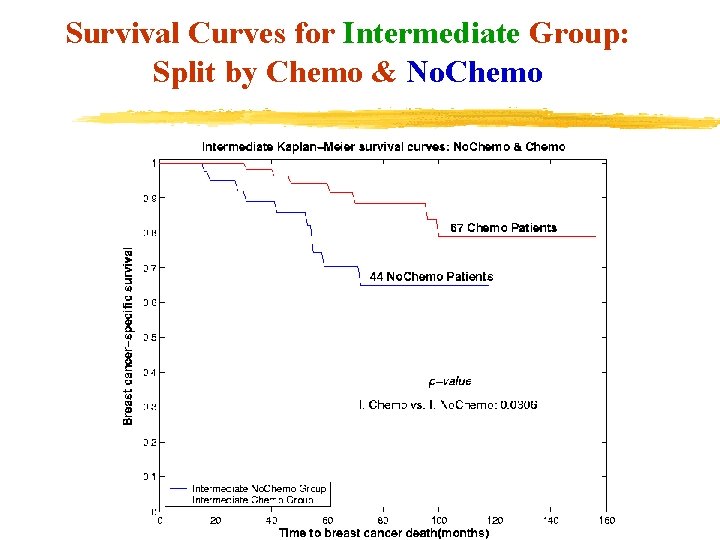
Survival Curves for Intermediate Group: Split by Chemo & No. Chemo
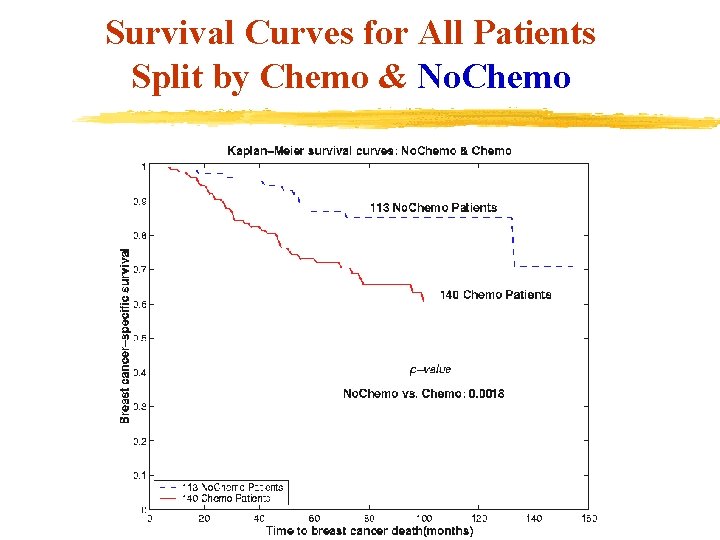
Survival Curves for All Patients Split by Chemo & No. Chemo
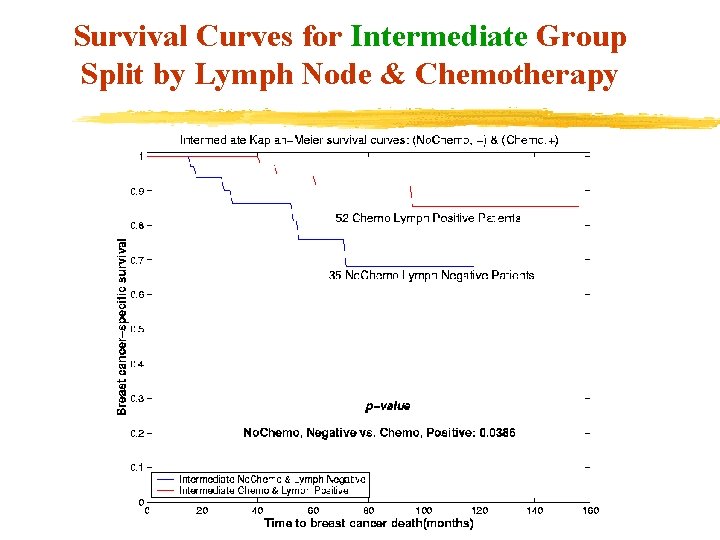
Survival Curves for Intermediate Group Split by Lymph Node & Chemotherapy
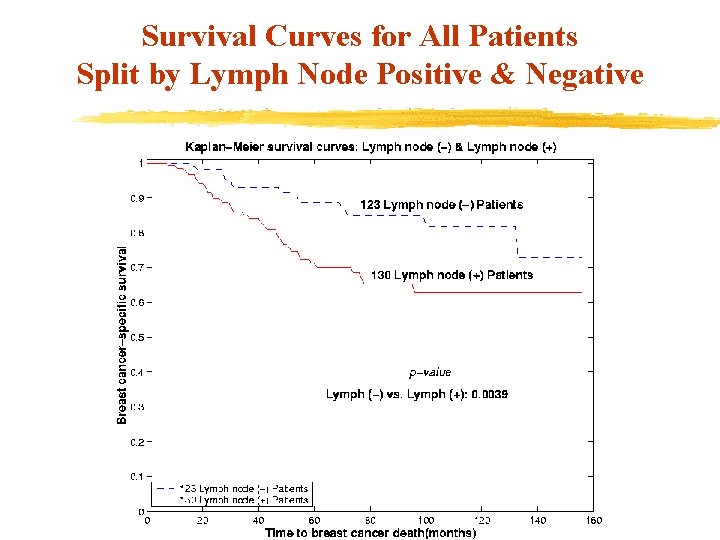
Survival Curves for All Patients Split by Lymph Node Positive & Negative
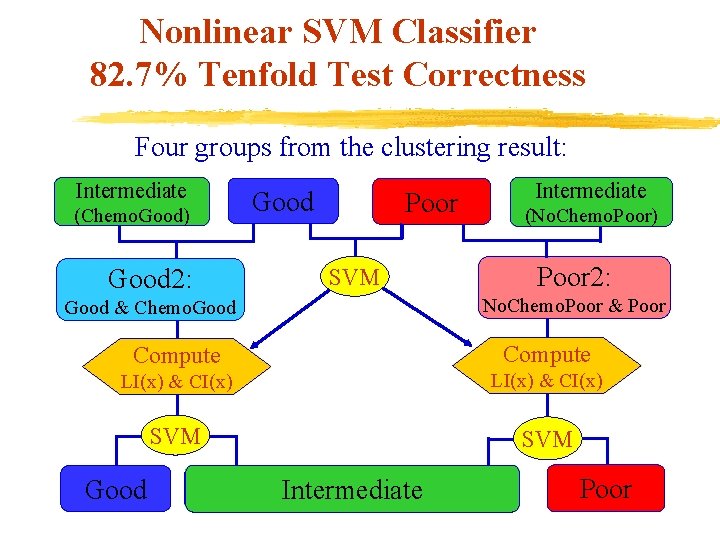
Nonlinear SVM Classifier 82. 7% Tenfold Test Correctness Four groups from the clustering result: Intermediate Good (Chemo. Good) Good 2: Poor SVM Good & Chemo. Good Intermediate (No. Chemo. Poor) Poor 2: No. Chemo. Poor & Poor Compute LI(x) & CI(x) SVM Good Intermediate Poor
Conclusion v Used five feature from a fine needle aspirate & tumor size to cluster breast cancer patients into 3 groups: Ø Good – No chemotherapy recommended Ø Intermediate – Chemotherapy likely to prolong survival Ø Poor – Chemotherapy may or may not enhance survival v 3 groups have very distinct survival curves v First categorization of a breast cancer group for which chemotherapy enhances longevity v Prescribe a SVM classification procedure to classify new patients into one of above three groups
Simplest Support Vector Machine Linear Surface Maximizing the Margin A+ A-
Key Objective v Identify breast cancer patients for whom adjuvant chemotherapy prolongs survival time v Main Difficulty: Cannot carry out comparative tests on human subjects Ø Similar patients must be treated similarly v Our Approach: Classify patients into: good, intermediate & poor groups Ø Characterize classes by: Tumor size & lymph node status Ø Classification based on: 5 cytological features plus tumor size
Clustering Process: Feature Selection & Initial Cluster Centers v 6 out of 31 features selected by a linear SVM Ø SVM separating lymph node positive (Lymph>0) from lymph node negative (Lymph=0) v Clustering performed in 6 -dimensional feature space v Initial cluster centers used: Ø Good: Median in 6 -dimensional space of patients with Lymph=0 AND Tumor <2 Ø Poor: Median in 6 -dimensional space of patients with of Lymph>4 OR Tumor >4 § Typical indicator for chemotherapy
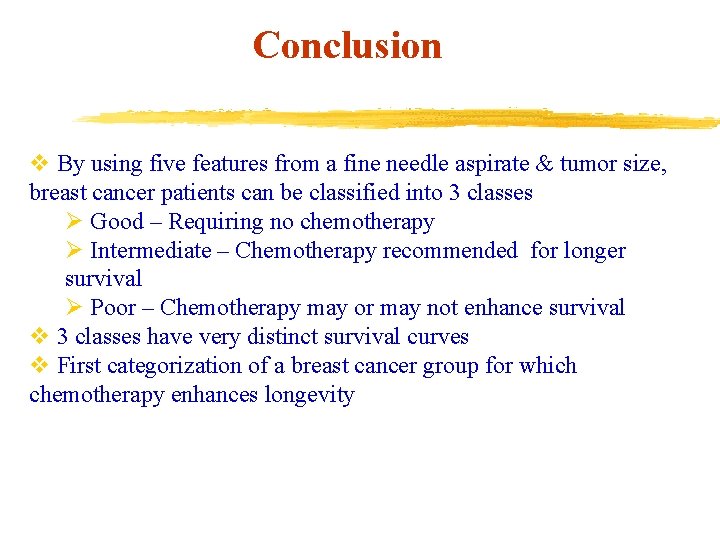
Conclusion v By using five features from a fine needle aspirate & tumor size, breast cancer patients can be classified into 3 classes Ø Good – Requiring no chemotherapy Ø Intermediate – Chemotherapy recommended for longer survival Ø Poor – Chemotherapy may or may not enhance survival v 3 classes have very distinct survival curves v First categorization of a breast cancer group for which chemotherapy enhances longevity
- Slides: 23