Survey Data Conflicts and Bias and Temporal Variation

Survey Data Conflicts and Bias and Temporal Variation of Model Parameters of St. Matthew Island Blue King Crab J. Zheng, D. Pengilly and V. A. Vanek ADF&G, Juneau & Kodiak

Distribution of blue king crab Paralithodes platypus in the Gulf of Alaska, Bering Sea, and Aleutian Islands waters. Shown in blue. St. Matthew Is.

Basic Biology of SM Blue King Crab 1. 2. 3. 4. 5. Maximum age is about 20 -25 years Basic M = 0. 18, based on 1% rule Functional size at male maturity: 105 mm CL Minimum size for commercial fishery: 120 mm CL Mean growth increment per molt for mature males: 14. 1 mm 6. Difficult to catch females during surveys, so model only males
: Nt = [ N 1, t,")
Three stage model (90 -104, 105 -119, 120+mm): Nt = [ N 1, t, N 2, t, N 3, t ]T Transition matrix: Pot retained catch and bycatch: Recruitment: Nnewt+1 = [ Nnew 1, t+1, 0 ]T

Loglikelihoods 1. Trawl survey biomass or pot survey CPUE: 2. Retained catch or bycatch: 3. Stage compositions (pl, t, k): CVt=CVt, sur. When estimating additional CV: CVt=(CVt, sur+CVest) Effective sample sizes: min(N, 0. 5*observed values) for surveys, min(N, 0. 1*observed values) for fishery, N=50 for trawl survey, 100 for pot survey, 25 for fishery (1978 -1998) & 100 (2009 -14) 4. Small penalties of deviations of ln(Rt) and ln(Ft):

Data 1. Trawl survey: 1978 -2015 2. Pot survey: Triennial pot survey 1995 -2013 & 2015 3. Retained catch: 1978 -98, 20092012 & 2014 4. Pot observer bycatch: 1990 -98, 2009 -2012 & 2014 5. Groundfisheries observer bycatch: 1992 -2014

Scenario 1: constant survey selectivities over time Residuals

Scenario 1: constant survey selectivities over time

Scenario 1: constant survey selectivities over time: Residuals of stage compositions (filled circles: observed higher than predicted) Trawl survey

Scenario 2: Random walk to estimate trawl survey selectivities Selectivity = 1 for stage 3. Solve temporal bias problems of stage comp. data
 of survey selectivities and esti.")
Scenario 3: Two time blocks (pre-2000 & after 1999) of survey selectivities and esti. additional survey biomass/cpue CVs Residuals
 of survey selectivities and esti.")
Scenario 3: Two time blocks (pre-2000 & after 1999) of survey selectivities and esti. additional survey biomass/cpue CVs
 of survey selectivities and esti.")
Scenario 3: Two time blocks (pre-2000 & after 1999) of survey selectivities and esti. additional survey biomass/cpue CVs: Residuals of stage compositions Pot survey
 of survey selectivities and esti.")
Scenario 3: Two time blocks (pre-2000 & after 1999) of survey selectivities and esti. additional survey biomass/cpue CVs

Trawl and Pot Survey Stations R-24 Blue king crab are found primarily within the pot survey area and trawl station R-24

Pot survey CPUE in trawl station R-24 in 2013. High density area is a spatial area with CPUE > mean CPUE of the standard 84 pot survey stations within NMFS multi-tow area Heavy red line is the identified “high density” area in R-24, 45% of water in 2013, and 35% in 2015, with 40% mean. Circles are proportional to pot station CPUE. Pot survey CPUE in 2015 cannot be shown due to state law Trawl station R-24 With 30 pot stations in 2013 and 20 pot stations in 2015 Red X denotes center of trawl station R-24

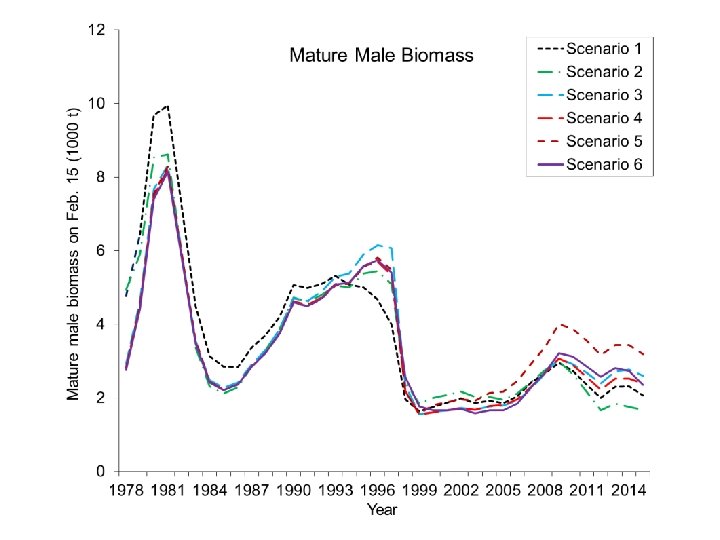
NMFS Trawl Area. Swept Estimates Scenarios 1, 2 & 3 NMFS Trawl Area. Swept Estimates Scenarios 4, 5 & 6

Scenario 4: Scenario 3 with trawl survey abundance adjustment in station R-24

Parameter Confounding • Many parameters are confounding in a length-based model. Changes in estimated survey selectivities could be the results of other parameter changes. • Scenario 5: Scenario 4 except for constant survey selectivities over time and estimating molting probability during 20002015. • Scenario 6: Scenario 4 except for increasing M from 0. 18 to 0. 36 during 2000 -2015.

Scenario 5: Estimating molting probability during 2000 -2015 Scenario 6: Increasing M from 0. 18 to 0. 36 during 2000 -2015

Summary ü Changes in spatial distributions may be the reason for two survey data conflicts during recent years. ü Adjustment of trawl survey abundance in station R-24 and estimating two additional survey biomass/CPUE CVs inside the model may have solved the data conflict problems. ü Estimating survey selectivities in two time blocks eliminates the temporal residual biases of both survey biomass/CPUE and composition data. ü Due to parameter confounding, estimated survey selectivity values depend on assumed M and molting probabilities. Differences of estimated survey selectivities between two time blocks may be due to change in spatial distributions, M, or molting probabilities.
 Best fit of")
Choice of Model Scenarios 1. Our preferred choice: Scenario 4: (1) Best fit of the data, (2) No bias, (3) Relatively stable retrospective results, (4) Reasonable adjustment of abundance in trawl survey station R-24, (5) Reasonably to solve two survey data conflicts during recent years. 2. Authorized decision: Scenario 1, further work on other scenarios. 3. What is your choice?

Thank you
- Slides: 24